
[Advice from a Lazy Full-Time Trader] Heikin-Ashi
0
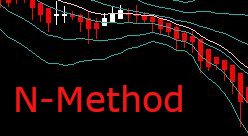
N-Method uses Heikin-Ashi, but it makes the direction easier to grasp.
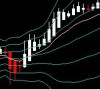
The following is a one-hour candlestick chart.

Next is Heikin-Ashi.

This is a decline, but it tends to continue like this.
Since it comes standard with MT4, you can treat it as a fairly popular indicator.
It is especially strong when a trend occurs. In ranging markets, Heikin-Ashi on higher timeframes tends to produce more false signals.
By the way, the Heikin-Ashi of a certain timeframe and the candlestick of twice that timeframe have similar colors, don't they?
Don't rely on it too much; determine in what situations it works and when it deceives.
Let's discern this.
[If you study seriously, you will surely be rewarded] Here is N-Method↓↓
× ![]()