

Utilization of "Visualization Indicators" (Part 206)
“Visualization Indicator” usage (part206)”
1. Further evolve the “28 Currency Pairs List Indicator” into an indicator
“8CPVisualization Indicator” forUSDCHF,GBPCAD,CADJPY to plot
“8CPVisualization Indicator” includesOceania version,London version,NewYork version,AnyCP version. This time, we used theNewYork version.
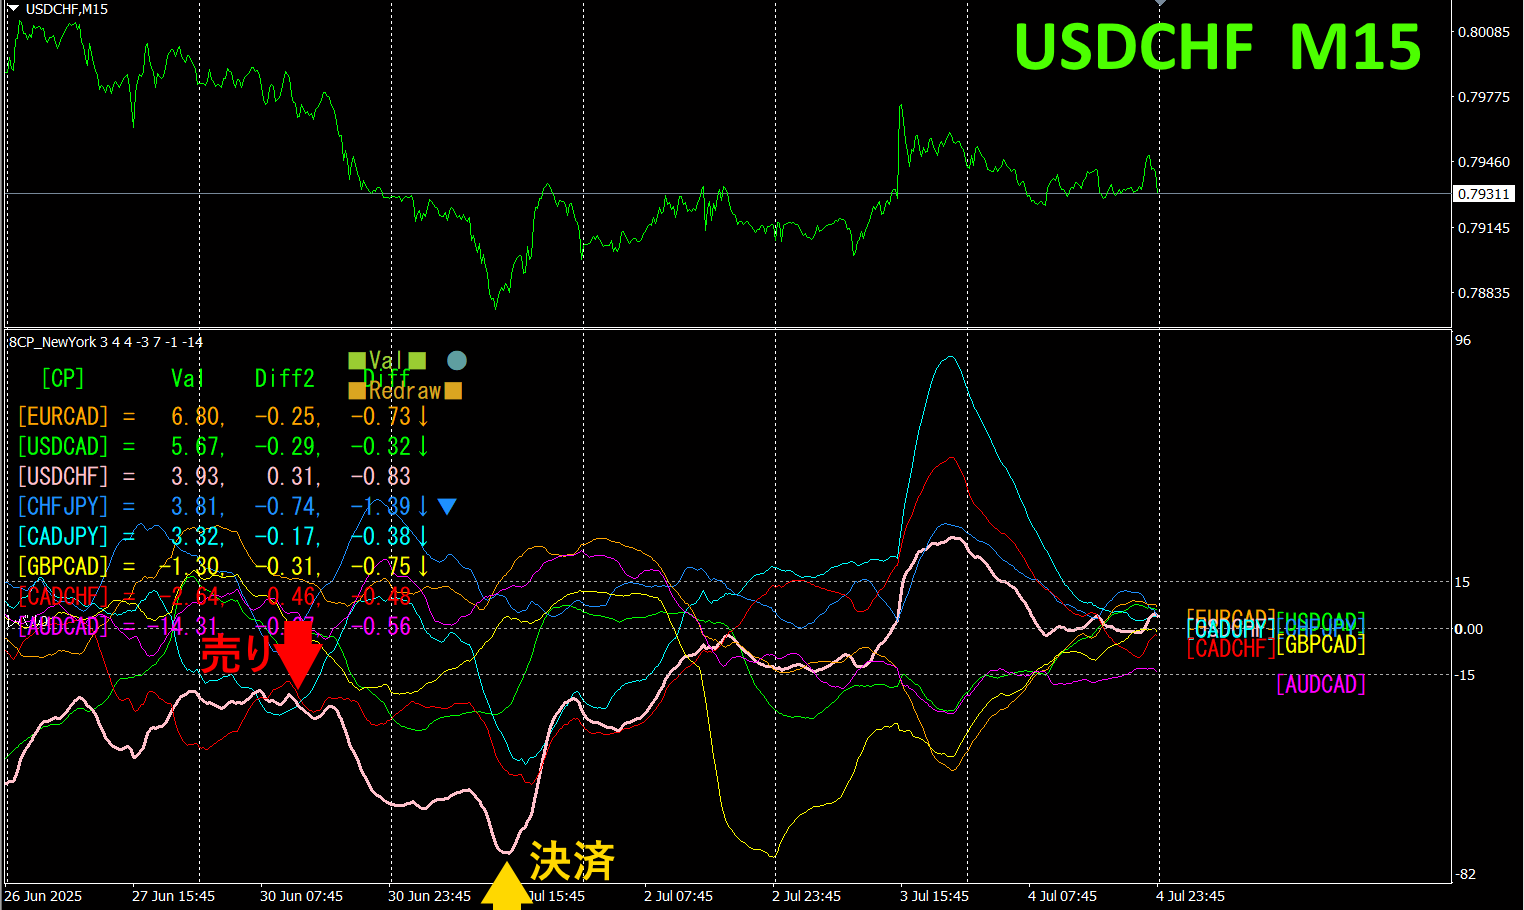
The upper half is the 15-minute chart ofUSDCHF. The lower half is the output by the “8CPVisualization Indicator”; the pink solid line graph corresponds toUSDCHF.
On Monday, the USDCHF graph fell below the other graph group, so we sold. On Tuesday, it hit a bottom and reversed, so we closed. It yielded about90pips of profit.
The upper half is the 15-minute chart ofGBPCAD. The lower half is the output by the “8CPVisualization Indicator”; the yellow solid line graph corresponds toGBPCAD.
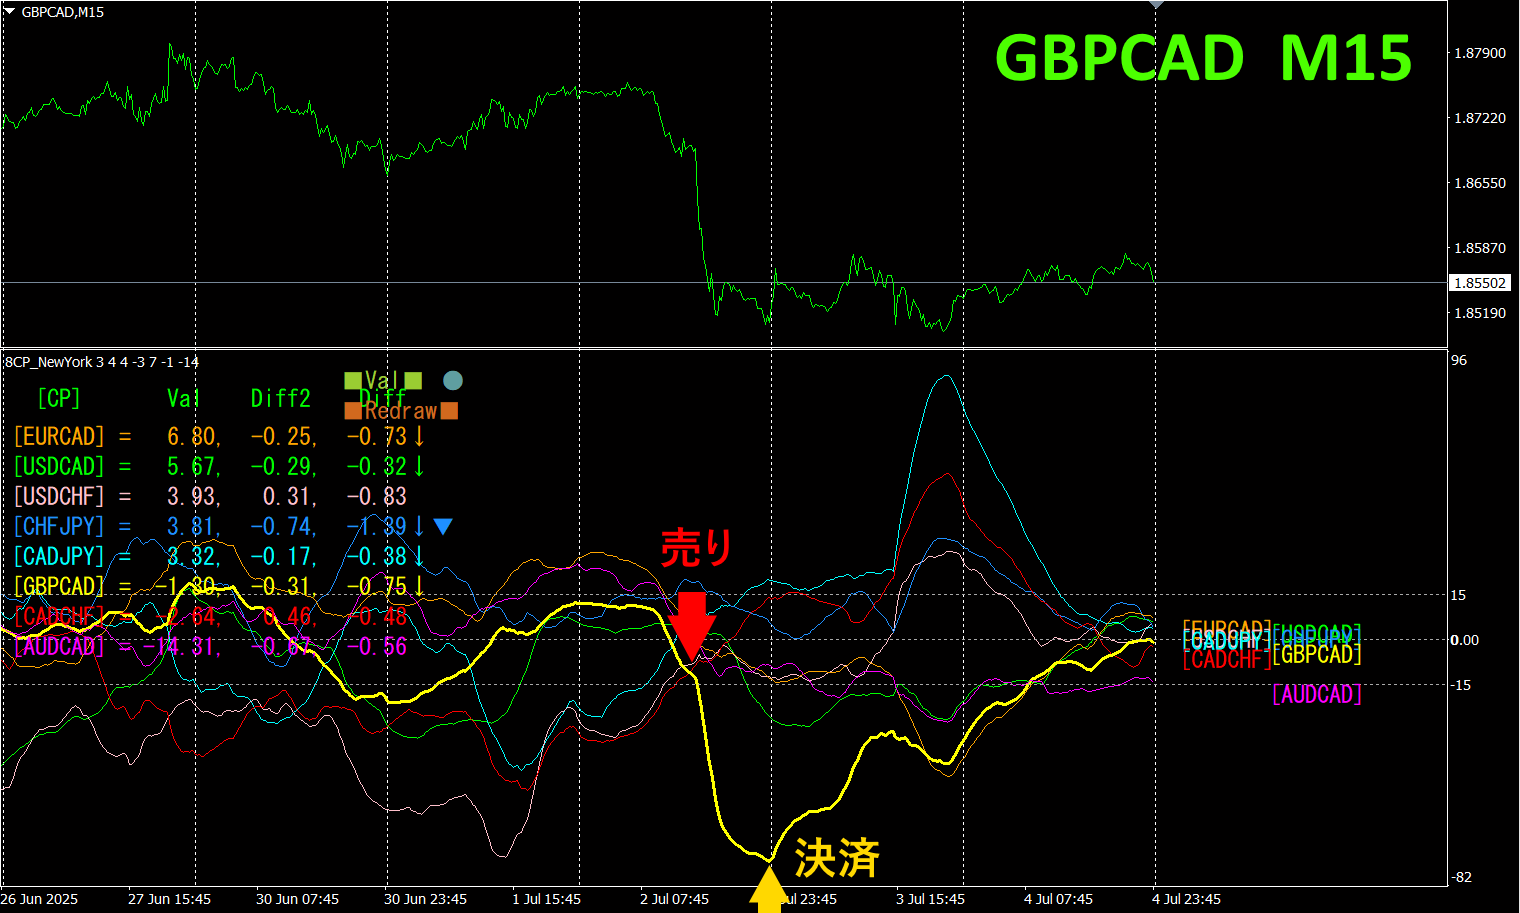
On Wednesday, the GBPCAD graph fell below the other graphs, so we sold. It hit a bottom on the same day, so we closed. It yielded about180pips of profit.
The upper half is the CADJPY 15-minute chart. The lower half is the output by the “8CPVisualization Indicator”; the light blue solid line graph corresponds toCADJPY.
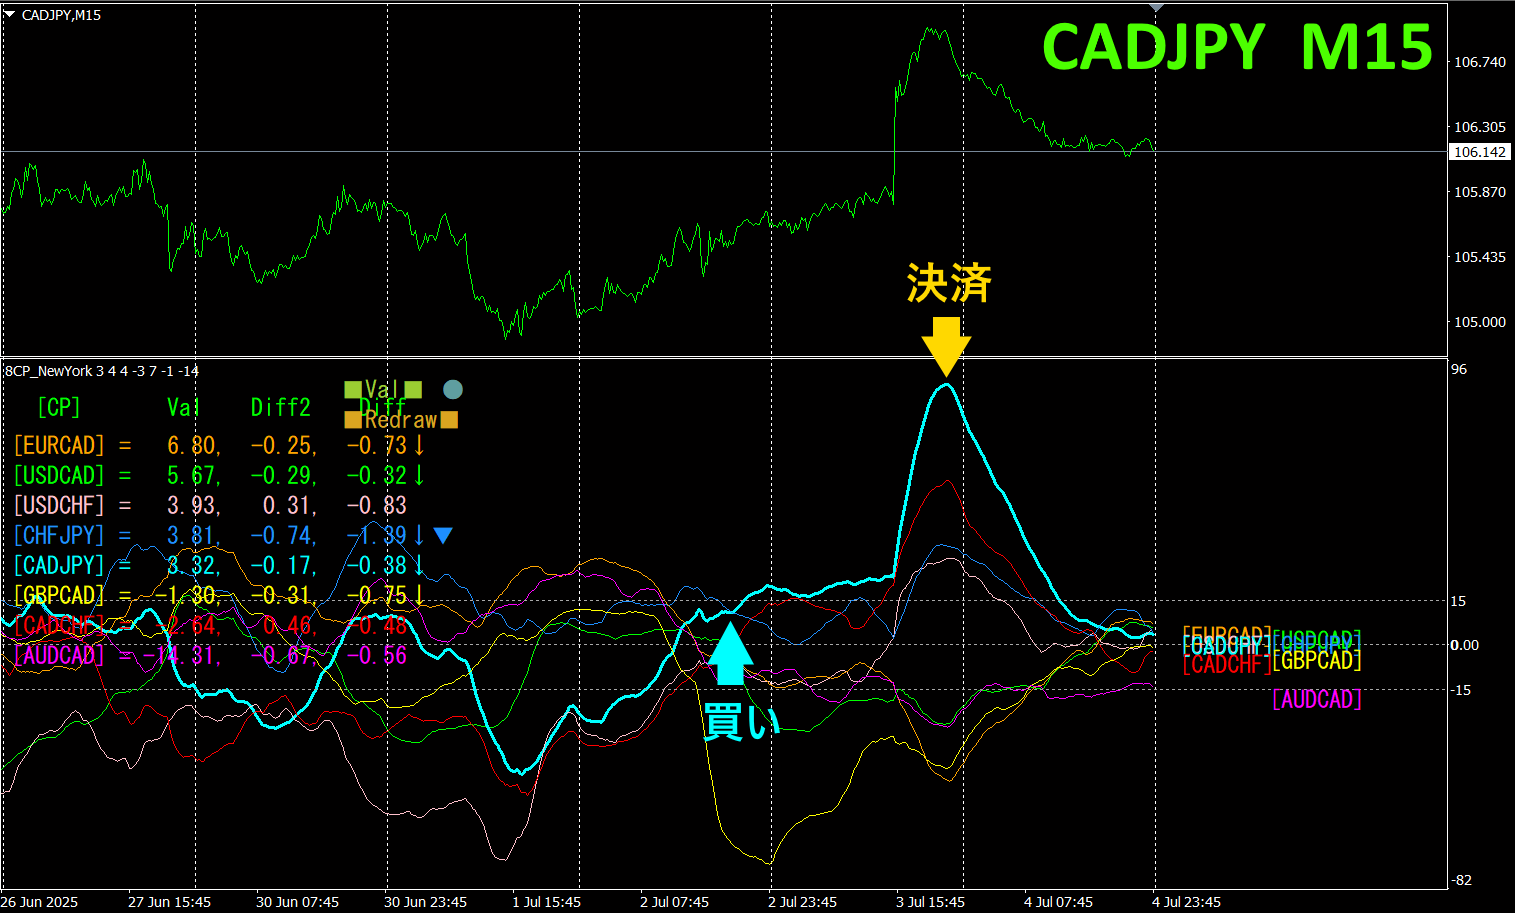
On Wednesday, the CADJPY graph rose above the others, so we bought. On Thursday, it reached a peak, so we closed. It yielded about140pips of profit.
If you have the “8CPVisualization Indicator” for NewYork,
USDCHF 90pips
GBPCAD 180pips
CADJPY 140pips
Total410pips profit was earned.
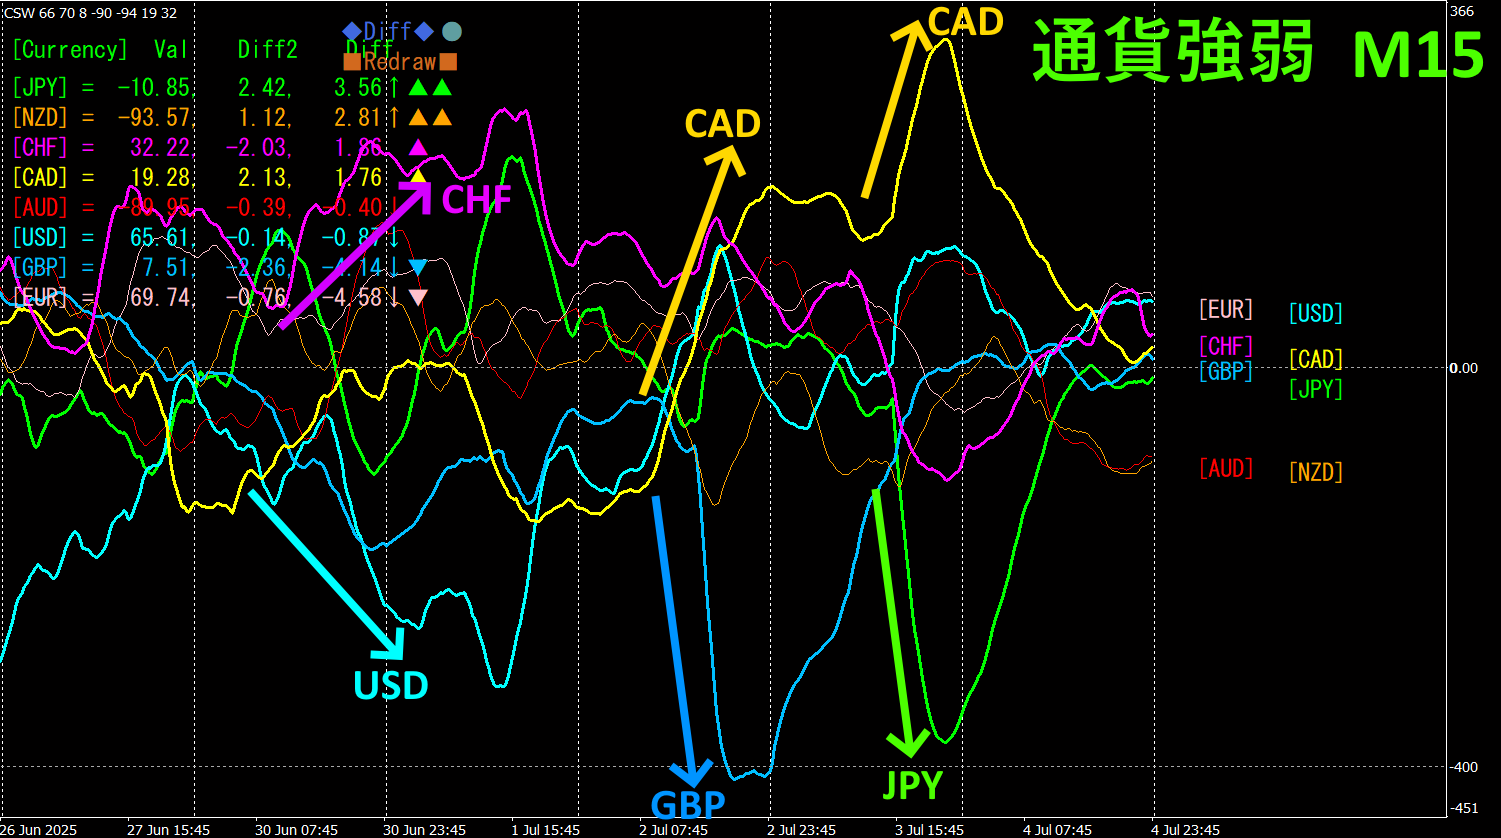
Currency Strength Arrow Graph
The 15-minute currency strength graph shows that USD and CHF, GBP and CAD, JPY and CAD have a pronounced inverse correlation. When a pair with strong growth is selected in inverse correlation, it is a good choice.
“Aim for Currency Strength Inverse Correlation!” is FX’s iron rule.
Using “TrendLine-EX,” entry and exit can be automated by crossing diagonal trendlines. It can be left as is for easy trading. “TrendLine-EX” is a semi-automatic EA that sells automatically on downward line crossing and closes automatically on upward line crossing.
2. Best SelectIndicator try-out
The figure below is a screenshot from2025 year7323:21 JST).
[Total]The numbers are sorted in descending order. At the top is, is excluded; all other timeframes show blue coloring. value is +, a large positive number. Across all timeframes, it is clear that an uptrend is developing for.
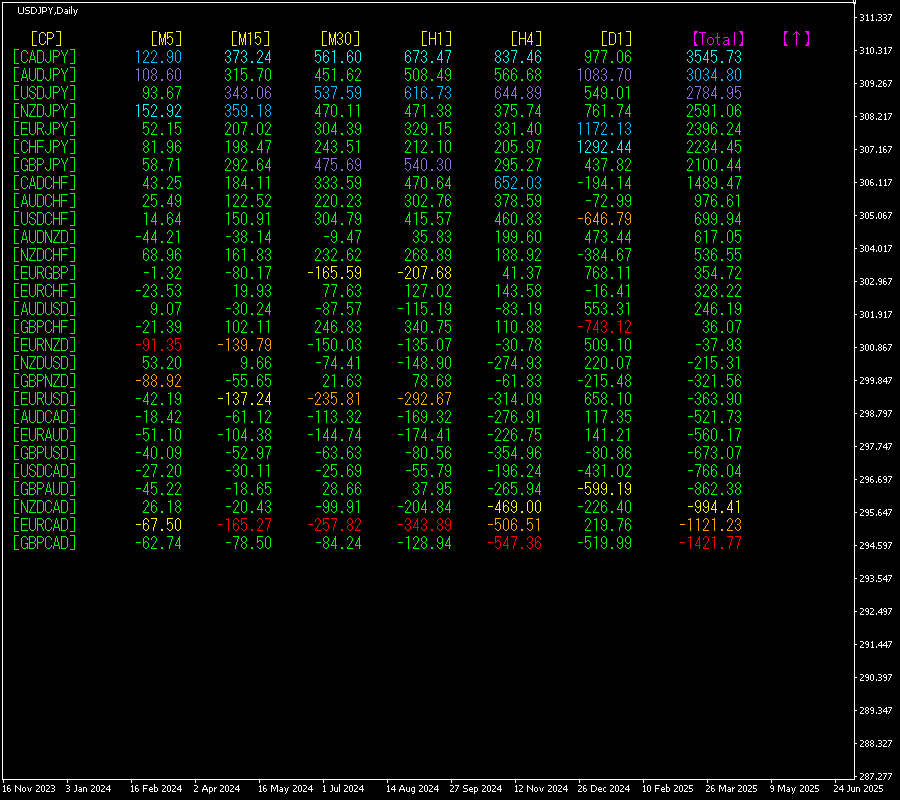
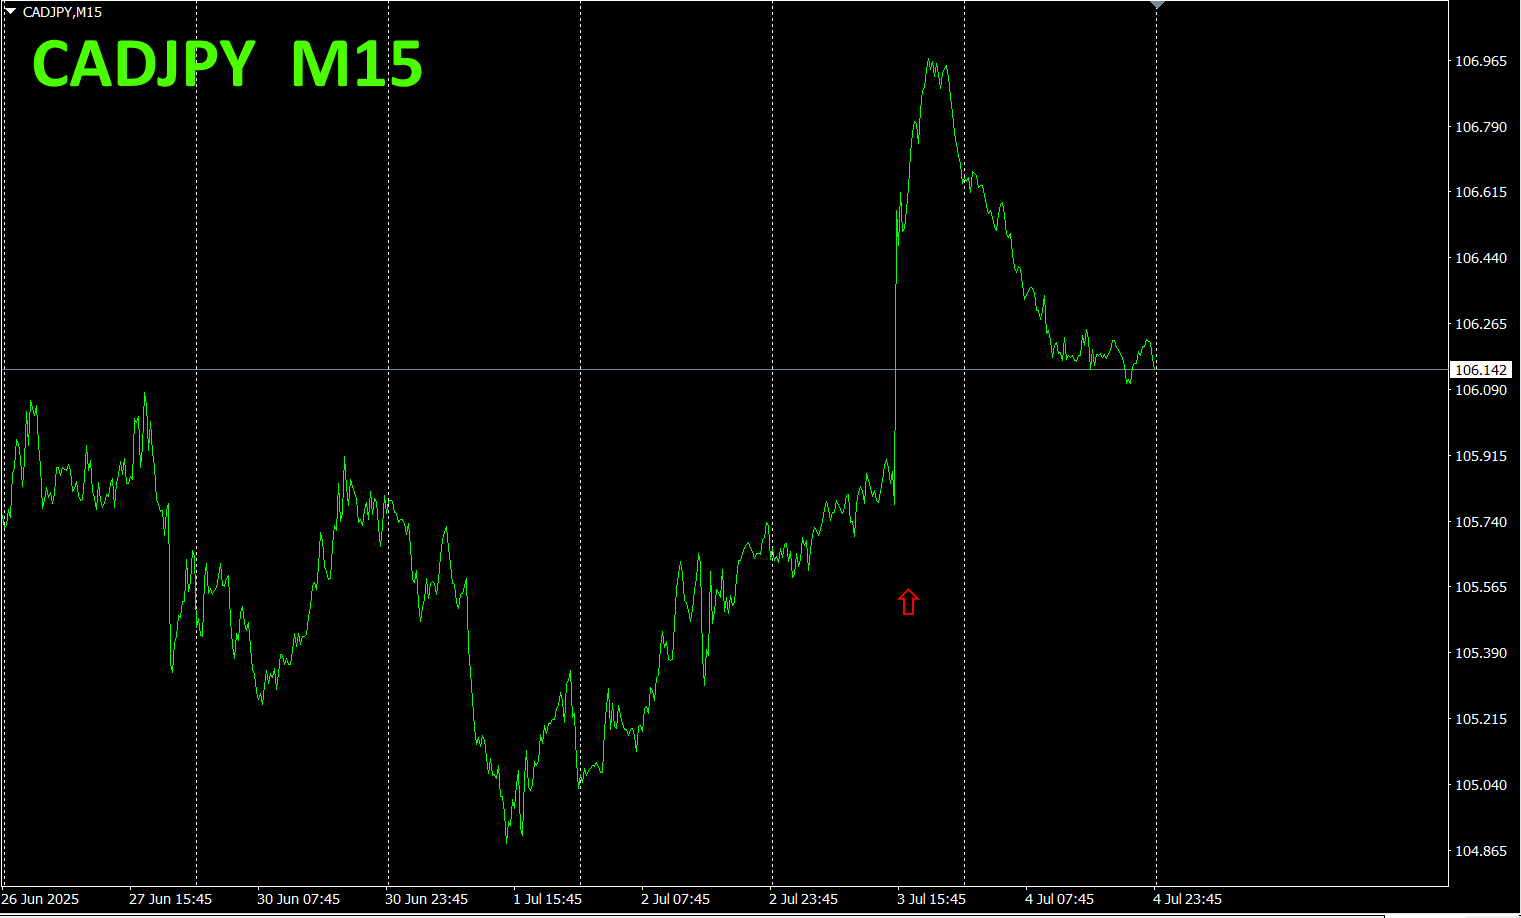
Now, let’s look at the CADJPY chart.
The red arrow marks the point where the screenshot was taken. It corresponds to a sharp move during an uptrend.
“28 currency pairs
“28 currency pairs indicator”

https://www.gogojungle.co.jp/tools/indicators/35128
3. 2021 year5 month to present EURJPY
Since year May, we have been tracking movements.
To view the overall trend, we are drawing about the last minutes over roughly weeks in 30-minute charts.
Last time I wrote the following.
Pink is, green is. and have opposing currency strength. In the currency strength chart, is slightly downward, is upward, so we expect to move downward.
Until Thursday, resistance remained, but it has now surpassed the recent high.
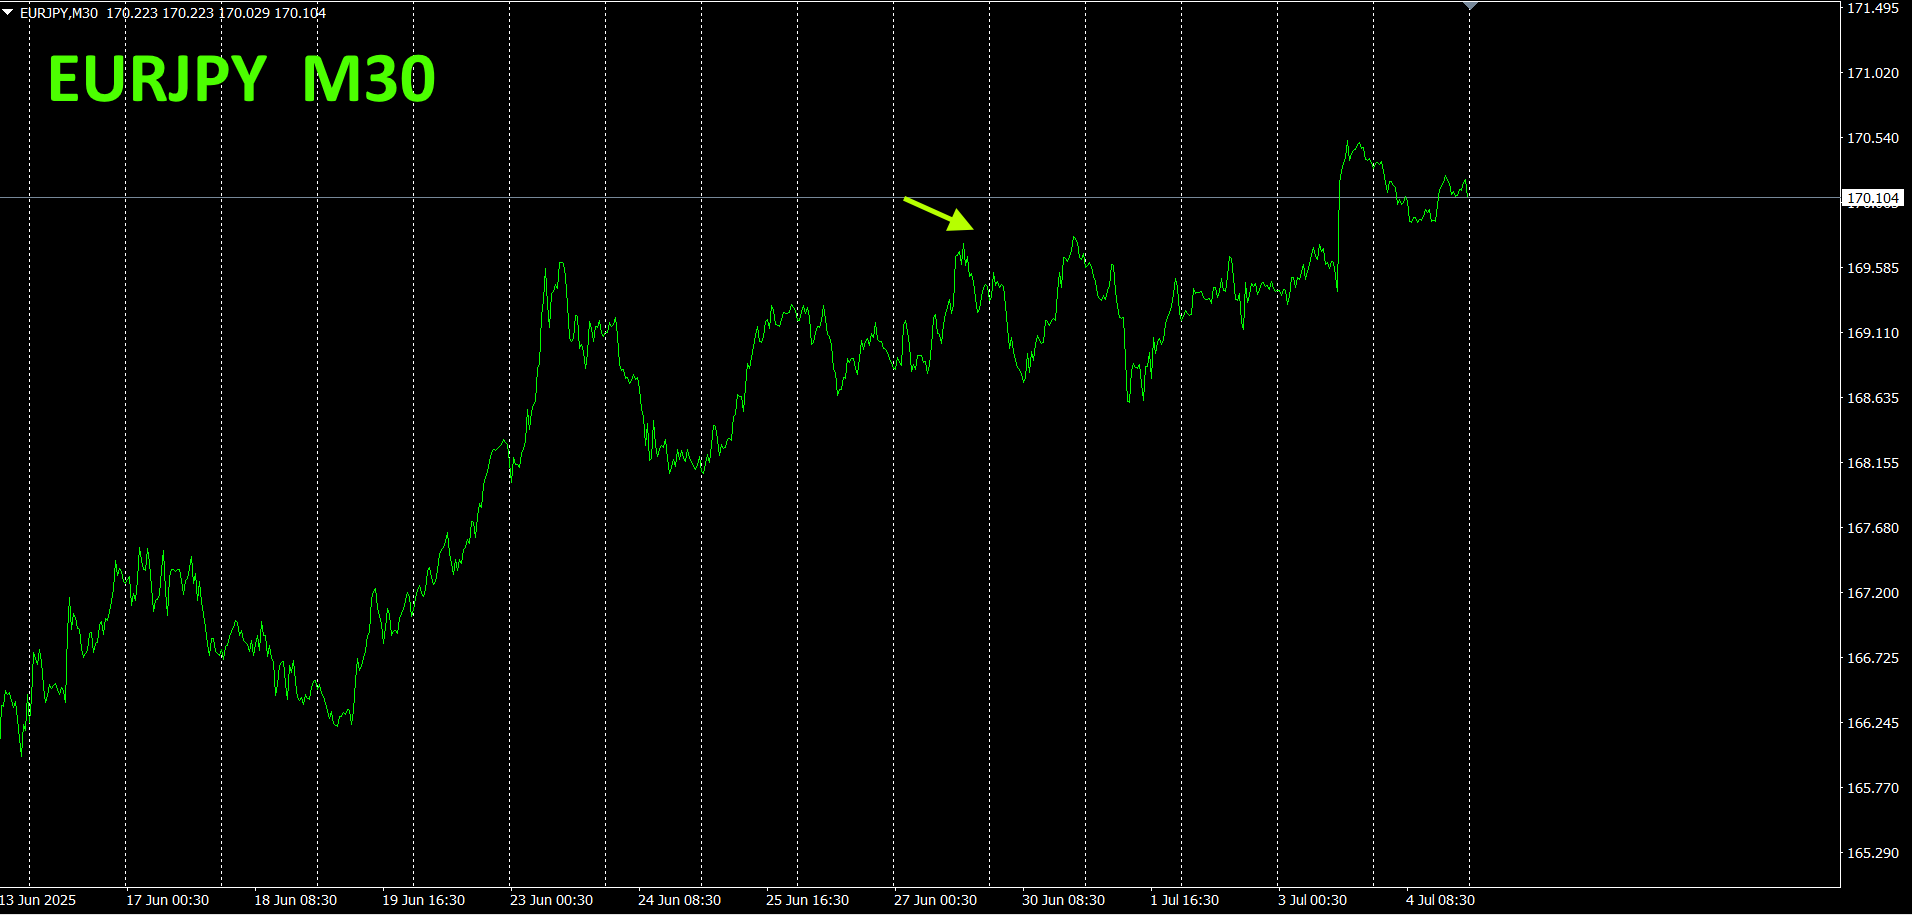
30 minutes currency strength chart.
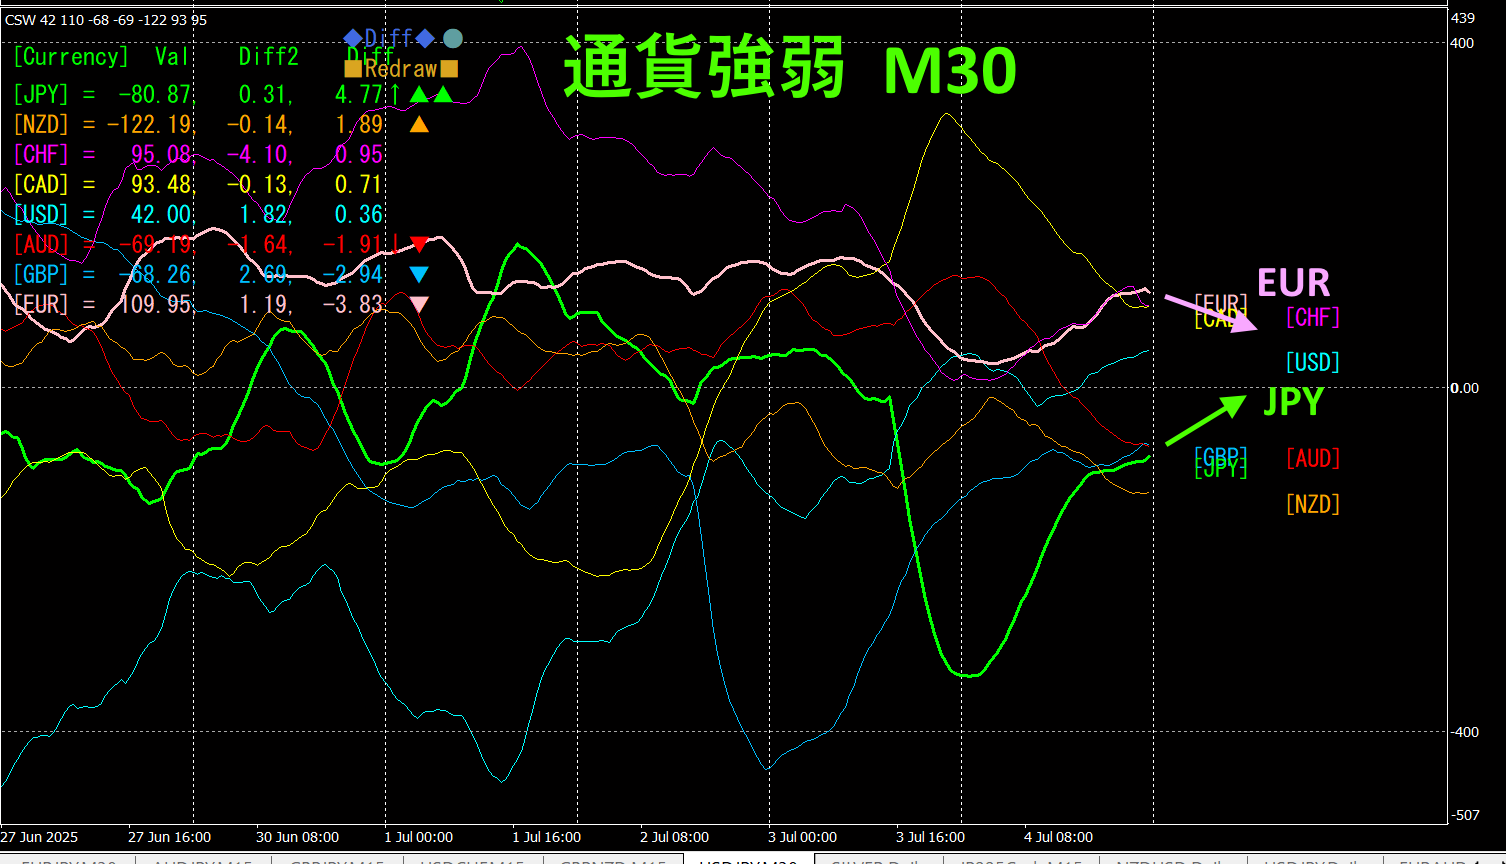
Pink is, green is. In the currency strength chart, is slightly downward, is upward, so
4.
New IndicatorDual_MACD_Trend_Indicator to tryout
New indicator “Dual_MACD_Trend_Indicator” is as follows.
MT4 version:https://www.gogojungle.co.jp/tools/indicators/62199
https://www.gogojungle.co.jp/tools/indicators/62202
This indicator clearly shows the direction of the trend with color. If the color bar is Lime, it is a buy; if Red, it is a sell. It is easy for beginners to use. If the bar is green, it indicates an uptrend; if red, a downtrend, and if no color, no trend. Because it uses color, you can grasp the trend state at a glance.
I installed this indicator on the CADJPY 1-hour chart.
If you install this indicator, buy zones and sell zones will be color-coded, so you won’t be unsure about selling vs buying.
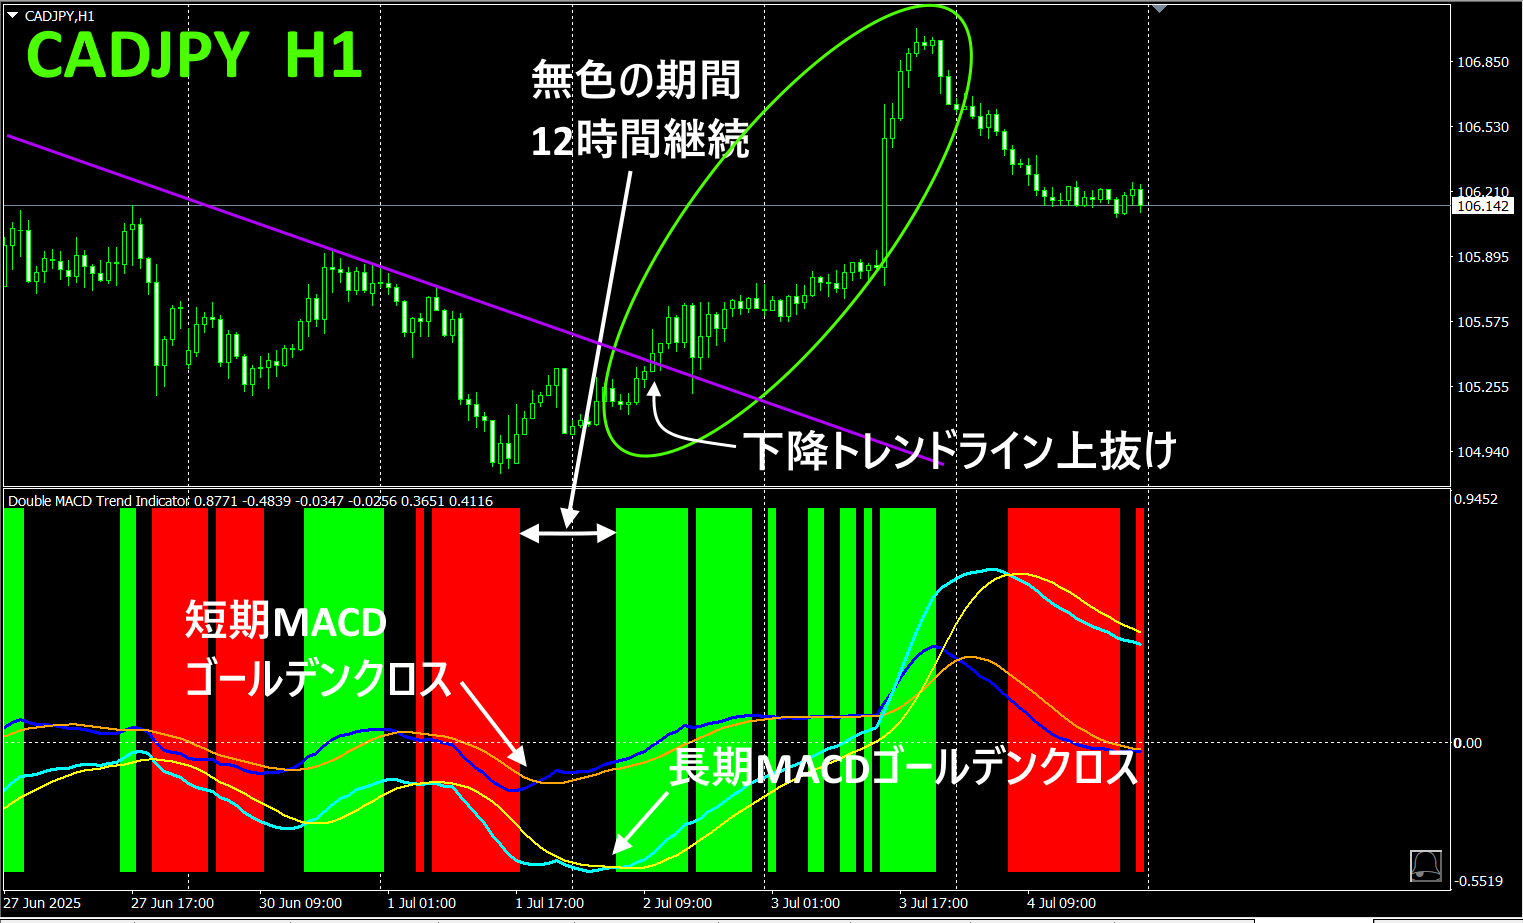
With the “, hours of colorless period are followed by a wide green zone. The short-term is negative and gold-crosses, then the long-term turns negative and gold-crosses. When the indicator color changes from colorless to green, that marks the start of an uptrend.
Candlesticks also break upward through a downtrend line. Short-term and long-term of profit effortlessly.
A weekly trading profit of this magnitude should be enough.“Only capture what can grow, and don’t trade elsewhere” is the principle of losing-free trading.
With the, you never have to doubt the trading direction again.
5.
The release of”
“” is now available. It is a high-performance indicator that visually displays the strength of the eight major currencies at a glance. It records the strongest currency and score over the past10 bars on the current timeframe, accurately capturing trend durability and turning points. In addition, it supports multi-timeframe analysis with scores for several timeframes (M15, H1, H4, D1, W1) showing the top currencies. With clearly visible color lines and a separate window display, it provides a powerful tool to gauge market flow.
For details, please see the following link.
https://www.gogojungle.co.jp/tools/indicators/65082
※ Recommended indicators
“Toritori Indicator”
https://www.gogojungle.co.jp/tools/indicators/50115
“”


https://www.gogojungle.co.jp/tools/indicators/42257
“ currency strength visualization indicator” please refer to the following page.

version https://www.gogojungle.co.jp/tools/indicators/39150
version https://www.gogojungle.co.jp/tools/indicators/39159
【My listed products】


