[Discretionary Trader Must Read] About the currently developing EA (planned to be free)
“I’m interested in the principles of market dynamics and technical analysis, but what impact would this knowledge have on my trading?” “They say technical analysis is useful only in hindsight...”
If you master the quirks of price movements on charts, you can grasp the flow of price action
Hearing about Elliott Wave Theory may seem a bit intimidating, but essentially it’s about the “quirks of price movements on charts.”“Can the quirks of chart price movements really be trusted?”
If you’re doubtful, please read the content of the newsletter delivered at 5:59 AM on that day and see how the chart moved that day.
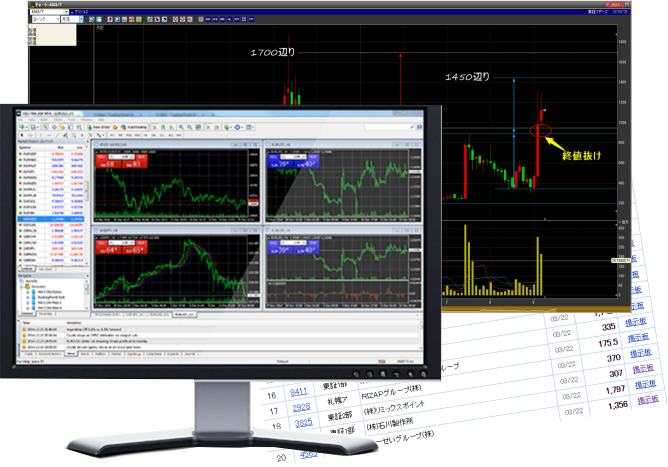
<Newsletter from 2018-11-21>
(Click to jump to the article from that time.)

<Actual USD/JPY chart from 2018-11-21>

(What kind of feedback this newsletter has received from users ishere)
Do you think this is guesswork?
Of course not (laughs).
This forecast isbased on the Elliott Wave Theory and Fibonacci Retracementas clear theoretical foundations..
In other words, if you know this theory,this forecast is possible for anyone.
(The USD/JPY price movement scenario I send around 06:00 every morning ishere)
If you can picture these price movements, you can anticipate profit-taking points after a long entry, high-probability bounce points after a pullback from a recent top, and points where you should take profits after a rebound, allowing you to trade with foresight.
Imagine traders who can picture this versus those who cannot—which group is more advantaged and likely to win? Please form your own impression.
Are you prepared to pay tuition and gain market experience through testing and validation?
Having confirmed the usefulness of knowing the quirks of price movements, it is perfectly reasonable to aim to learn this knowledge well and apply it to trading.Many traders entering the market hate risking money, time, and effort necessary to win in trading.
However, trading is not a cozy job where you can easily earn money without these risks and costs.
Trying to succeed in trading without incurring these costs is like saying you can succeed in business without product development, advertising, or payroll.
(Personally, I picture it like this ↓)
 (You can’t possibly succeed by betting on an old house, can you…?)
However, you can significantly reduce costs, even if you cannot eliminate them entirely.
That is, purchase know-how and validation obtained from others’ experience.
Certainly there is an upfront financial cost, but it may be one-tenth of, or even one-hundredth of, the money you would pay in the market, and more importantly, it dramatically reduces time and effort.
But there are disadvantages.
Information products with investment know-how are typically expensive, and often you don’t know in advance whether they are truly replicable.
There is also the issue of hype-driven sales pitches.
“Old people who have never touched a PC can make a fortune.”
“Anyone can earn a daily wage just by clicking twice.”
These are common templated sales lines, but do information products exist that truly guarantee profit without any effort after purchase?
(If you know of one, please tell the site manager quietly.)
If you’re seeking that, I’m sorry. Please quietly click the × at the top right to leave this site.
This site does not contain information you are seeking.
Tool-based optimization to acquire the same gauge as a discretionary trader
Earlier I mentioned that winning with discretionary trading requires various costs.While these costs cannot be eliminated, they can be greatly reduced.
When performing calculations where mistakes aren’t allowed, you don’t increase people; you use a calculator, right?
Calculators excel at calculations, but using a tool specialized in its domain can reduce not only monetary costs but also time and effort.
The same goes here.
The upcoming market principles EA outputs a target rate focused on Elliott Wave and chart pattern majoring patterns and is proficient at trading.First, to help you visualize usage, I’ll start by describing the UI.
A simple, intuitive UI that is easy to understand
Even a great tool is worthless if its usage is too complex or not intuitive.In short-term trading, a single moment of judgment can directly determine the trade result.
If you’re wondering which button to press at that moment, it’s game over.

Did you have trouble choosing which button to press to bring out the Elliott Wave?
The correct answer is actually “ELLIOT WAVE” (laugh).
Elliott Waveis simply a one-click action to indicate the starting point of a trend (there is a manual for how to set it).
Moreover, you can use past charts to extensively verify how accurate it is.
(If you wish to clear these, please press “ELLIOT WAVE.”)

Chart patternsrequire a bit more familiarity and study.
Of course, while there is a manual for how to output chart patterns in the EA, discretionary traders are required to be capable of identifying chart patterns.
If you encircle the high and low of the real bodies where a chart pattern is forming with a square, you’ll obtain the target rate.(If you wish to clear these, please press “CHART PATTERN.”)

This chart is selected by the site administrator as a successful example (laugh).
This is the same for not only this site but other sites and blogs as well.
We publish a chart when it matches the logic and trend.
Therefore, please use this easily verifiable EA to thoroughly test it yourselves.
Choose an entry method that is intuitive and supports various techniques with a simple UI
In the UI for the market principles EA, a major component is the entry method UI.

The area enclosed in red is the UI for this setup.
There are three basic entry methods.
1 Line touch
2 Line break
3 Counter-trend / contrarian
With these plus the categorization of horizontal lines and trend lines, you can intuitively trade using a total of six setups.
Discretionary traders create their trading plan, draw horizontal lines and trend lines with a UI aligned to that plan, and that’s all there is to it.
After that, the EA will wait for the moment when the discretionary trader’s trigger is reached without missing the opportunity.
Since it’s hard to explain just with text, please look at the illustrative images.
Line touch
Horizontal line
Trend line

Line break
Horizontal line
Trend line

Counter-trend / contrarian
Horizontal line
Trend line

An entry UI that flexibly supports various exit rules
This EA primarily trades based on exit rules configured in parameters, but it is also designed with a strong emphasis on manual exits.This is because discretionary traders themselves might find their best trading rules through study and validation.
In such cases, this manual exit UI shines.

The area circled in red is the manual exit UI; can you intuitively picture it?
“−” is the horizontal line, “/” is the trend line, and you can change the nature of these lines with the horizontal line or close price break options shown horizontally.
In this way, for example…
1 Exit at an important resistance or support
2 Exit when consolidation breaks the line touch or close price break in the opposite direction of the position
3 Trailing stop using line touch
4 Exit at trend line break or upper/lower channel line touch
(In an uptrend)
etc., enabling highly flexible exit execution.
Together with the entry UI, line trading can also be performed.
UI and indicators, and other

“ERASE” clears all horizontal lines and trend lines drawn with this UI up to now.
“Indicator” displays trend and timing signals from higher time frames.
The content of each display is as follows.
“Stochas”
= Stochastic on the 4-hour chart (5.3.3) buy signal is red, sell signal is blue
“MultiFrame”
= If the rate at trading time breaks above the high of the higher time frame’s 21SMA at close, red; if below, blue
“PerfectOrder”
An EA that assists discretionary traders’ entry and exit measurements
This is getting technical, so please follow along.As a helper for discretionary traders’ entry and exit measurements, I’ll first explain the technical aspects of entry.
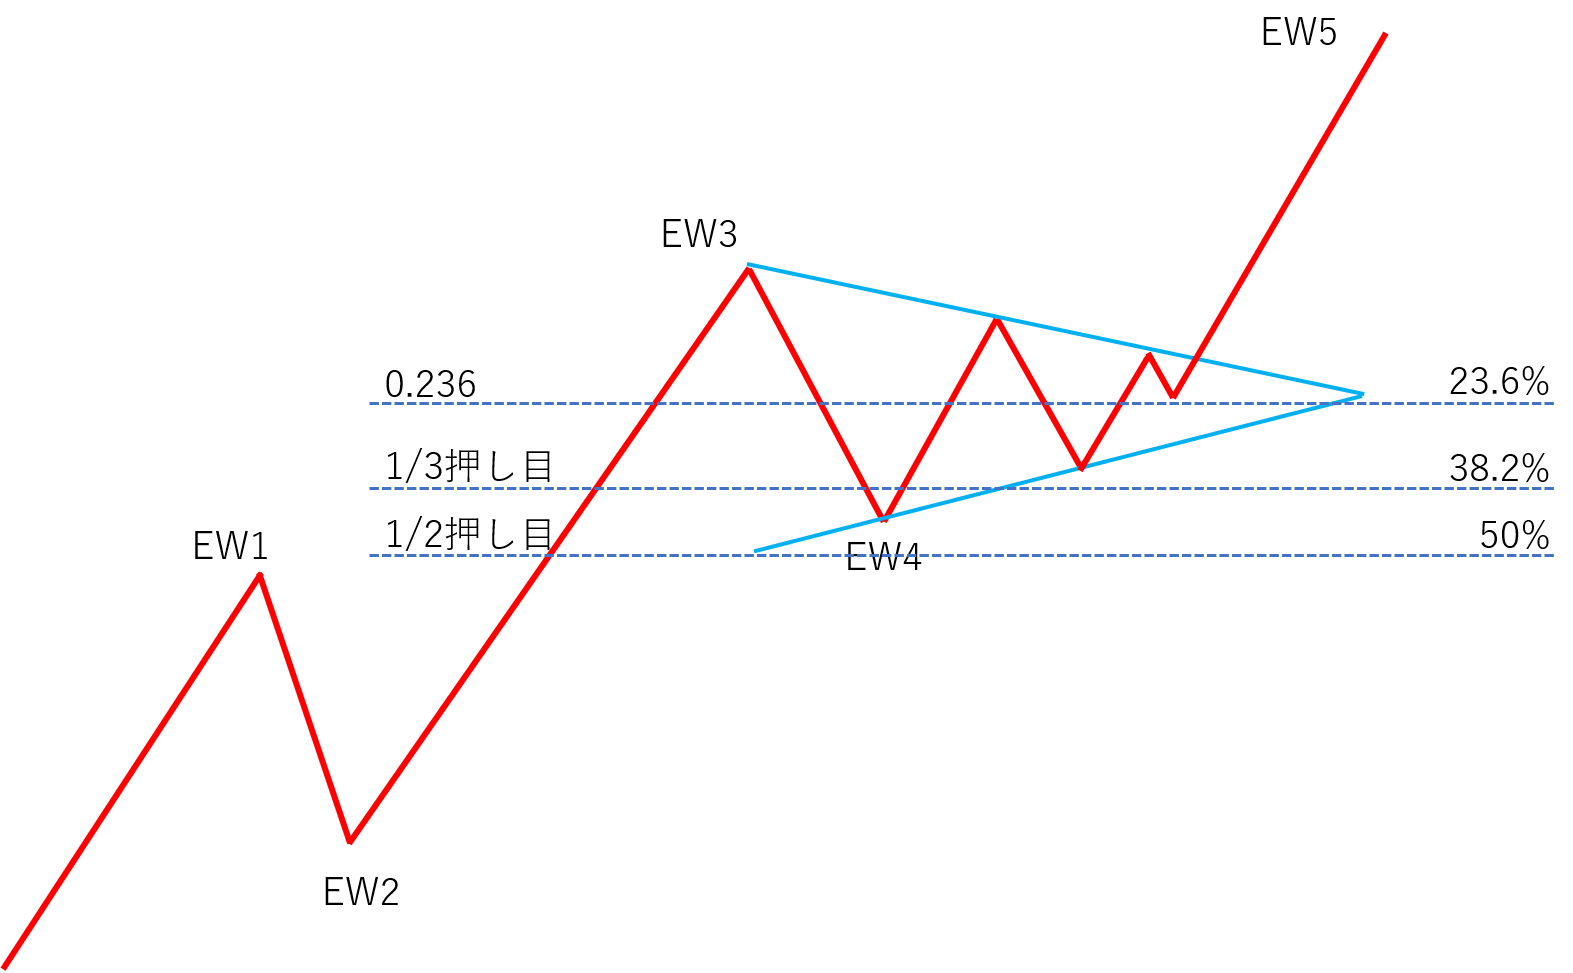
For Elliott Wave,hereis a detailed article, so please refer to it.
Elliott Wave and Fibonacci Retracement have good compatibility.
As a premise, Elliott Wave and Fibonacci Retracement are highly compatible and closely related.Elliott Wave is essentially the cycle of price movement. I personally like describing it as the quirks of price action.
When thinking about human behavior, quirks are hard to ignore.
There are many times when predicting the next action of a person, such as their habitual phrases.
It’s not guaranteed that they will act that way, though they often do.
However, knowing it or not changes the accuracy of predicting the next action.
I relate this to the knowledge and techniques of Elliott Wave and chart patterns in technical analysis.
Back to the main topic…
The first wave of Elliott Wave is difficult to forecast because it occurs abruptly.
The first wave is the initial momentum of a trend, but that momentum will eventually pause, with pullbacks and retracements occurring.
The level where these pullbacks or retracements occur is governed by Fibonacci Retracement.

With the Market Principles EA, if you select Elliott Wave and click the starting point of the trend, Fibonacci Retracement is automatically displayed on the chart, and it provides the discretionary trader with a strong entry-point information.
Elliott Wave and Chart Pattern trading rules
As the name Market Principles EA suggests, it is equipped with internal logic that reflects market principles.That internal logic is precisely the trading rules of Elliott Wave and chart patterns.
Elliott WaveTo target Elliott Wave, the user clicks the candlestick considered the trend’s starting point.
If you determine an uptrend, click a bullish candlestick; if a downtrend, click a bearish candlestick.
The user-designated starting point becomes the stop-loss point.
Based on that starting point, the EA uses its own logic to compute the targets for the 3rd and 5th waves and automatically sets take-profit there.
<Elliott Wave calculation example>

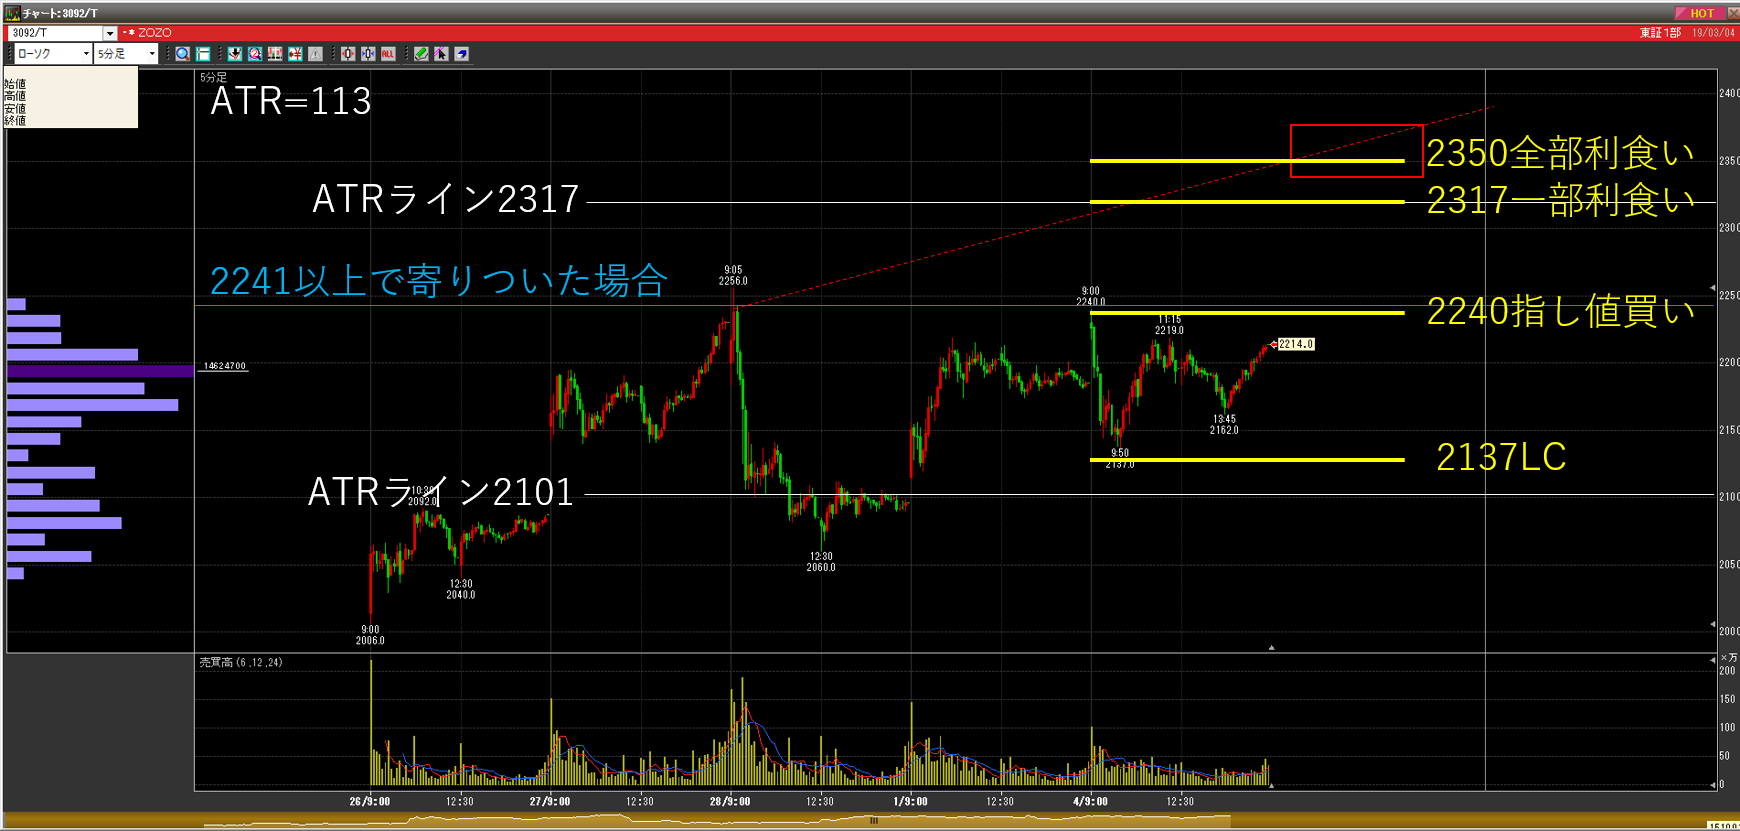
For chart patterns, especiallyFlag,Pennant, small-range consolidation,Symmetrical triangle, chart patterns shine.
The basic trading rule is to treat the highs and lows of candlestick bodies within the range as the range; when the real-body closes beyond this range, a stop-loss is triggered, and take-profit is automatically set at the target rate calculated by our algorithm for range breakout.
<Chart Pattern calculation example>

Because Elliott Wave and chart patterns both display target rates on the chart, you can use them as exit-point gauges or as indicators of trend momentum.
I cannot guarantee the accuracy here by just pasting convenient charts, so please use past charts to thoroughly validate and confirm.
Simplify trading with parameter settings
In the previous version, exit-rule settings were done via the UI, which could be confusing for users.
In this version, we learned from that and predefine finer exit rules via parameter settings.

Initial settings
1 Línea initial: The default lot size for trading.2 Initial TP (Pips): The TP value automatically set if you enter without specifying an exit method.
3 Initial SL (Pips): The SL value automatically set if you enter without specifying an exit method.
4 Line break minimum value (Pips): The minimum breakout pips required to consider a line break on close. If the close break does not meet this, entry is skipped.
5 Line break maximum value (Pips): The maximum breakout pips allowed for entry on close. If exceeded, entry is skipped.
6 Return entry after line break
If the close break exceeds the maximum line break pips and entry was skipped, decide whether to re-enter when the rate returns within the maximum line-break tolerance.
Elliott settings
7 Magic number1 Third-wave target levelMagic number. If you operate multiple timeframes or currency pairs, overlapping magic numbers can cause misoperation, so ensure they do not clash.2 Third-wave confirmation rate
3 Fifth-wave confirmation rate
4 Break-even activation
5 Break-even level
6 SL movement
7 Trailing stop activation
8 Trailing stop reach (Pips)
9 Trailing stop profit (Pips)
10 Partial close
Chart pattern settings
1 Break-even activationWhen the distance from the entry to the target rate reaches 0.5, move SL to break-even.
2 Partial close activation
When the distance from the entry to the target rate reaches 0.5, perform partial close.
3 Lot to take-profit (%)
Percentage of the lot to partial close.
Indicator settings
1 Stochastic%K period of the 4-hour Stochastics
2 Stochastic D
%D period of the 4-hour Stochastics
3 Stochastic Slow
%SD period of the 4-hour Stochastics
4 Multi-frame Moving Average
SMA period used for determining the trend on higher time frames
5 Long-term Moving Average
Long-term SMA period on the trading time frame
6 Mid-term Moving Average
Mid-term SMA period on the trading time frame
7 Short-term Moving Average
Short-term SMA period on the trading time frame
By the way, we plan to distribute this EA for free, but before that we intend to conduct a monitor. If you’re interested, please contact this site (https://kinchanbbh.com).