
【暇な専業トレーダーのトレード解説】A method for earning monthly income from the market
One Day of the N-Method
This is the GBP/JPY pair.
I bet lower in the expansion, the third time lucky.
Let's look at the daily chart.

I took profits at midnight with a 70 PIPS gain.
Only 70 PIPS... With so little volatility I wonder if it will truly go down, but I won't make any predictions (laugh).
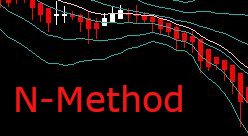
This is the 4-hour chart.

It’s a sell on the pullback from the middle band.
This time I entered with discretionary entries of the N-Method. The key is the moving averages.
Next is the 30-minute chart.

The moving averages have tilted, and considering the higher timeframes, there is a long upper wick, so there are many ways to enter based on the candlestick pattern.
People who are afraid of a pullback in these places tend to miss out while seeking safety and certainty, and end up losing.
Next, the weekly chart.

There is a gap between the two sigma lines. Will it try to fill this gap?
Monthly chart

There is also a gap between the two sigma lines; it might go back to test the lows again.
Now, let's do our best.
[Attack is the best defense] N-Method is here↓↓
https://www.gogojungle.co.jp/tools/ebooks/22300