

[Amidashi式: dominio? Actually "Amidashi式:ボリュームプロファイルで市場を制す" translates to "Amidashi Method: Mastering the Market with Volume Profile] Lesson 8: AB = CD Pattern Strategy — Reading Market Psychology in Wave Rhythm
Last time, we introduced the open-drive strategy, a method to find entry points in a market that moves powerfully in one direction.
This time, focusing on the price rhythms and psychological moves that the market naturally repeats,
we will explain in detail the "AB = CD Pattern Strategy".
1. What is AB = CD?
The AB = CD pattern is slightly different from other strategies in that it focuses on the psychology of market participants more than institutional moves or volume.
This pattern is based on the premise that prices move “like waves,” and its wave highs and lows (swing points) are labeled A, B, C, and D.
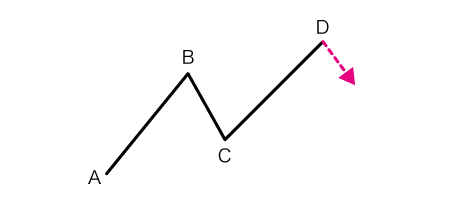
2. Pattern construction rules
For AB = CD to be valid, the following conditions must be met:
AB: the distance of the initial swing (up or down)
C: must retrace at least 50% of AB, but not exceed A
CD: point D is located at the same distance from C as AB (this is why it’s called “AB = CD”)
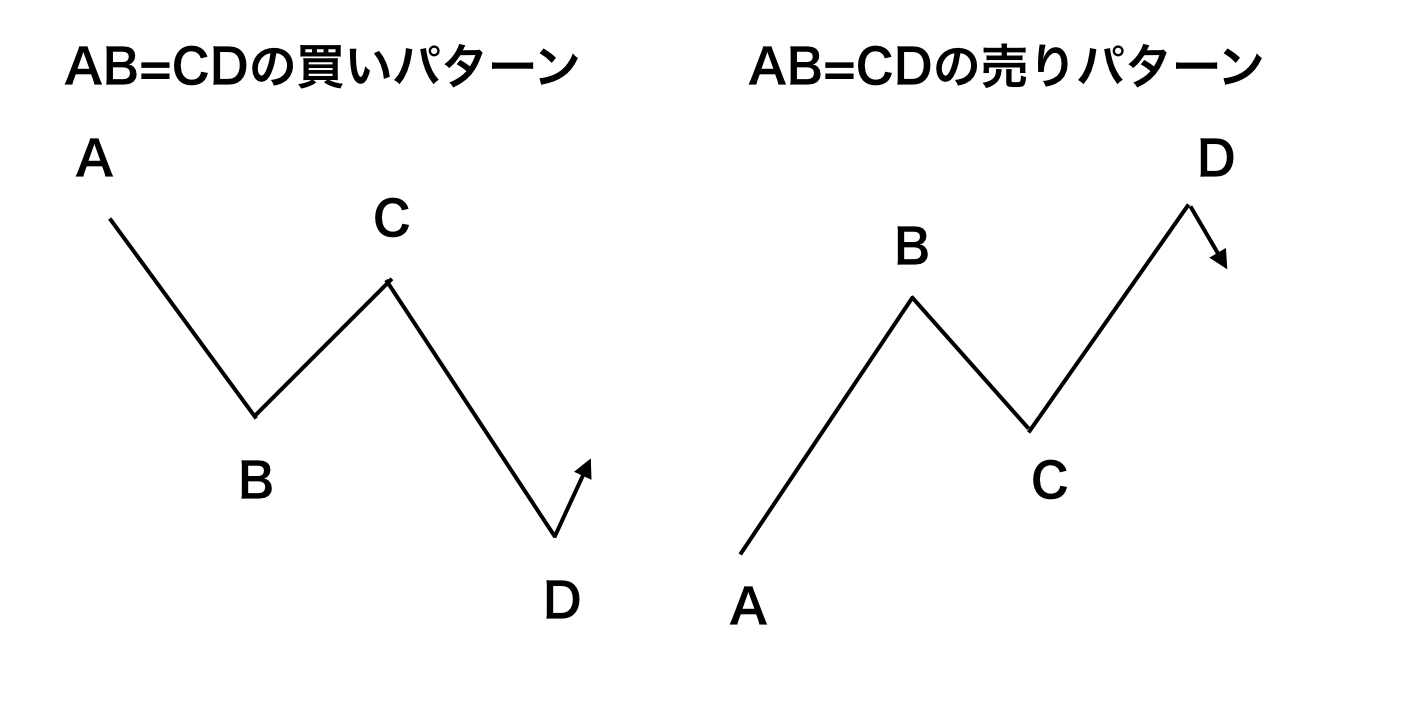
Entry at point D:
In an uptrend pattern (both AB and CD rising) → long at D
In a downtrend pattern (both AB and CD falling) → short at D
3. Measurement method using Fibonacci tools
To measure AB and CD at equal distances accurately, Fibonacci retracement tools are handy.
Steps:
Step ①: Draw Fibonacci with A at 0% and B at 100%
Step ②: Check if C is at 50% or more
Step ③: Move Fibonacci to C (without changing the distance), and D will be at 100%
→ This D becomes the entry point
4. Recommended timeframes
The AB = CD pattern works across many timeframes, but it is particularly useful on the following timeframes:
30-minute
1-hour
4-hour
Daily
Weekly
Note: Shorter timeframes below 15 minutes have more noise and lower accuracy, so they are not recommended.
5. Real trading examples
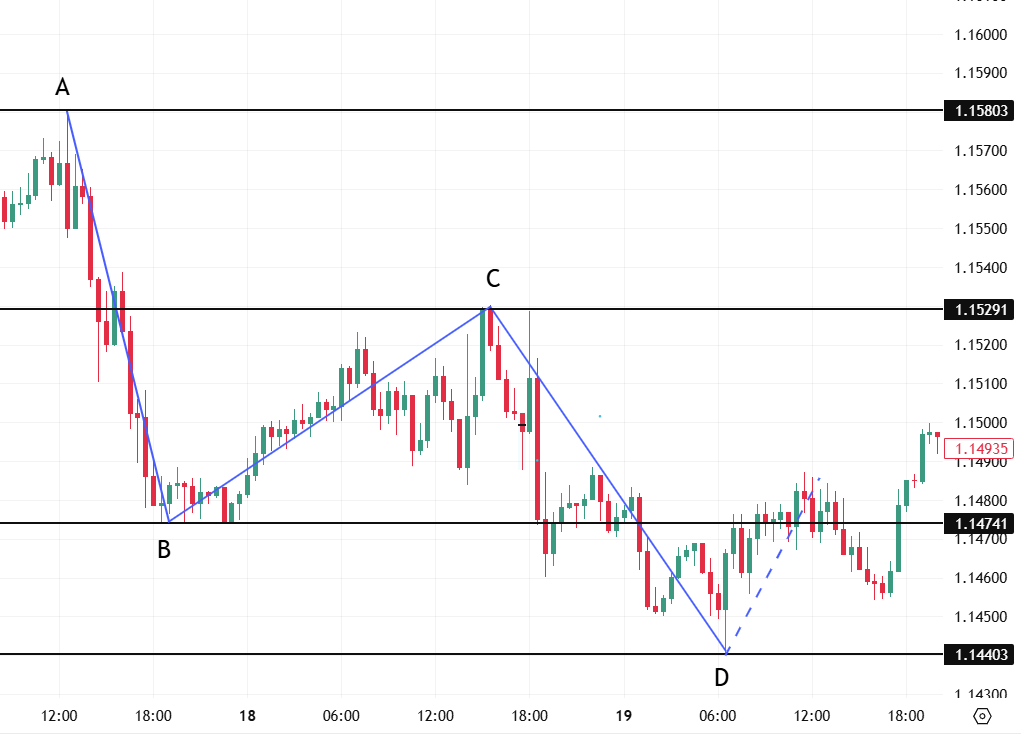
Uptrend AB = CD (EUR/USD, 30-minute)
→ long entry at point DDowntrend AB = CD (EUR/USD, 4-hour)
→ short entry at point D
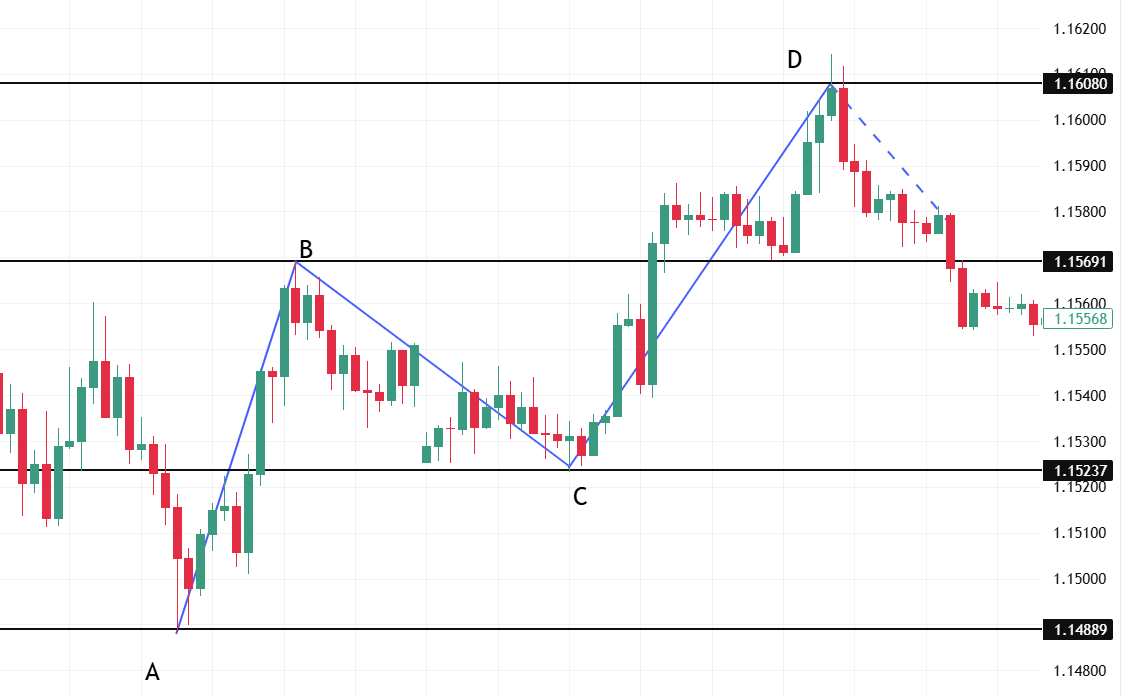
When you spot this pattern on a chart, use the Fibonacci tool to measure distances and observe the reaction at D to enable higher-precision trading.
6. How to use this strategy and its role
The AB = CD pattern is a solid standalone strategy, but I mainly use it as a confirmation tool for other volume-profile and price-action strategies.
When a trade level is identified by your main strategy, if this pattern overlaps with that level, it greatly increases the reliability.
In the next lesson, we will continue with the Session Open strategy.
Although it seems simple—the moment of market open—
it contains valuable clues for reading the market direction and participants’ psychology from the immediate price action that follows.
Please look forward to it!