

[Amida-style: Dominate the Market with Volume Profile] Lesson 6: Reversal Strategies for Resistance and Support
In previous lessons, we have explained in detail the three representative price action patterns that institutional investors leave on the charts (range markets, breakouts, strong reversal zones).
These are essential clues for tracing the “footprints” of professional funds.
In this lesson, as one practical trading strategy,
we will introduce a very simple yet effective method of
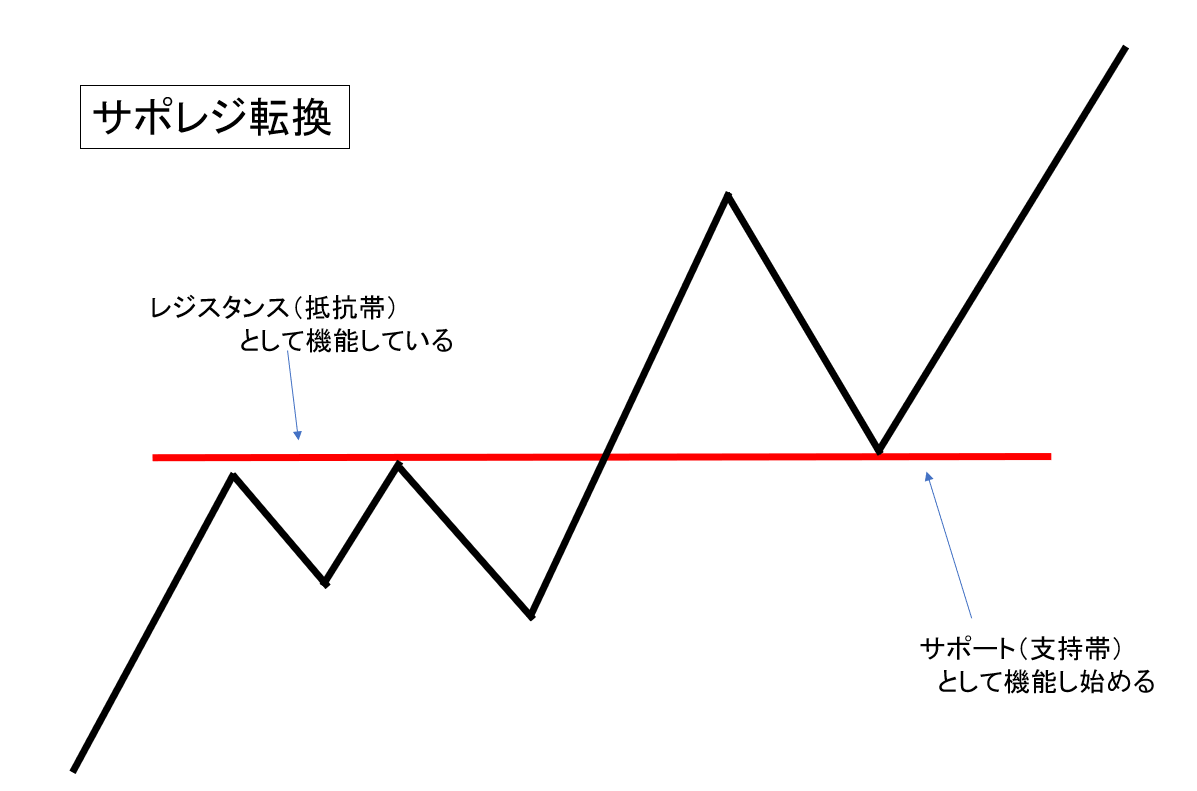
“when resistance turns into support and support turns into resistance.”
This approach is extremely straightforward and powerful.
1. Movement of institutions appears on all timeframes
Algorithmic trading, day trading, swing trading, long-term investing, and hedging—all activities of institutional investors are diverse, and footprints are present on every timeframe from one-minute to monthly bars.
However, what is common across all strategies is that they handle very large sums of money.
Because of that, on any timeframe, their trades leave clear traces on the charts.
This is precisely the opportunity for us, individual traders.
The method itself can be applied to any timeframe, and by adjusting stop loss, take profit, and position size, you can achieve highly reproducible trades with the same logic.
2. The basic structure of resistance–support transformation
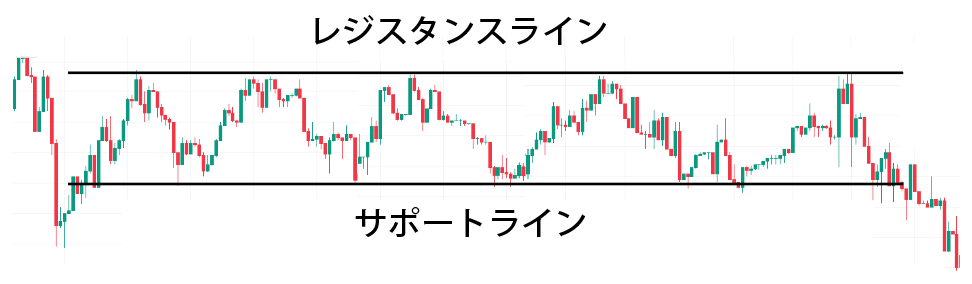
This strategy is based on the psychology and changes in supply and demand of market participants.
When a strong support line is broken down, traders who previously bought at that level bear losses, so when price returns they turn into sellers, turning into resistance.
Conversely, when resistance is broken upward, participants who want to buy as price rises appear, and when price returns it functions as support.
This phenomenon occurs across currency pairs and is independent of the timeframe, repeating at a very high frequency.
3. Entry flow and decision criteria
To use this strategy correctly, follow these steps:
Find zones where price has shown strong rebounds
→ Even one clear rebound is enough, but two or more increases reliability.
Wait for the level to break
→ If it is support, confirm a breakout below; if it is resistance, confirm an breakout above.
Wait for price to return to the broken price range
→ This is the so-called “retest.” In many cases, reaction occurs again.
Confirm the reaction at the turned level and enter in the opposite direction
→ Sell if it turned from support to resistance, buy if it turned from resistance to support.
4. Case study (EUR/USD 30-minute chart)
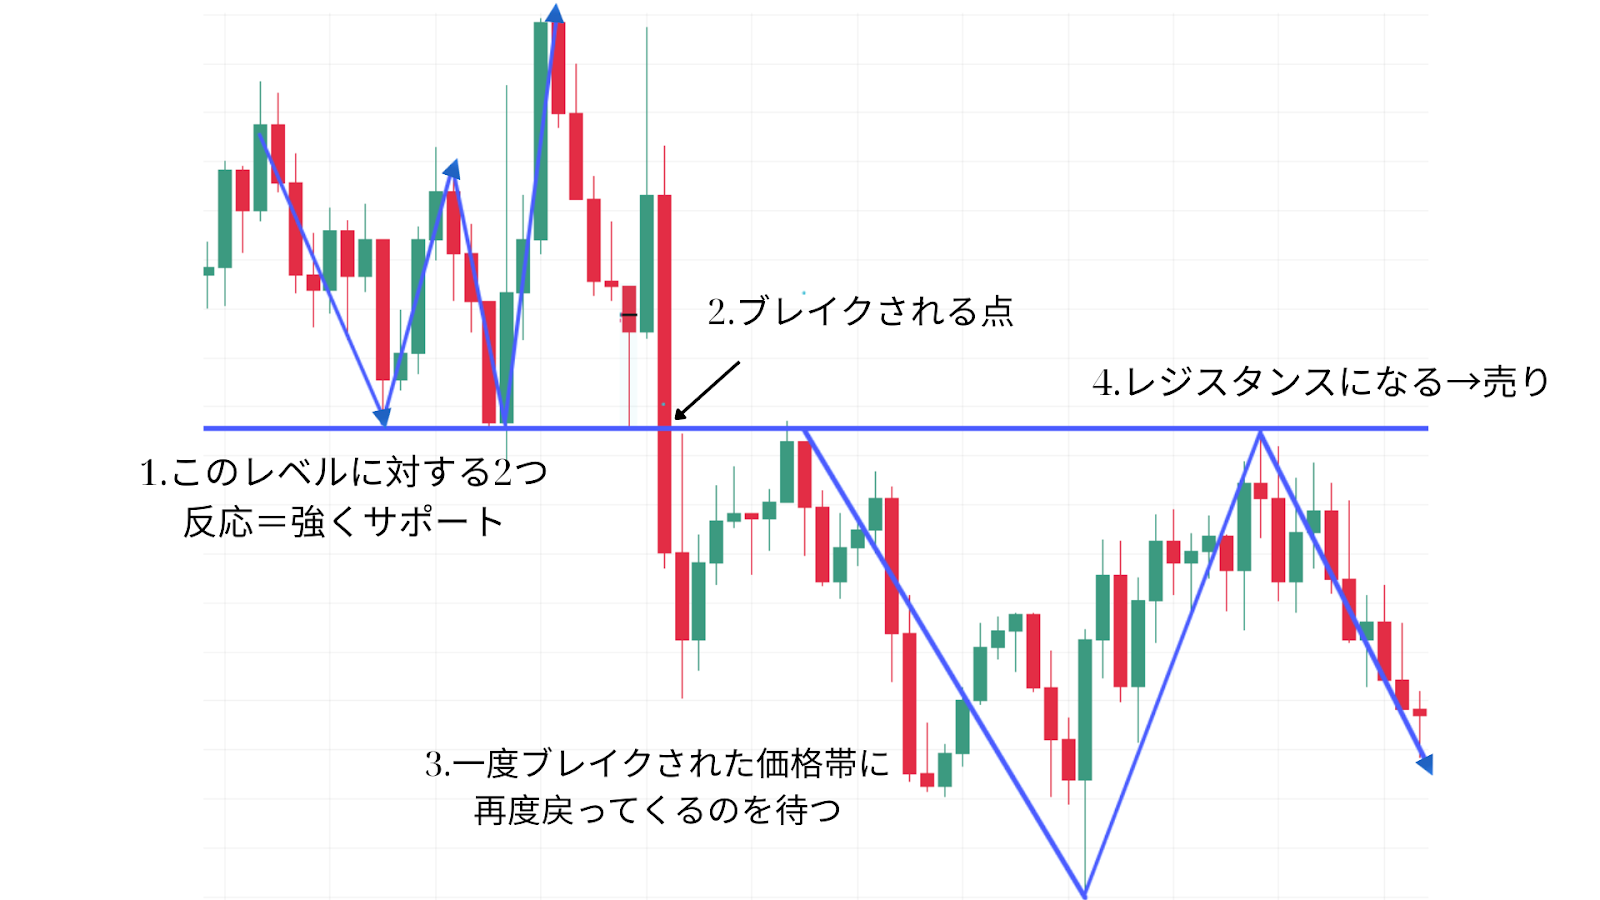
Case 1: Support turns into resistance
Price breaks below a level that had rebounded strongly twice. Later, when price returns to the same level, it rebounds again and falls. This is a classic short entry point.
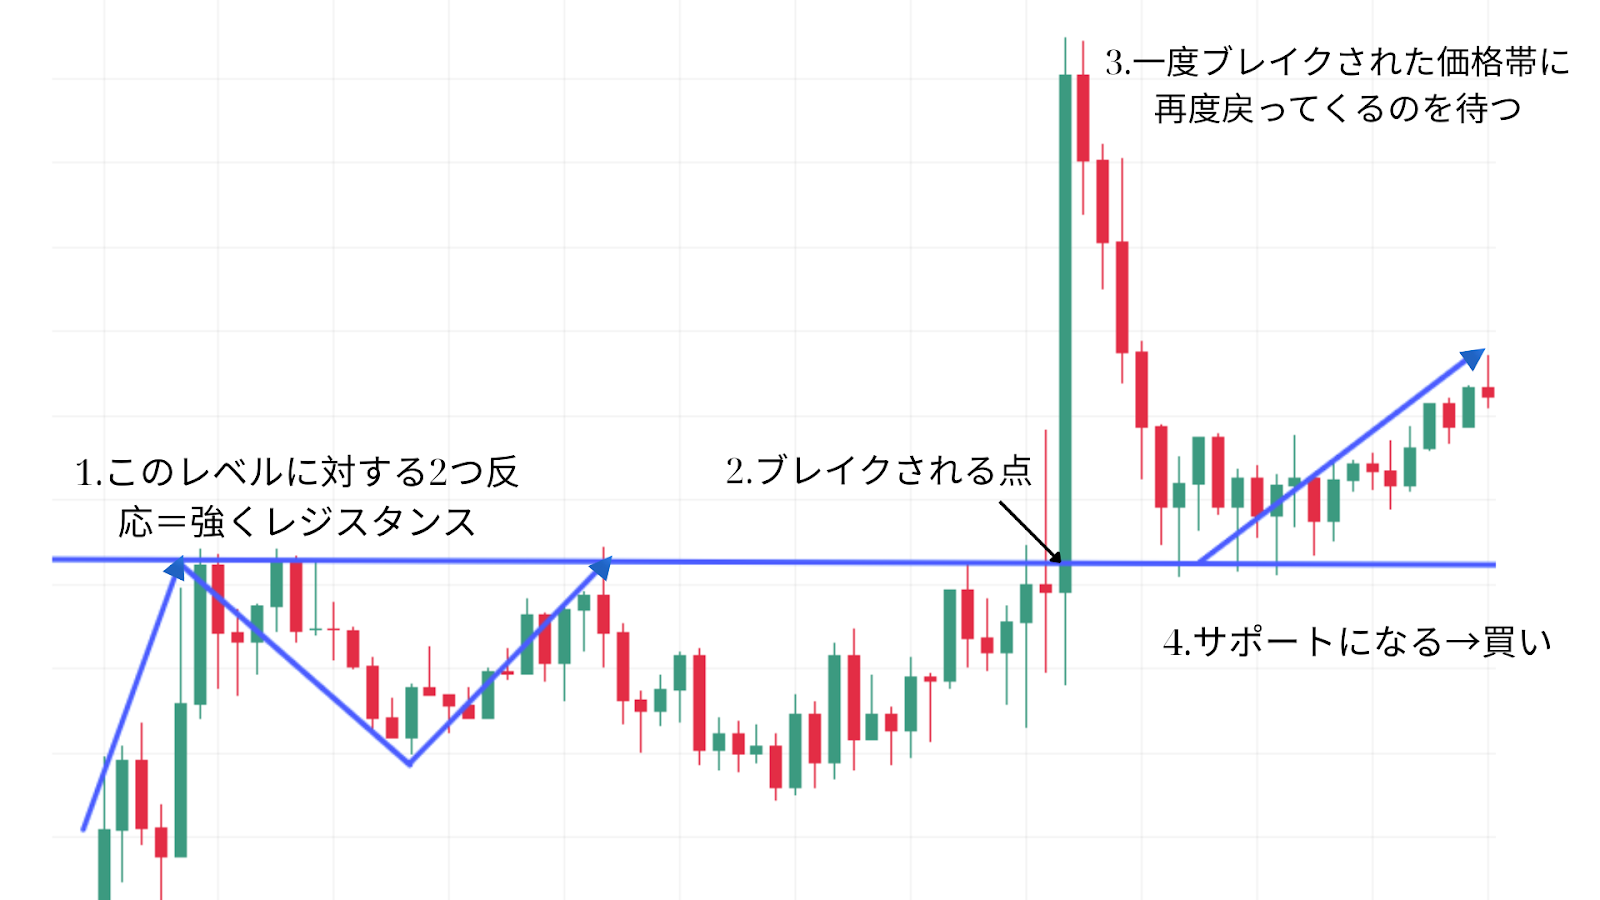
Case 2: Resistance turns into support
Price breaks above the previous level, and when it returns, it rebounds upward. This zone then functions as new support.
Summary
“Support and resistance transformation” is one of the most reproducible and visually intuitive price action strategies. By turning the institutional investor’s logic to your advantage, this strategy provides individual traders with high-precision entry timing.
✅ In the next lesson, we will introduce the Open Drive strategy.
Please look forward to it.