

Utilization of the "Visual Indicator" (Part 205)
"Visualization Indicators" usage (part205)
1. Evolve the "28 Currency Pair List Indicator" and develop it into an indicator
"8CP Visualization Indicator"to draw USDNZDUSD.
The "8CP Visualization Indicator" includesOceania version,London version,NewYork version,AnyCP version. This time, I used theOceania version.
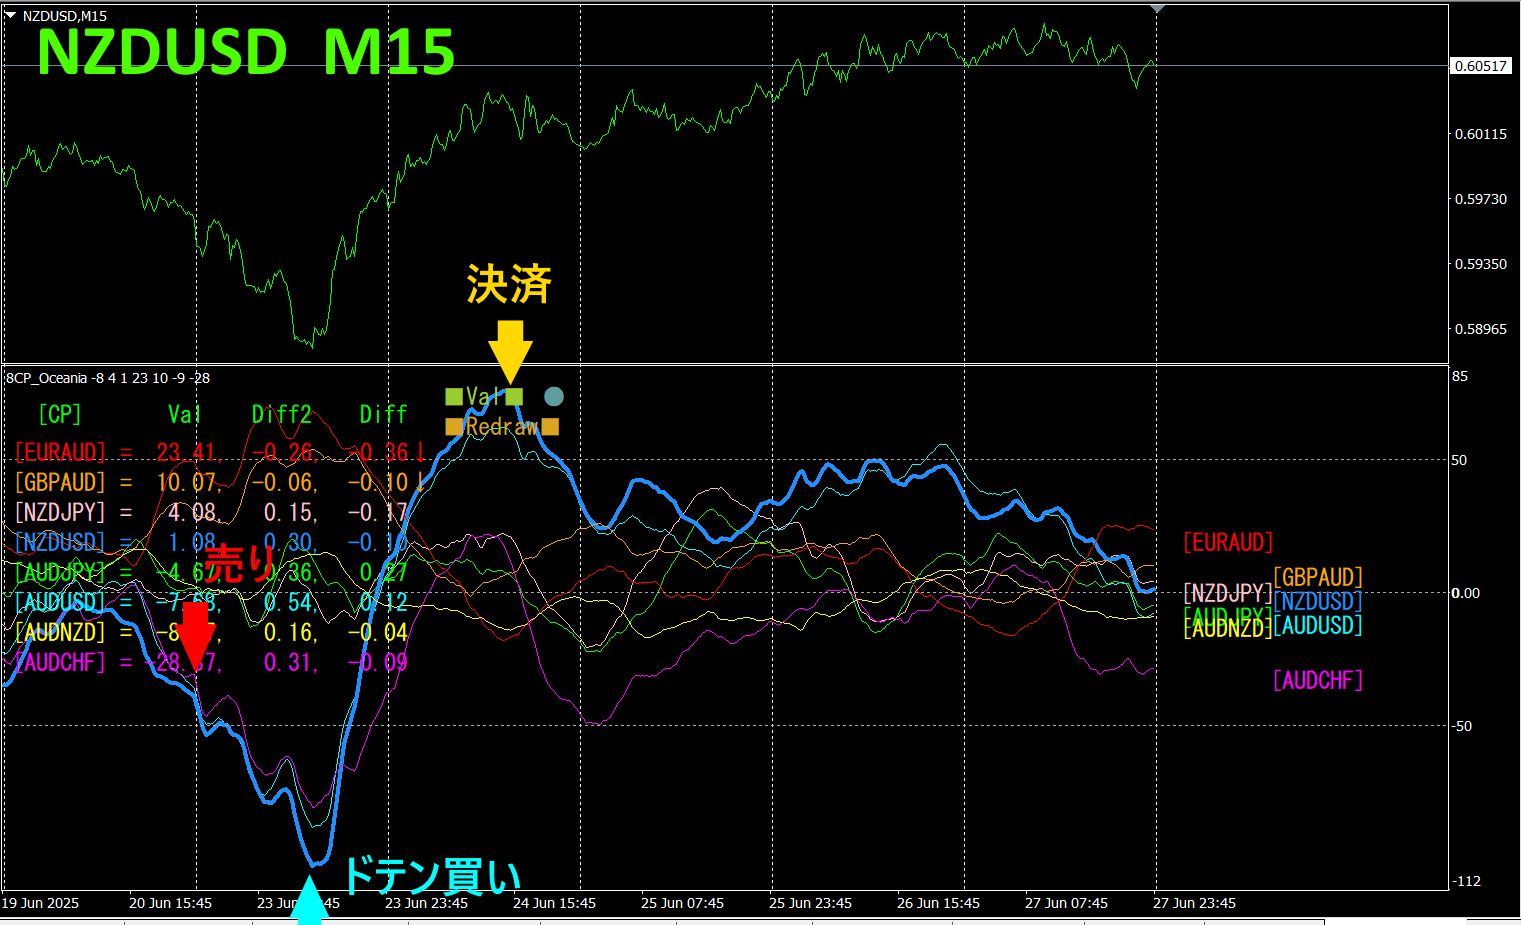
The top half is a 15-minute chart of theNZDUSD, and the bottom half is from the “8CP Visualization Indicator”; the light blue thick line chart corresponds toNZDUSD.
On Monday morning, theNZDUSD chart dropped below the other charts, so I sold. It hit a bottom in the negative zone, reversed, and I closed with a long, taking profits at the peak in the positive zone.50 pips + 150 pips for a total of about200 pips in profit.
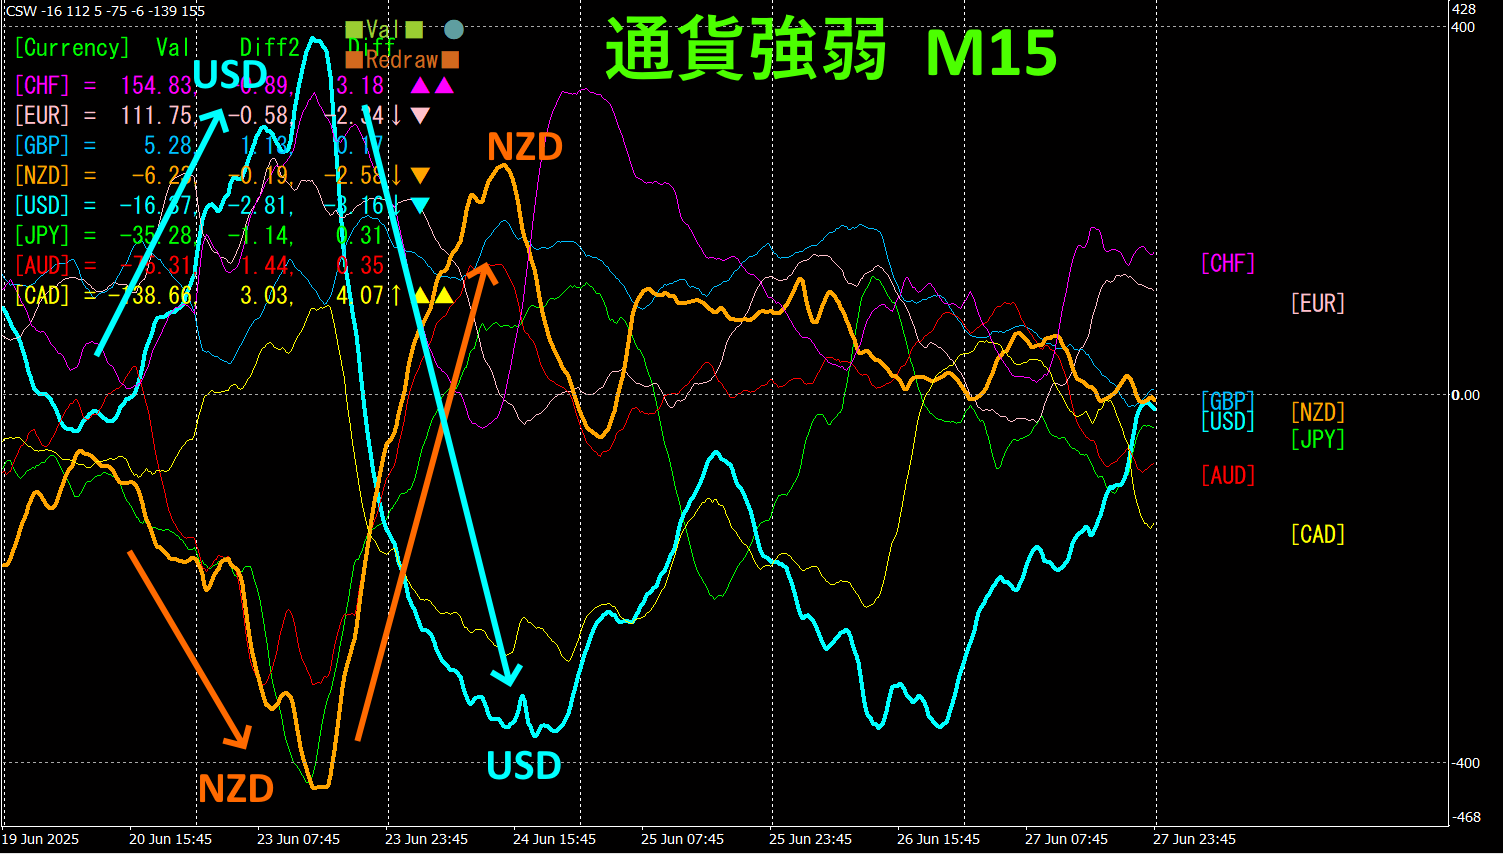
Looking at the 15-minute currency strength graph,NZD and USD have a remarkable inverse correlation. They form large waves, so trading according to this will naturally bring profit.
"Aim for currency strength inverse correlation!"FX is the iron rule.
If you useTrendLine-EX, you can automate entries and exits when a trend line is broken diagonally. You can leave it as is for easy trading. “TrendLine-EX is a semi-automatic EA that auto-sells when the price breaks below a trend line and auto-closes when it breaks above.
2. Best SelectTry the Indicator
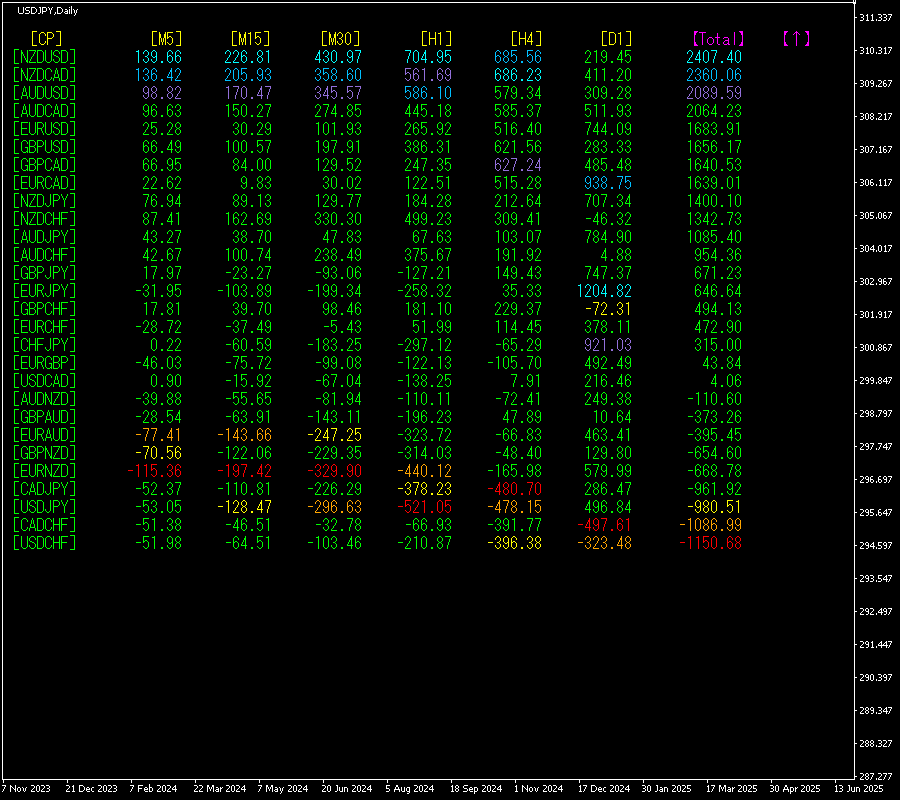
The diagram below is a screenshot taken on2025 year6 month24 day 15:20 JST).
Total]The numbers are arranged in descending order. At the very top,NZDUSD shows blue across all timeframes except for [D1].Total value is +2407.40, a large positive figure. Across all timeframes, it is clear that an uptrend is occurring inNZDUSD.
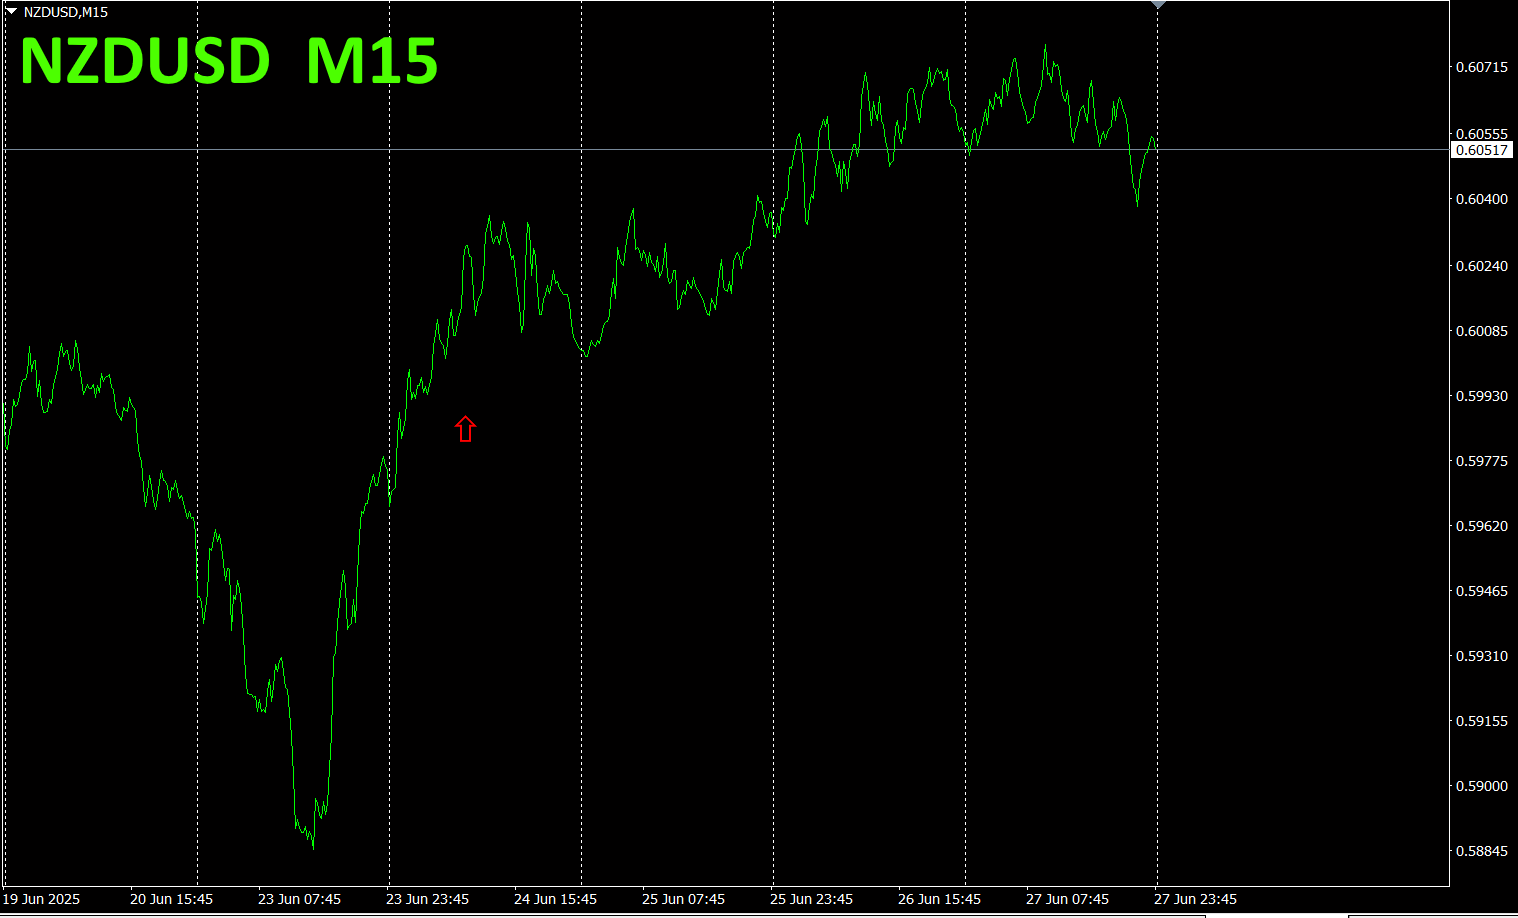
Now, let's look at the NZDUSD chart.
The red arrow marks the point where the screenshot was taken. It captures a sharp jump during the middle of an uptrend.
" 28 currency pairs Best Select
"28 currency pairs Best Select indicator

https://www.gogojungle.co.jp/tools/indicators/35128
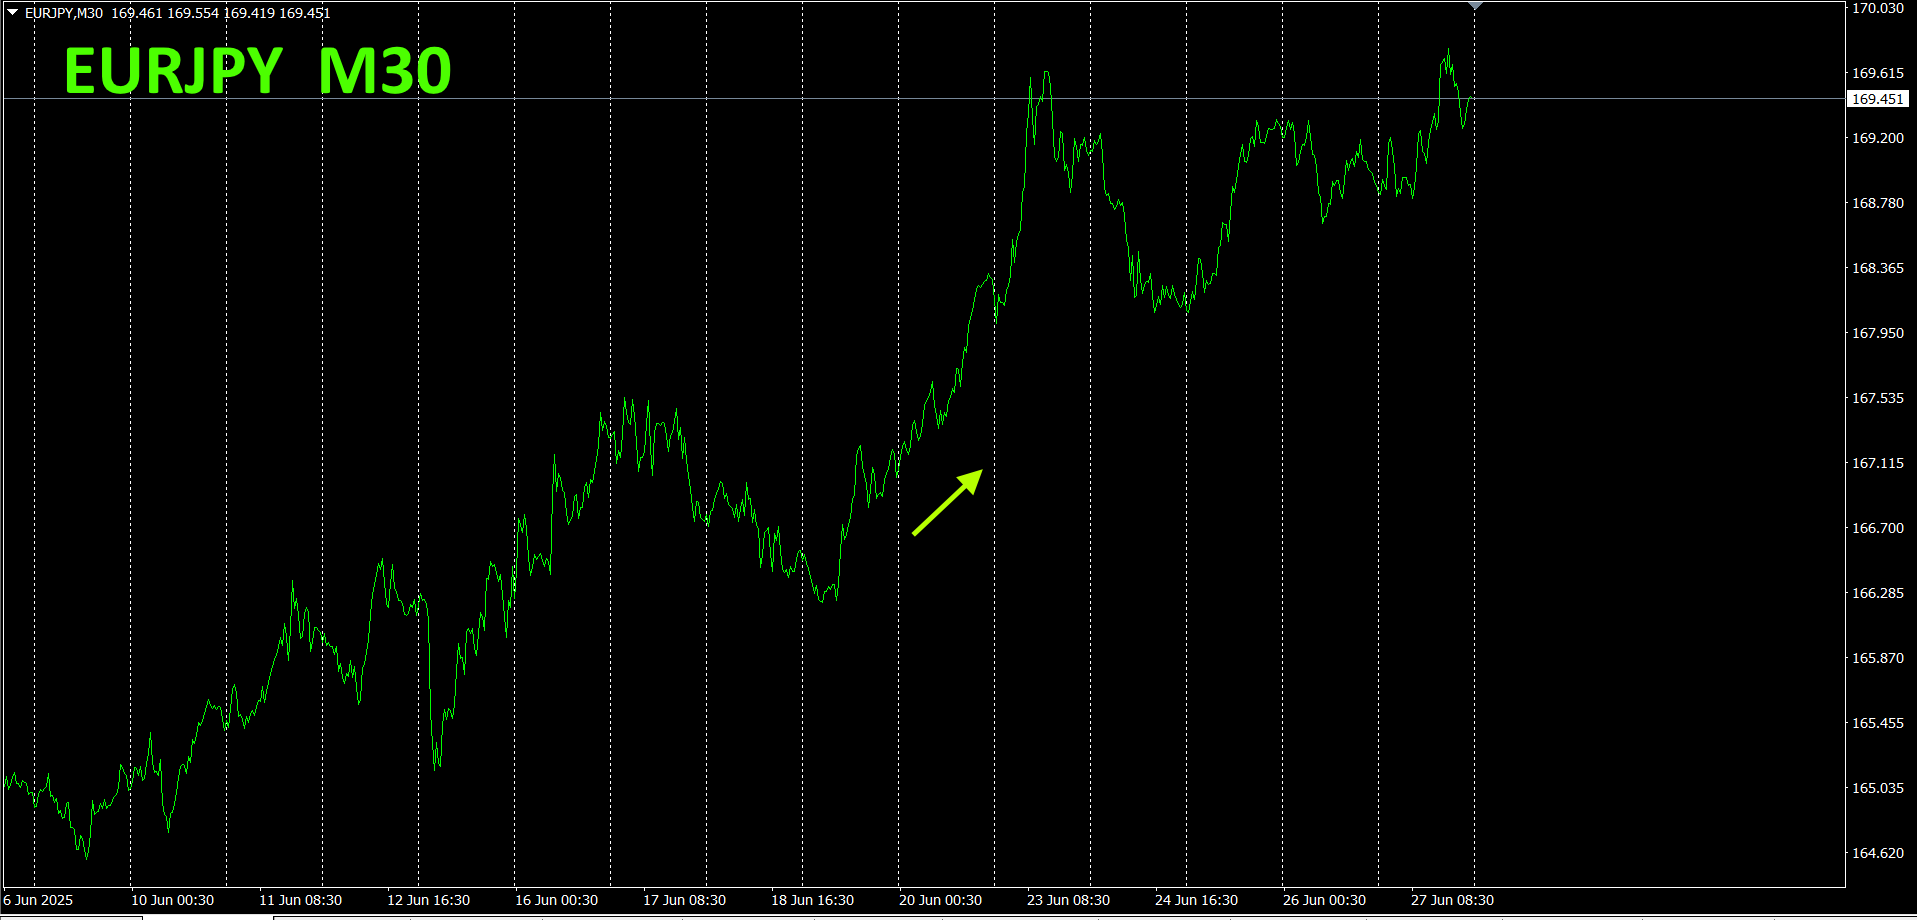
3. 2021 year5 monthSince then, how has EURJPY moved?
2021 year5 monthWe have been tracking EURJPY
To view the overall trend, a30-minute chart shows roughly the last3 weeks.
Last time, I wrote the following.
Pink isEUR, green isJPYEUR shows a solid uptrend,JPY. They form a clean inverse relationship, and in the currency strength chart, trends downward.EURJPY is expected to rise for a while. However, as the spread between EUR JPY widens significantly, a reversal and convergence is anticipated soon. If that happens, you should sell.
The chart has been rising on the right. It seems the top may be capped. While making new highs, the magnitude of the gains is shrinking.
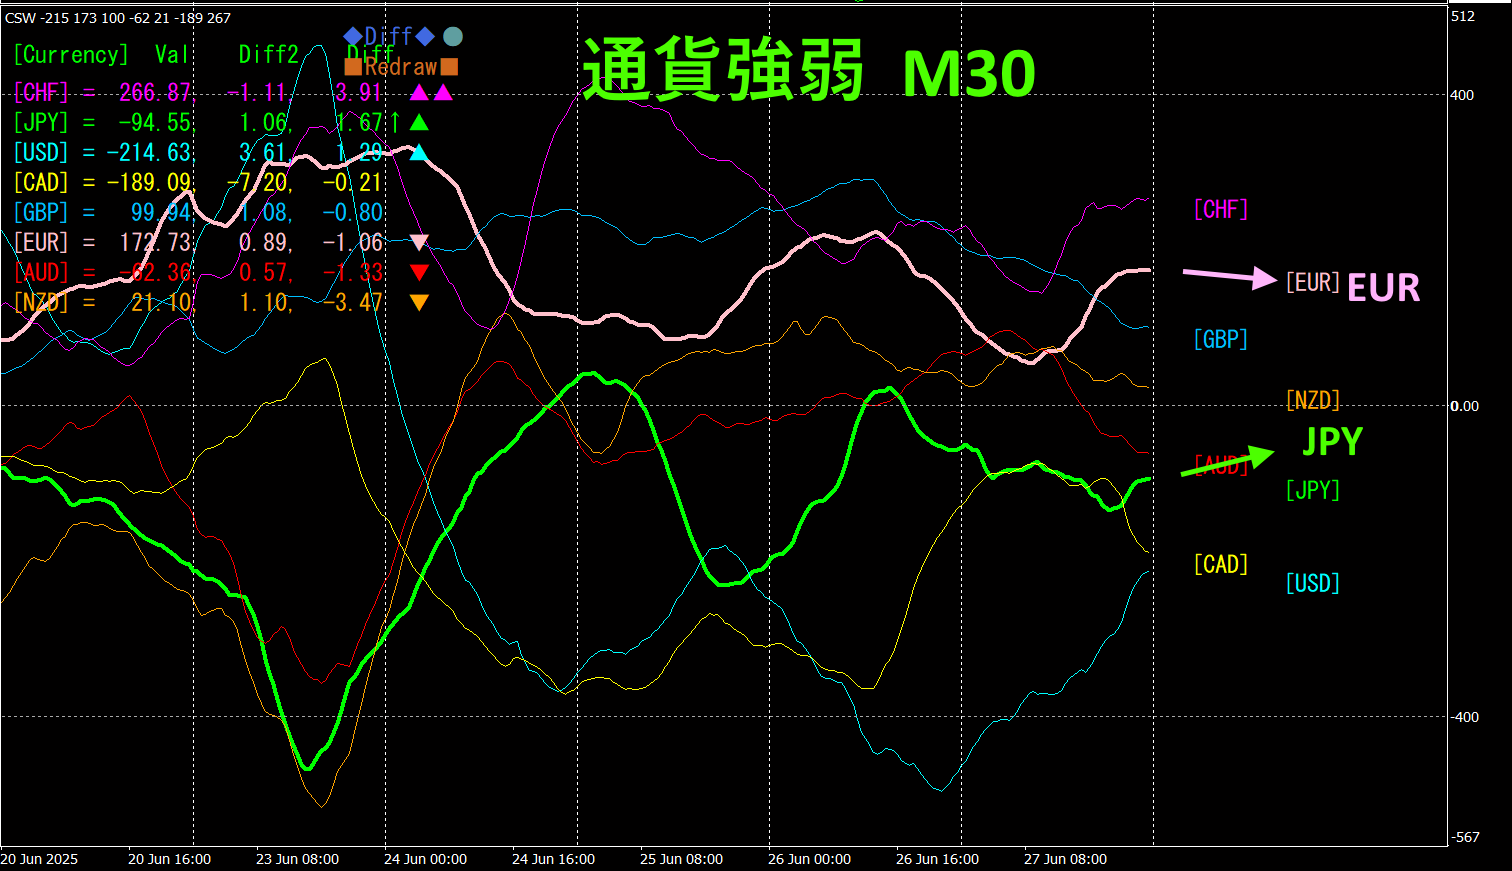
30-minute currency strength chart.
Pink isEUR, green isJPY. and is slightly downward,JPYJPY are in a contrarian relation. In the currency strength chart, is upward, so is expected to head down.
4.
New IndicatorDual_MACD_Trend_Indicator to try it
New indicator「Dual_MACD_Trend_Indicator」 is below.
MT4 version:https://www.gogojungle.co.jp/tools/indicators/62199
https://www.gogojungle.co.jp/tools/indicators/62202
It is an indicator that clearly shows the direction of the trend with color. If the color bar isLime, buy; if, sell. It is easy to use for beginners. If the bar is green, there is an uptrend; if red, a downtrend; if no color, no trend. Because it uses color display, you can grasp the trend status at a glance.
I have installed this indicator onNZDUSD on the1 hour chart.
If you install this indicator, buy zones and sell zones are color-coded, so you won't hesitate between selling or buying. In the upper chart, sell in the red ellipse area, buy in the green ellipse area. In other timeframes, simply refrain from trading to avoid unnecessary capital loss.
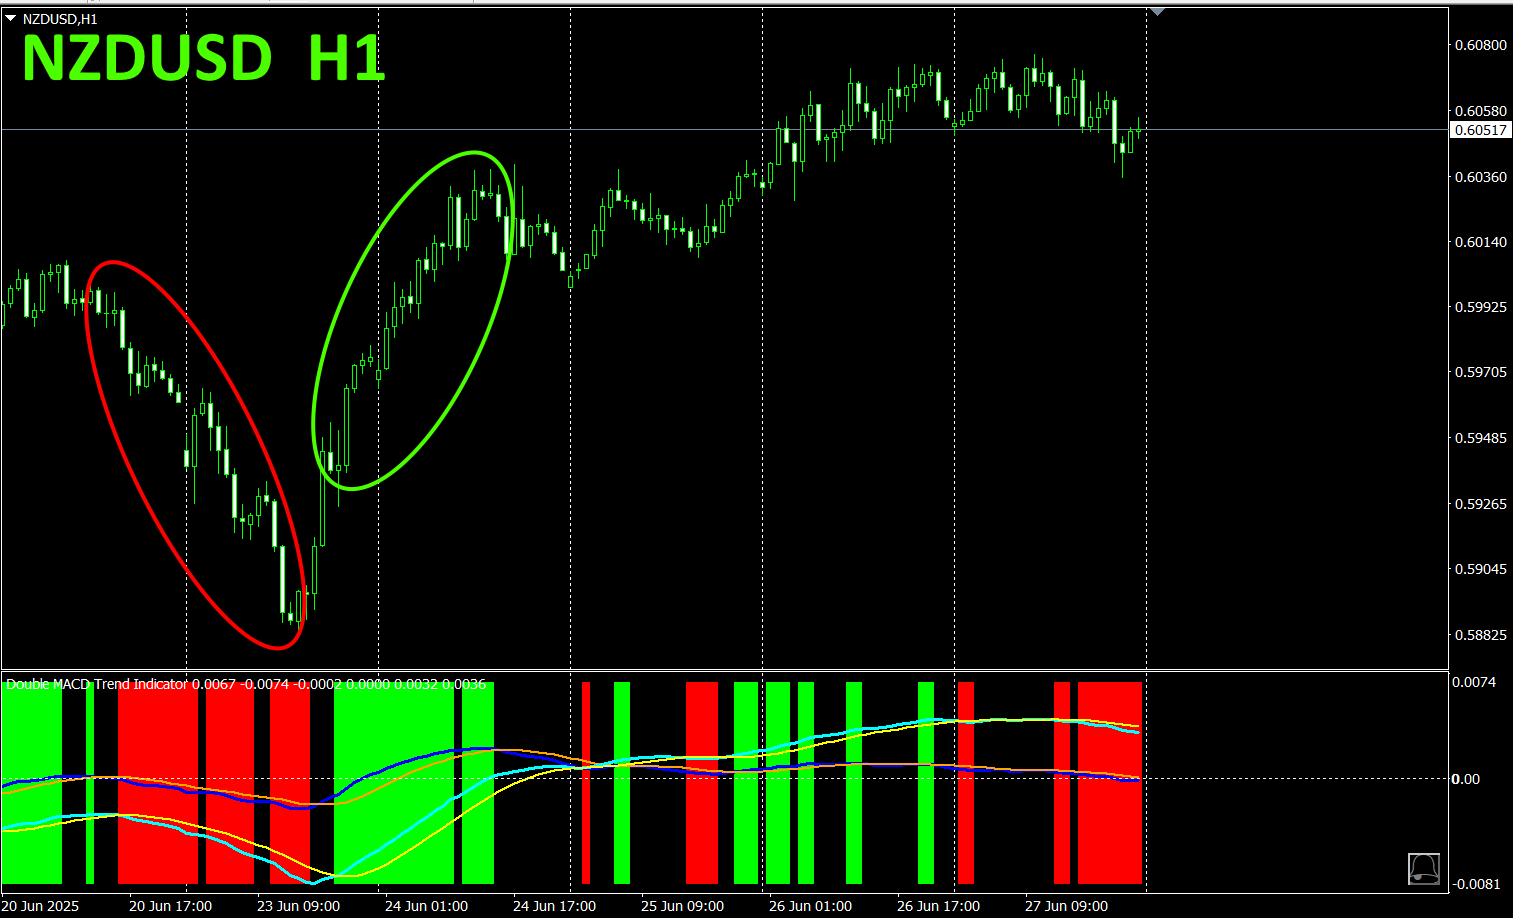
Profit spread is90pips for selling and90pips for buying, totaling180pips, which is ample for weekly trading profits."Only capture what grows, trade nowhere else" is the principle of avoiding losses inFX.
With theDual_MACD_Trend_Indicator, you will never hesitate about the trading direction again.
5.
"Hyper-CSW" has been released
"Hyper-CSW" is a high-performance indicator that visualizes the strength of the eight major currencies at a glance. It records the strongest currency and a score for the past 10 bars on the currently displayed timeframe, enabling precise detection of trend durability and turning points. In addition, it provides multi-timeframe analysis displaying currency strength ranking (top4,H1,H4,D1W1. Its highly legible color lines help you determine market direction. For details, see the following link.4 currencies) with scores across multiple timeframes such as

https://www.gogojungle.co.jp/tools/indicators/65082
※Recommended indicators
"Toretore Indicator"
https://www.gogojungle.co.jp/tools/indicators/50115
"TrendLine-EX"
https://www.gogojungle.co.jp/tools/indicators/42257

"8C currency strength visualization indicator" please refer to the following page.

version https://www.gogojungle.co.jp/tools/indicators/39150
version https://www.gogojungle.co.jp/tools/indicators/39159
【My Current Listings】


