2025-6-28 USD/JPY, Gold, and S&P 500
【USD/JPY】
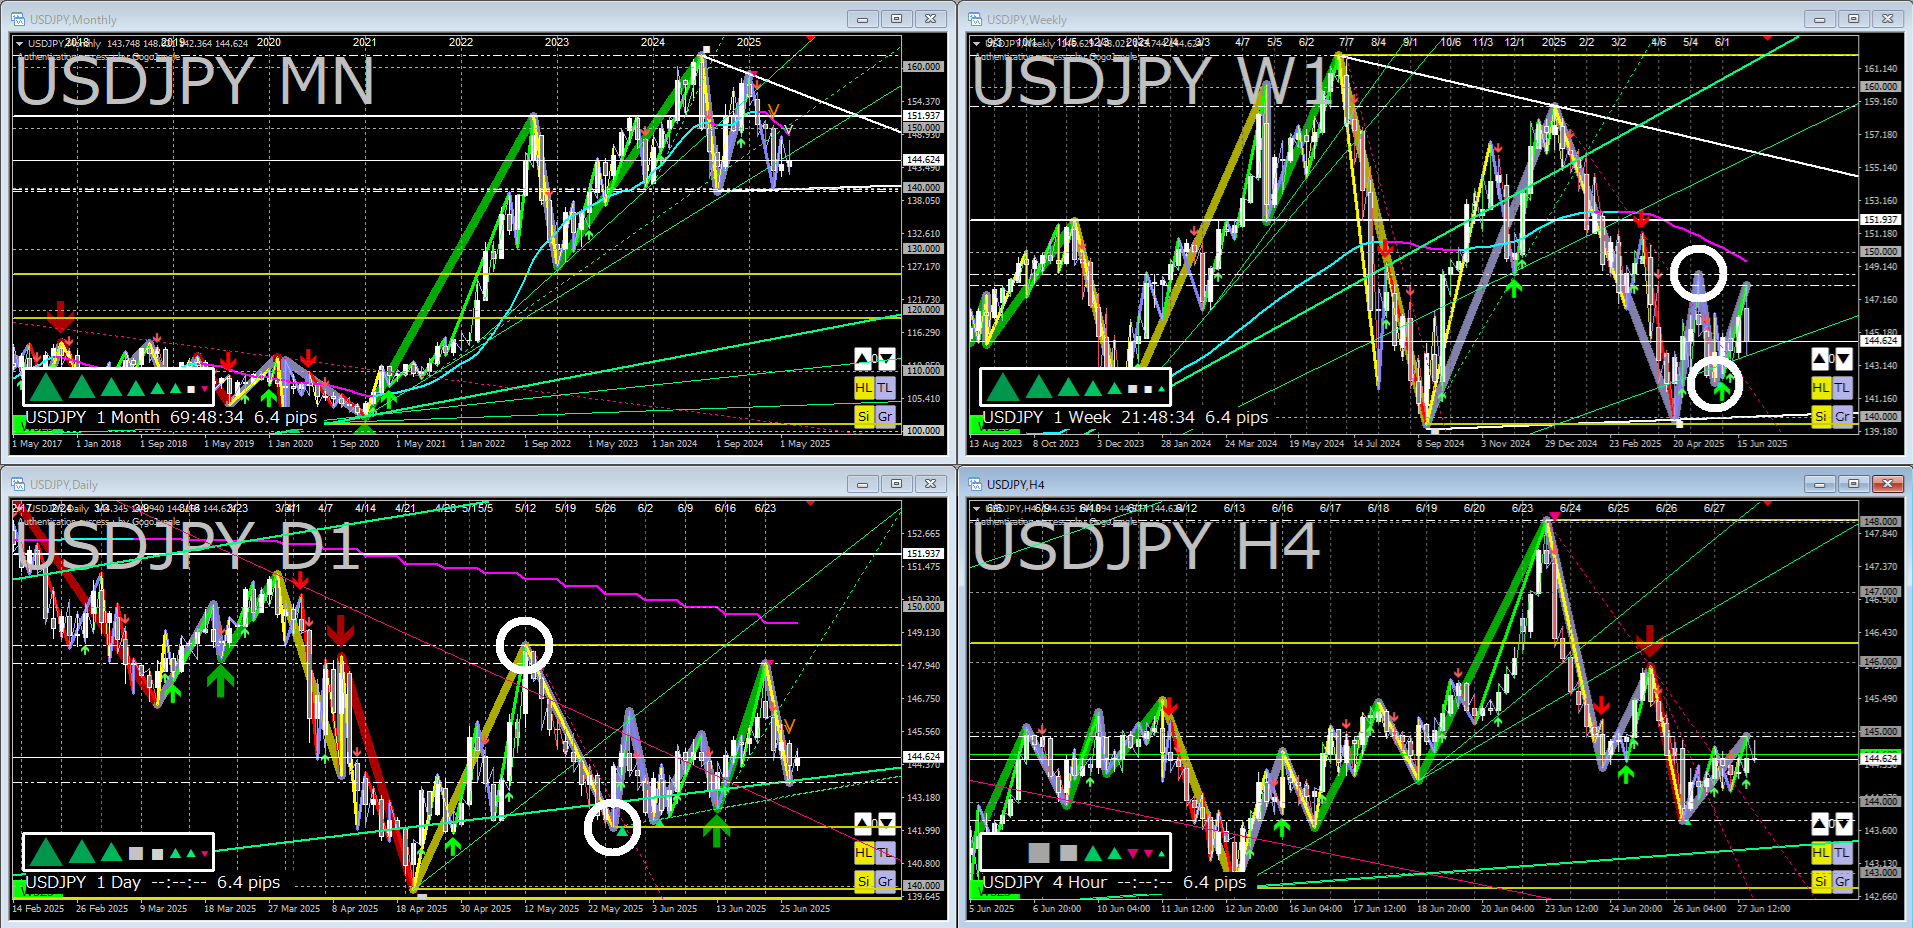
The above image overlays Starting from the world’s smallest, next-generation ZigZag and Trendline Pro 2.
From the monthly chart, the bearish triangle (descending triangle) suggests that selling positions aiming for a break below 140 yen remain many.
However, looking at the 140 yen touch interval on the monthly chart, it seems that at least another 1–2 months of time-related adjustment will be needed before a downside breakout occurs.
As a premise, on the monthly level we are in the middle of an uptrend.
If we cannot break below 140 yen, accumulated selling positions may be squeezed, potentially driving a rapid move toward a large yen depreciation.
This week for USD/JPY, I expected a breakout above the daily chart triangle, trying higher levels, but it stayed within the weekly triangle’s range, a momentumless development.
If this pattern continues and the weekly triangle breakout also remains within the monthly triangle’s range, a flag-like formation on the weekly chart could lead to a time-related adjustment.
In any case, with no clear directional feel, I’d like to wait and see for now.
If the expected flag shape unfolds, it will be flat, so I plan to pull back and buy on dips with a small position.
【GOLD】
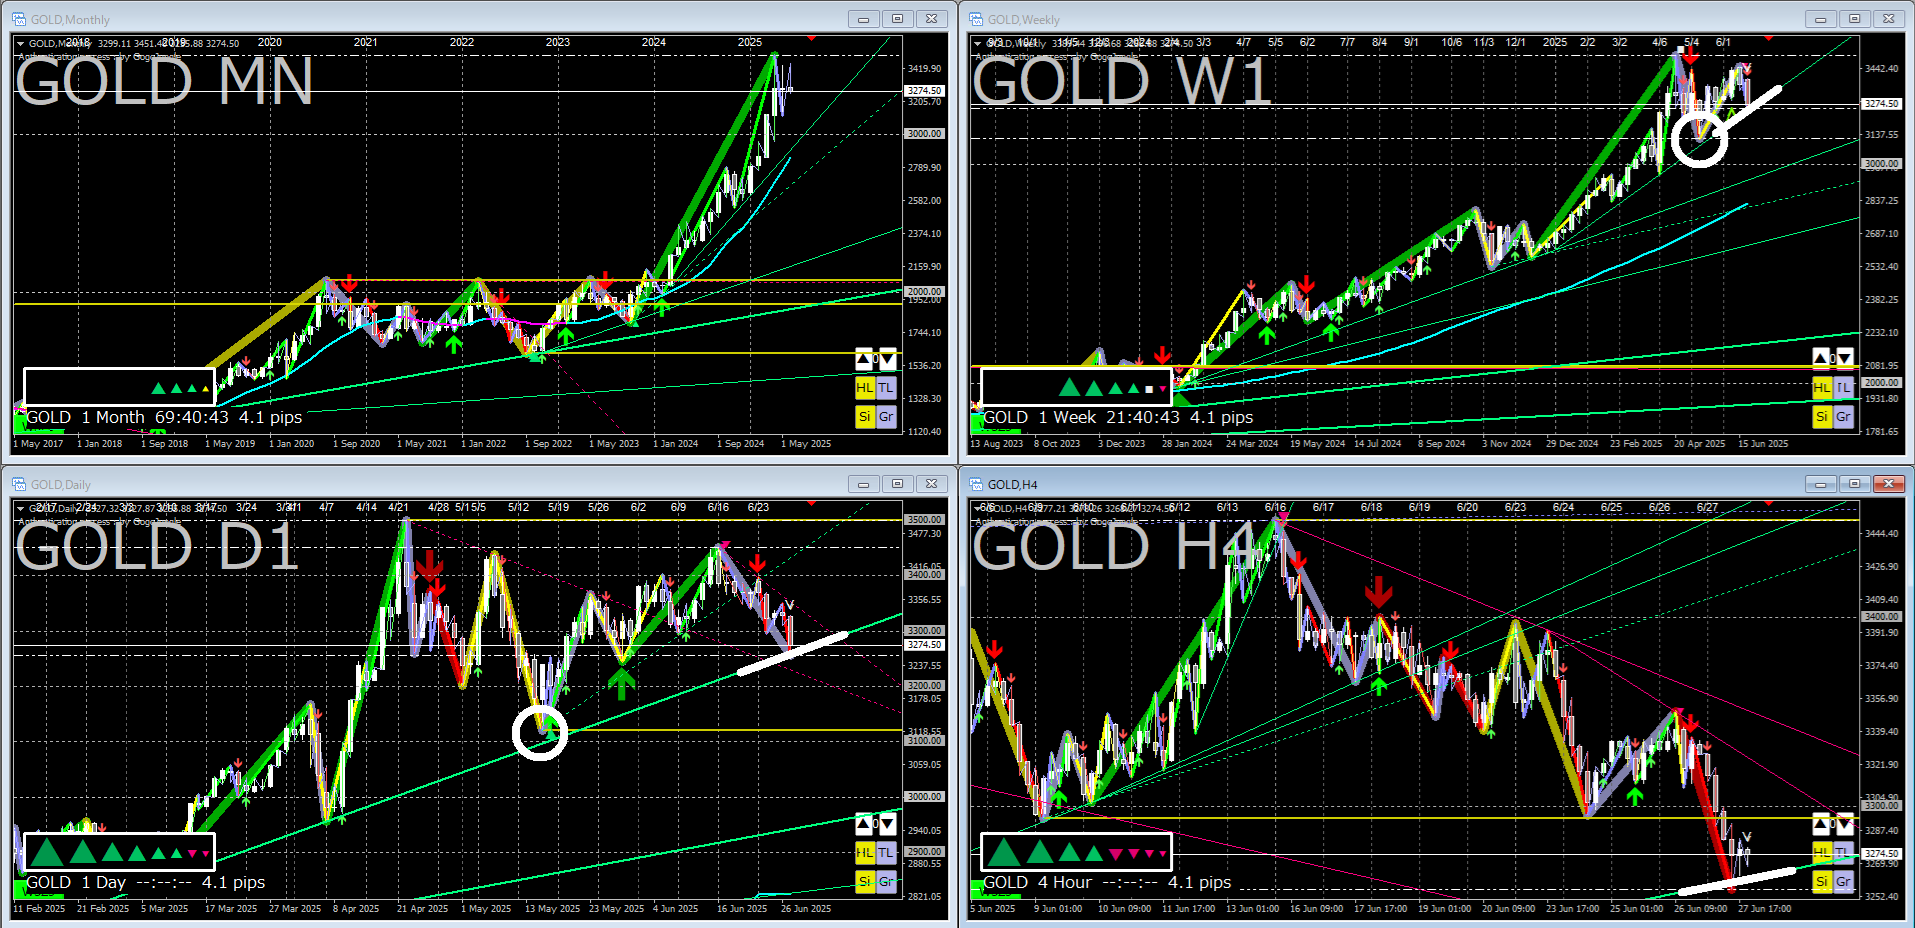
The above image overlays Starting from the world’s smallest, next-generation ZigZag and Trendline Pro 2.
This week's gold continued in a four-hour downtrend.
As expected, perhaps funds have moved with the rise in US stocks.
Currently, it appears to have paused at the trendline, with the monthly, weekly, and daily still in an uptrend.
Technically, first whether the trendline is breached, then whether the low circled in white is broken below.
If the trendline holds and rebounds, the uptrend may continue, aiming for new highs.
If the trendline breaks and there is a rebound at the white circled resistance, it may consolidate sideways for a while due to time-related adjustment.
If the white circled resistance is broken downward, it might drop somewhat more, but given supply and demand, I don’t think it will continue dropping.
【S&P 500】
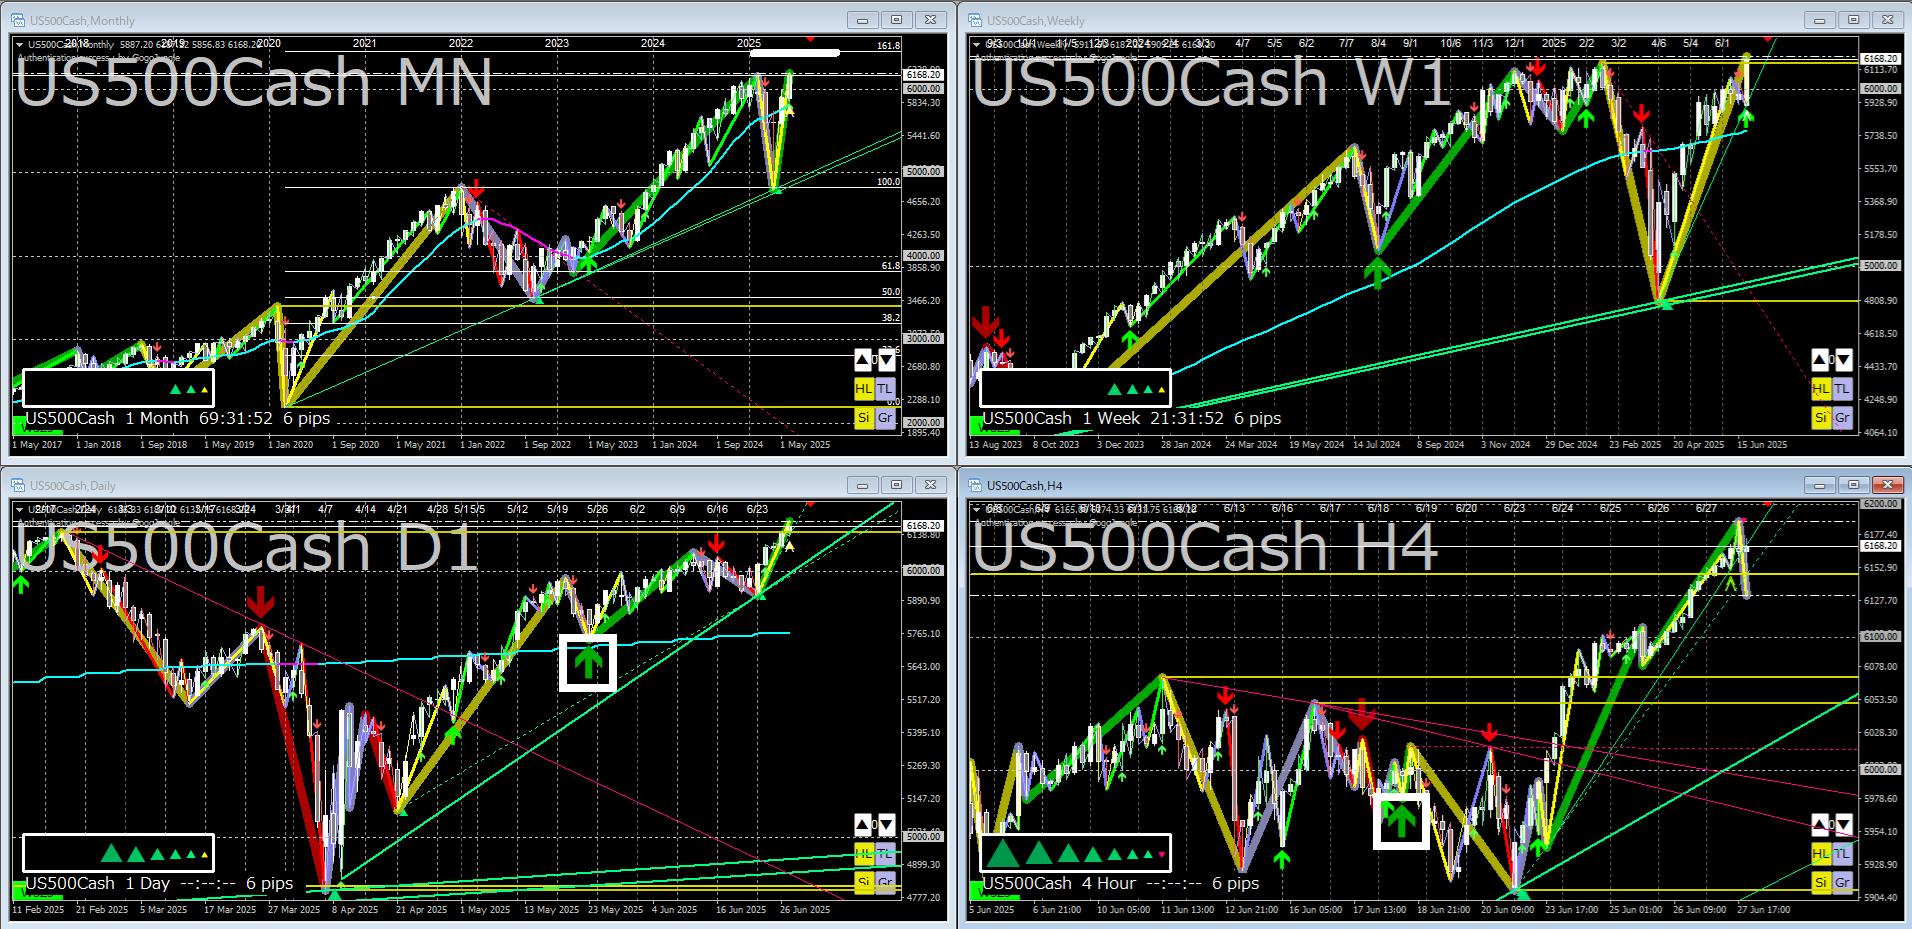
UpThe image overlays Starting from the world’s smallest, next-generation ZigZag and Trendline Pro 2.
I view the S&P 500 on a long-term basis, not weekly.
It made a new high, yes.
We don’t know how high it will go from here.
According to Dow Theory, a decline would follow after a rise is exhausted.
On the monthly level, Fibonacci retracements seem to be working well.
For now, I’d like to see how it handles a move beyond 161.8.
If it doesn’t break through with momentum, it may enter time-related adjustment, so I’m planning to close out the positions bought due to the tariff shock.
* If the image is small and hard to read, right-click the image and select “Open image in new tab” to view at full size.
*Preconceptions are only harmful, so please treat this as one possible scenario and use it for reference only.
ーーーーーーーーーーーーーーーーーーーー
If you found this article helpful, I would be glad if you could press the below ‘ Read More’ button. (There is no continuation. It’s a like.)
ーーーーーーーーーーーーーーーーーーーー