

Utilization of the "Visualization Indicator" (No. 204)
"Visualization Indicator" utilization (its204)
1. Further evolve the "28 Currency Pairs List Indicator" into an indicator
"8CPVisualization Indicator"to drawEURAUD.
There are versions of the "8CPVisualization Indicator": Oceania version,London version,NewYork version,AnyCP version. This time, we used theOceania version.
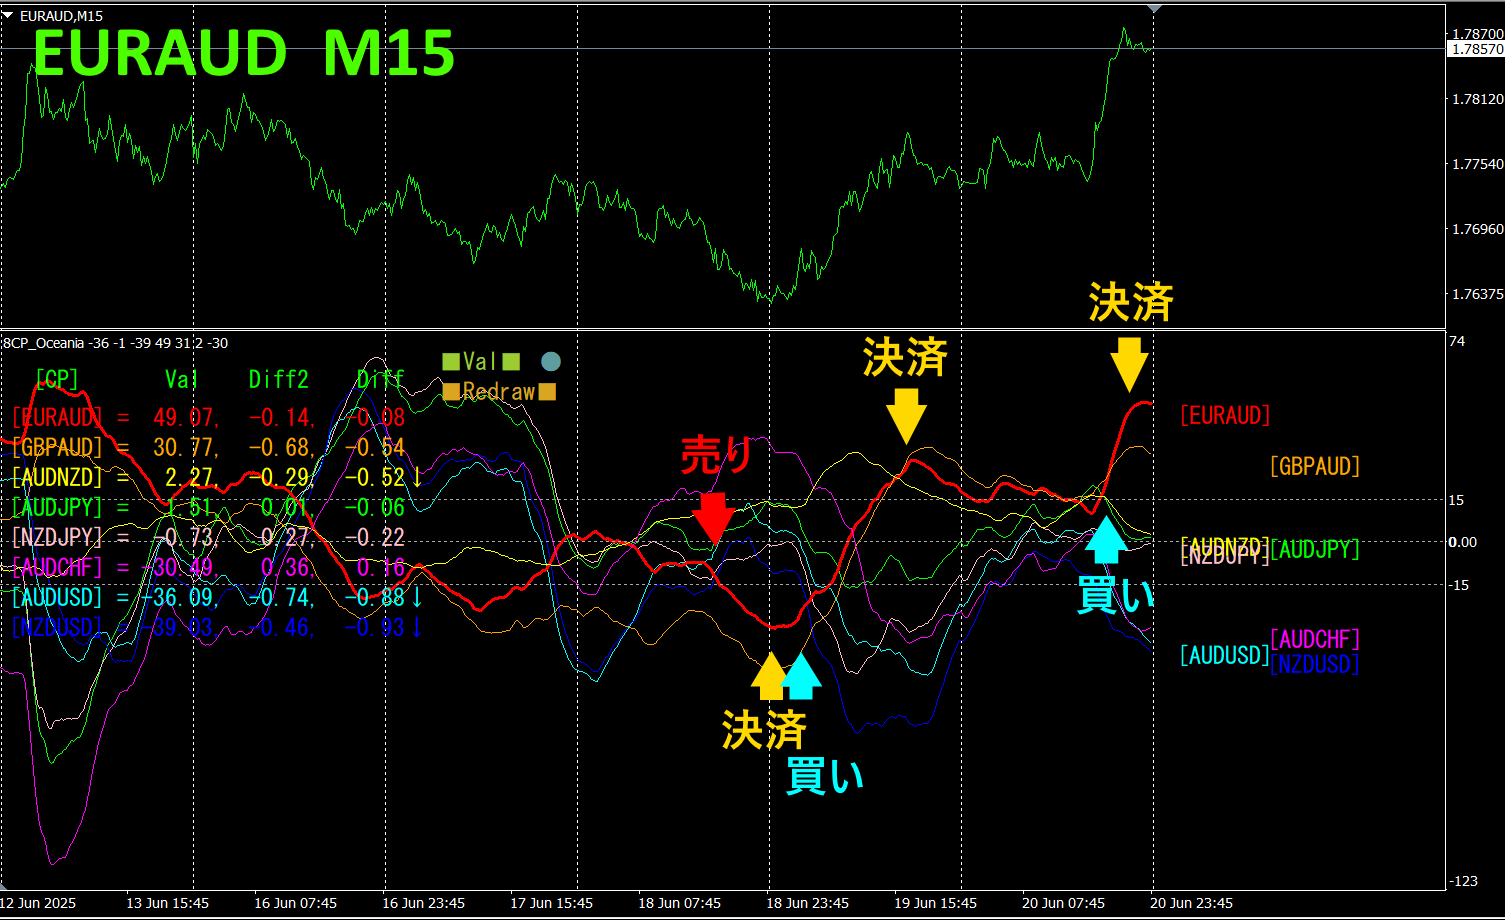
The top half is the 15-minute chart ofEUR A U D. The bottom half is from the "8CPVisualization Indicator"; the red bold line graph corresponds toEURAUD.
On Wednesday, EURAUD's graph dropped below the other graphs, so we opened a sell position. We closed at the bottom, bought on the rebound, closed at the peak, and on Friday it rose again, so we bought here as well. In three trades, profits were about30pips,70pips,80pips respectively, totaling about180pips of profit.
Last week, AUD was weak, soAUD◯◯◯ went down, and ◯◯◯AUD went up, but the red graph above, EURAUD, is moving upward, so we can read that as a bullish direction.
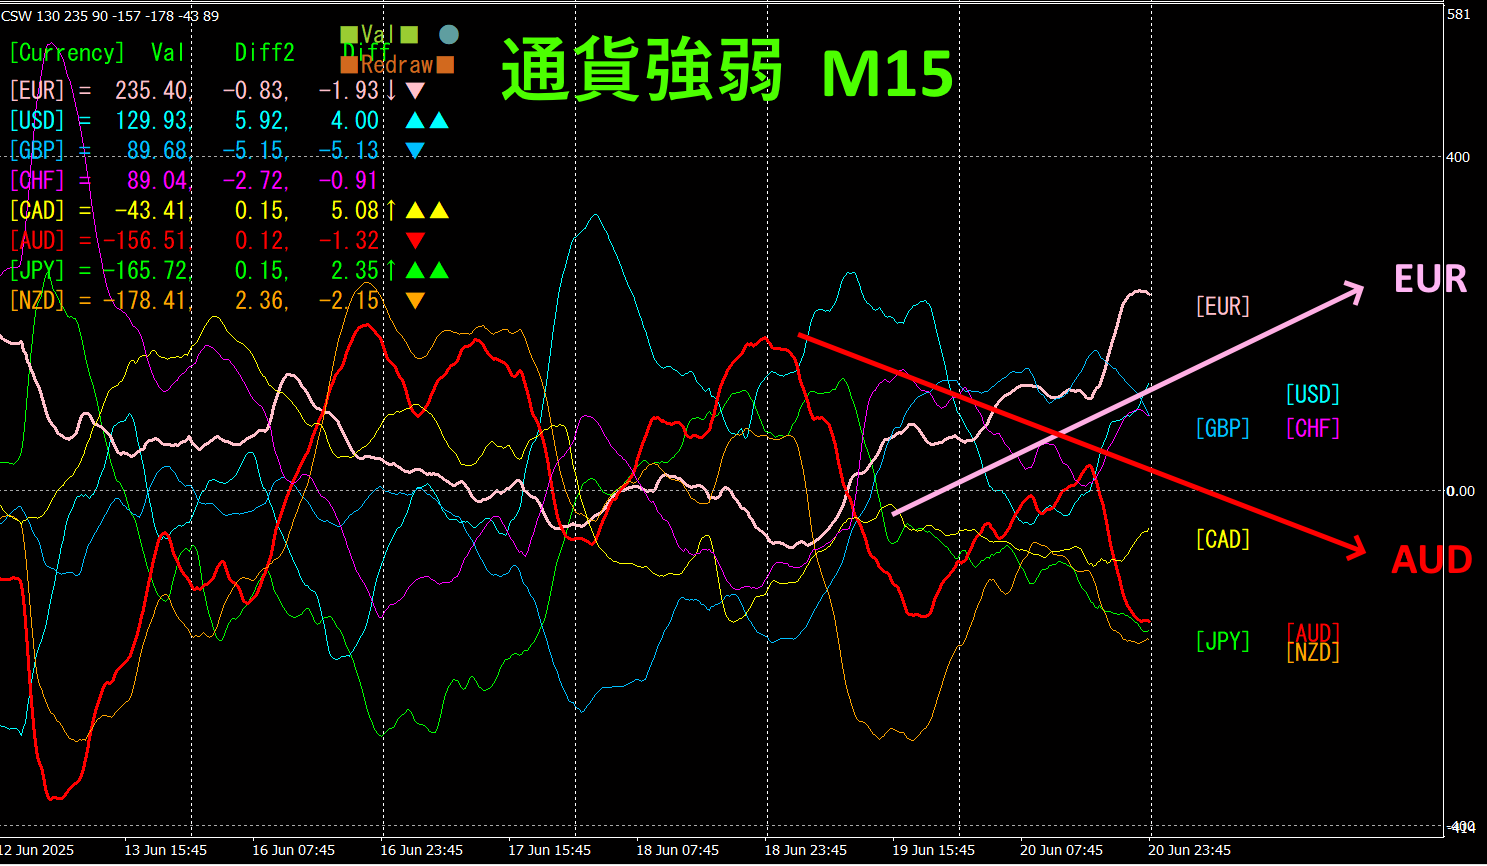
Currency Strength Graph
Looking at the 15-minute currency strength graph, EUR and AUD show wave-like movements, so for the currency pair EURAUD, you can read that it is in an uptrend. Because it is a wave, there are fluctuations, but EUR is in an upward wave, AUD is in a downward wave. NZD behaves similarly to AUD, so you could have bought EURNZD as well.
Using "TrendLine-EX", you can automate entering and exiting on diagonal trendline breaks. It can be left as is for easy trading. TheTrendLine-EX is a semi-automatic EA that can automatically sell on a trendline break and automatically close on a trendline breakout upward.
2. Best SelectTry the indicator
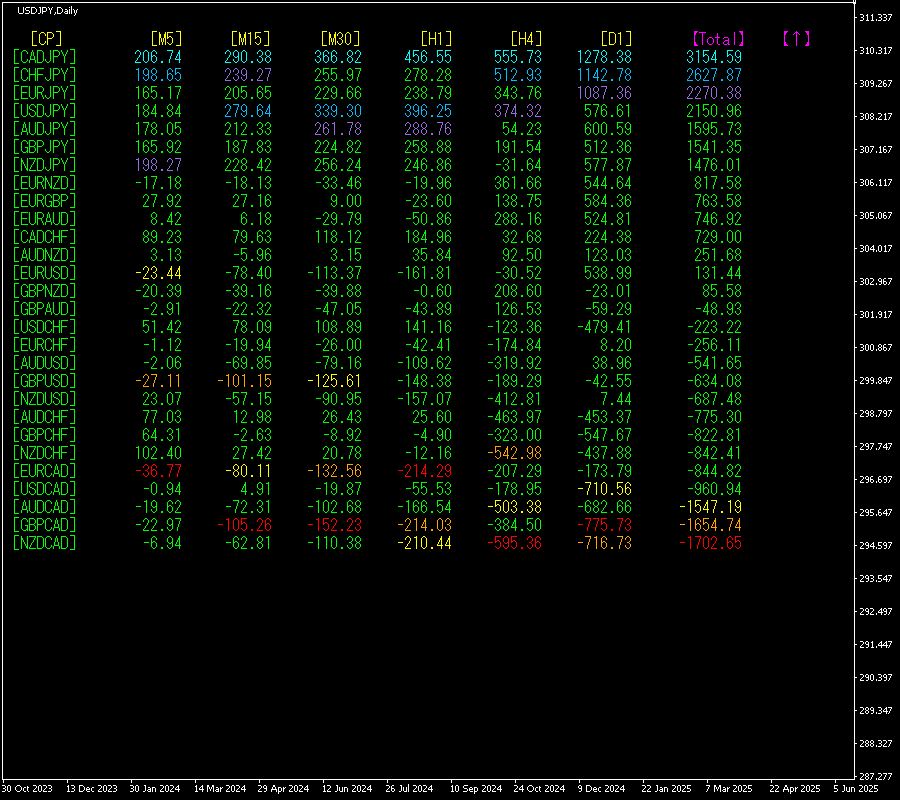
Below is a screenshot taken onJune16,2025, 7:20 JST).
Total]is arranged in descending order. At the top,CADJPY shows blue on all timeframes.Totalvalue is +3154.59, indicating a strong uptrend forCADJPY across all timeframes.
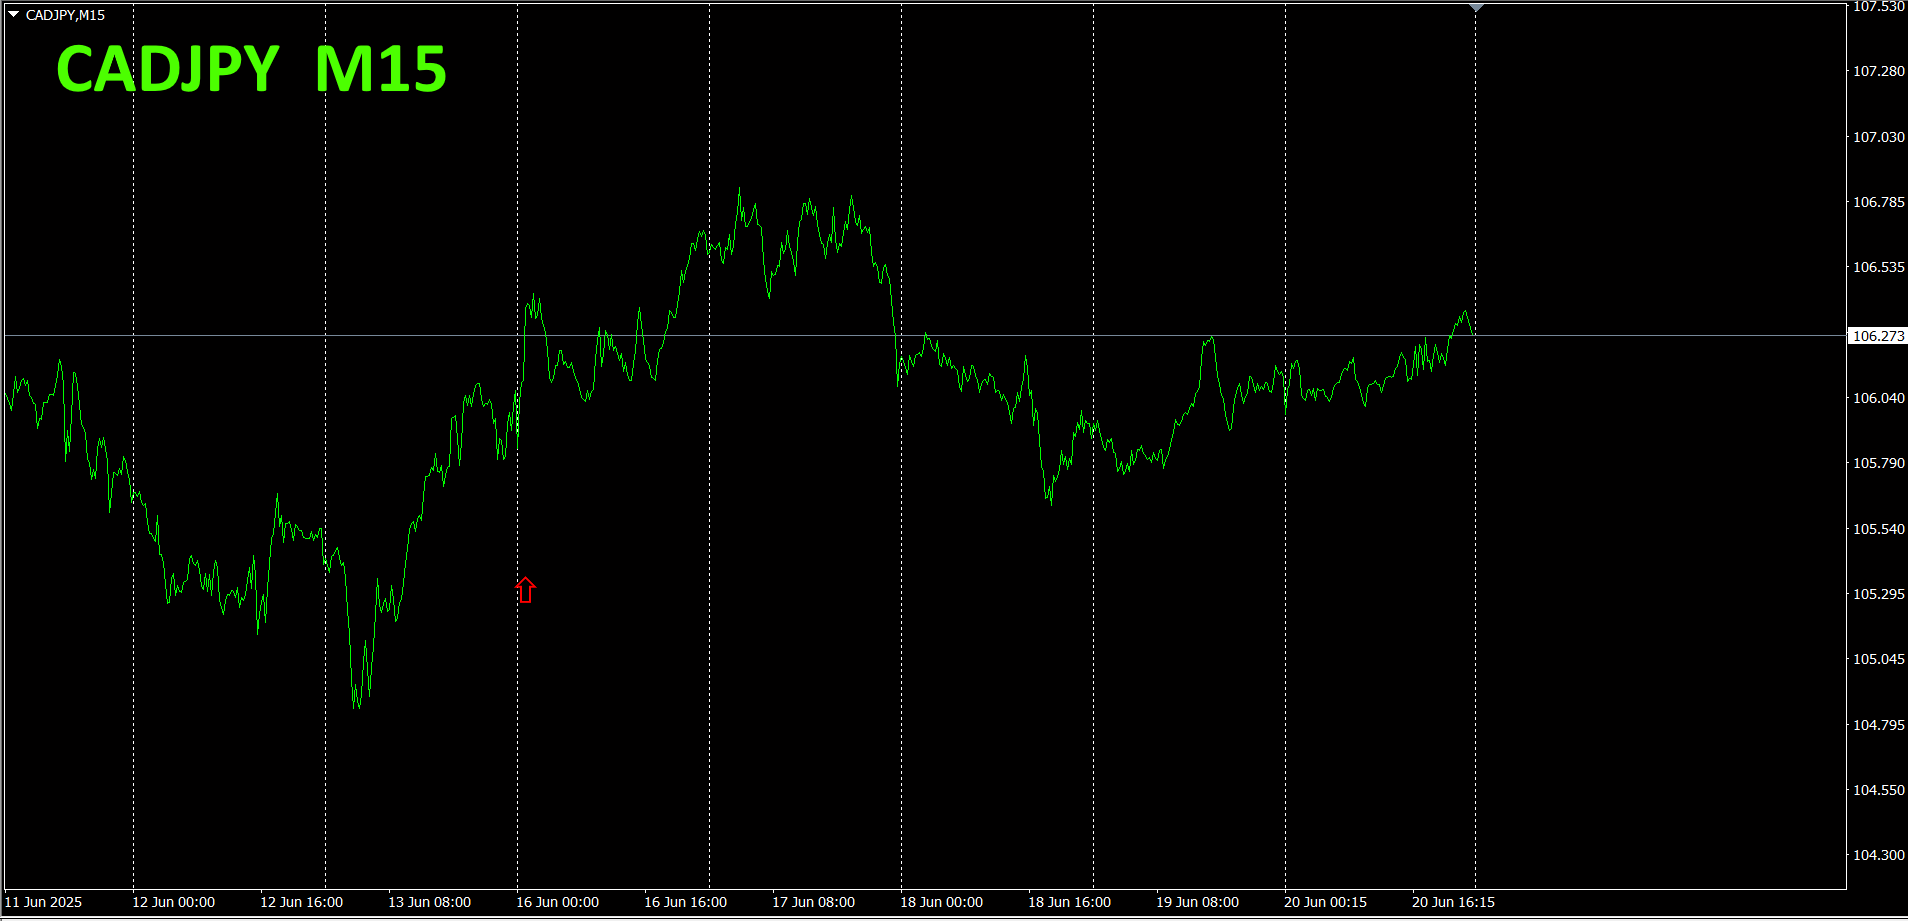
Now, let's look at the CADJPY chart.
The red arrows indicate the point when the screenshot was taken. It captures a rapid rise during an uptrend.
"28 currency pairs Best Select indicator" can easily identify which currency among 28 pairs is showing the strongest trend. It also tells you whether you should trade now with numbers and colors. It is an excellent indicator to judge all currency pairs at a glance.
"28 currency pairs Best Select indicator"
https://www.gogojungle.co.jp/tools/indicators/35128

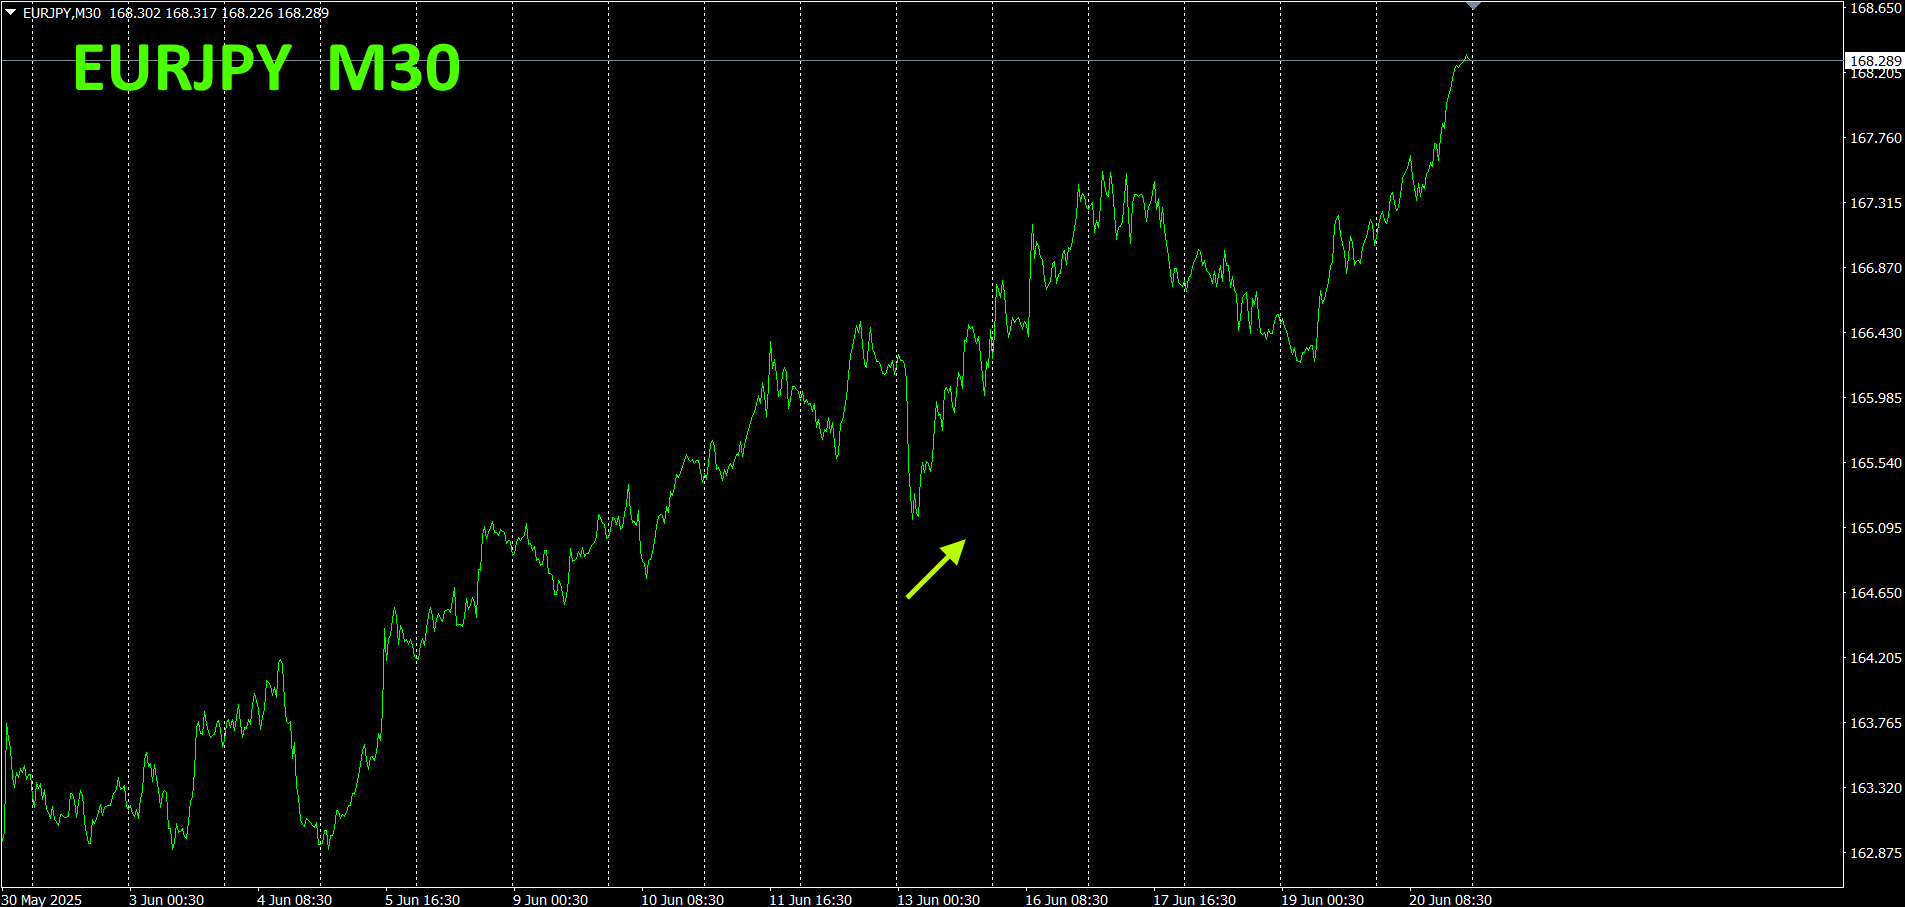
3. 2021 year 5 month to now EURJPY's movement what happened?
year 5 month since then EURJPY's movement has been tracked.
To observe the overall trend, we plot about30 minutes of the most recent3 weeks.
Last time I wrote the following.
Pink isEUR, green isJPYEUR is rising,JPY is falling, soEURJPY
There are pullbacks, but it has been rising steadily on the right-shoulder. In such a chart, simply buying on pullbacks can yield solid profits; this is a valuable market.
minutes of currency strength chart.
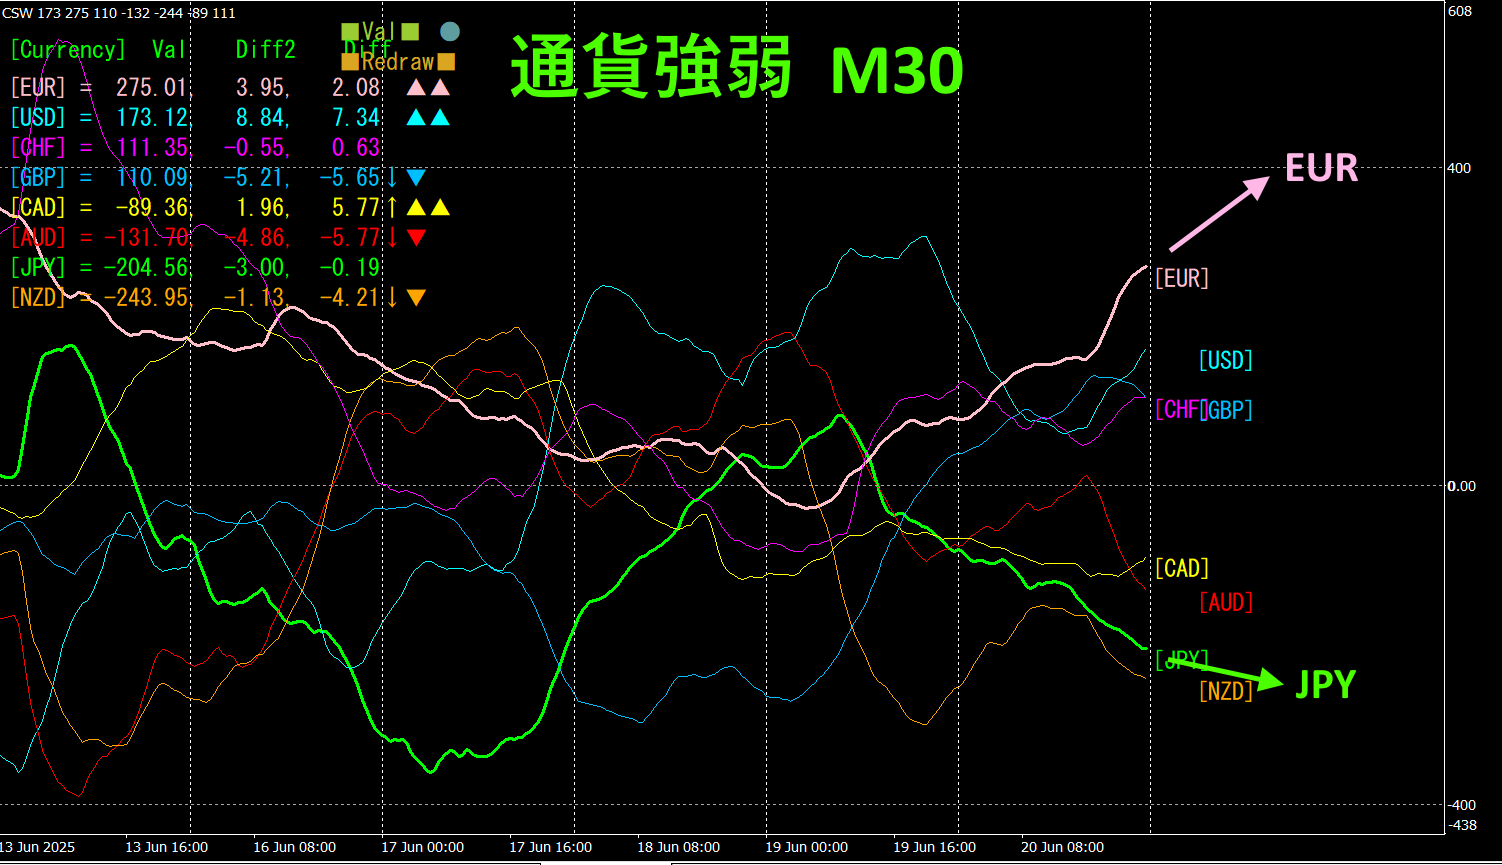
Pink isEUR, green isJPY. It has a clean inverse correlation: currency strength chart shows EUR rising firmly,EUR is rising,JPY is falling. EURJPYEUR andJPY has widened substantially, so soon a reversal toward convergence is expected. If so, you should simply sellEURJPY.
4.
New IndicatorDual_MACD_Trend_Indicator to tryout
New Indicator " Dual_MACD_Trend_Indicator " is shown below.
MT4 version:
MT5https://www.gogojungle.co.jp/tools/indicators/62202
An indicator that clearly shows the direction of the trend with color. If the color bar isLime, it is a buy; ifRed, it is a sell. It is easy for beginners to use. If the bar color is green, the trend is up; if red, the trend is down, and if there is no color, there is no trend. Because colors provide an at-a-glance view of trend status.
I have added this indicator to theEURJPY on the1 hour chart.
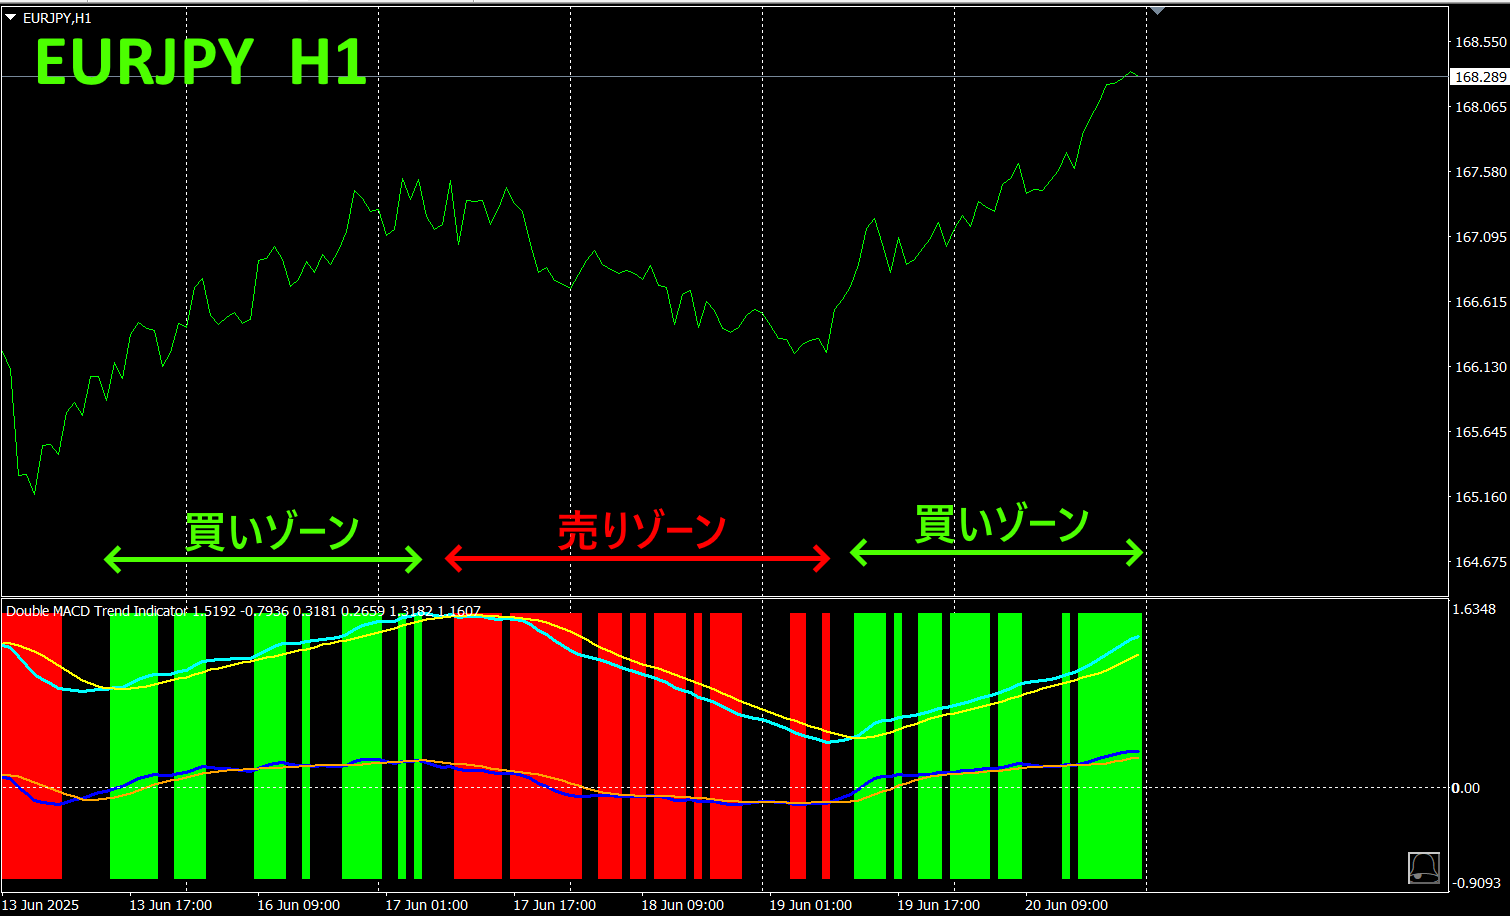
Long-term MACD alignment with the main line and the signal line shows: if the main line is above the signal line and the gap is wide, it indicates a "buy"; if the main line is below and the gap is wide, it indicates a "sell."
Also, the larger the slope of the MACD, the stronger the trend. When undecided about which currency pair to trade, pay attention to the slope of the MACD.MACD that is flat suggests avoiding trading that pair.
UsingDual_MACD_Trend_Indicator eliminates any doubt about trade direction.
Recommended indicators
"Rettore Indicators"
https://www.gogojungle.co.jp/tools/indicators/50115
"TrendLine-EX"

https://www.gogojungle.co.jp/tools/indicators/42257

"8C Currency Strength Visualization Indicator" refers to the page below.

MT4 version https://www.gogojungle.co.jp/tools/indicators/39150
MT5 version https://www.gogojungle.co.jp/tools/indicators/39159
【My items for sale】


