

[Session 2] Environmental awareness indicated by wave overlap — Capturing temporal axis coherence with the Wave Master
In trading, it has become common sense to compare multiple timeframes side by side.
However, simply switching timeframes makes it difficult to see how the higher-timeframe waves relate to the lower-timeframe waves in practice.
What really shines here isWave Master (WVM) multi-timeframe display of waves.
By overlaying the wave structures of multiple timeframes on a single chart,the Wave “consistency” and “points of divergence”naturally come into view.
When the shapes of waves align, you can see the market’s center of gravity
The smaller waves on the lower timeframe are formed in accordance with the larger waves on the higher timeframe――.
By visually representing such a “nested wave structure” on the chart,you can intuitively grasp which wave the current movement belongs to.
▼ Diagram: Alignment of higher- and lower-timeframe waves
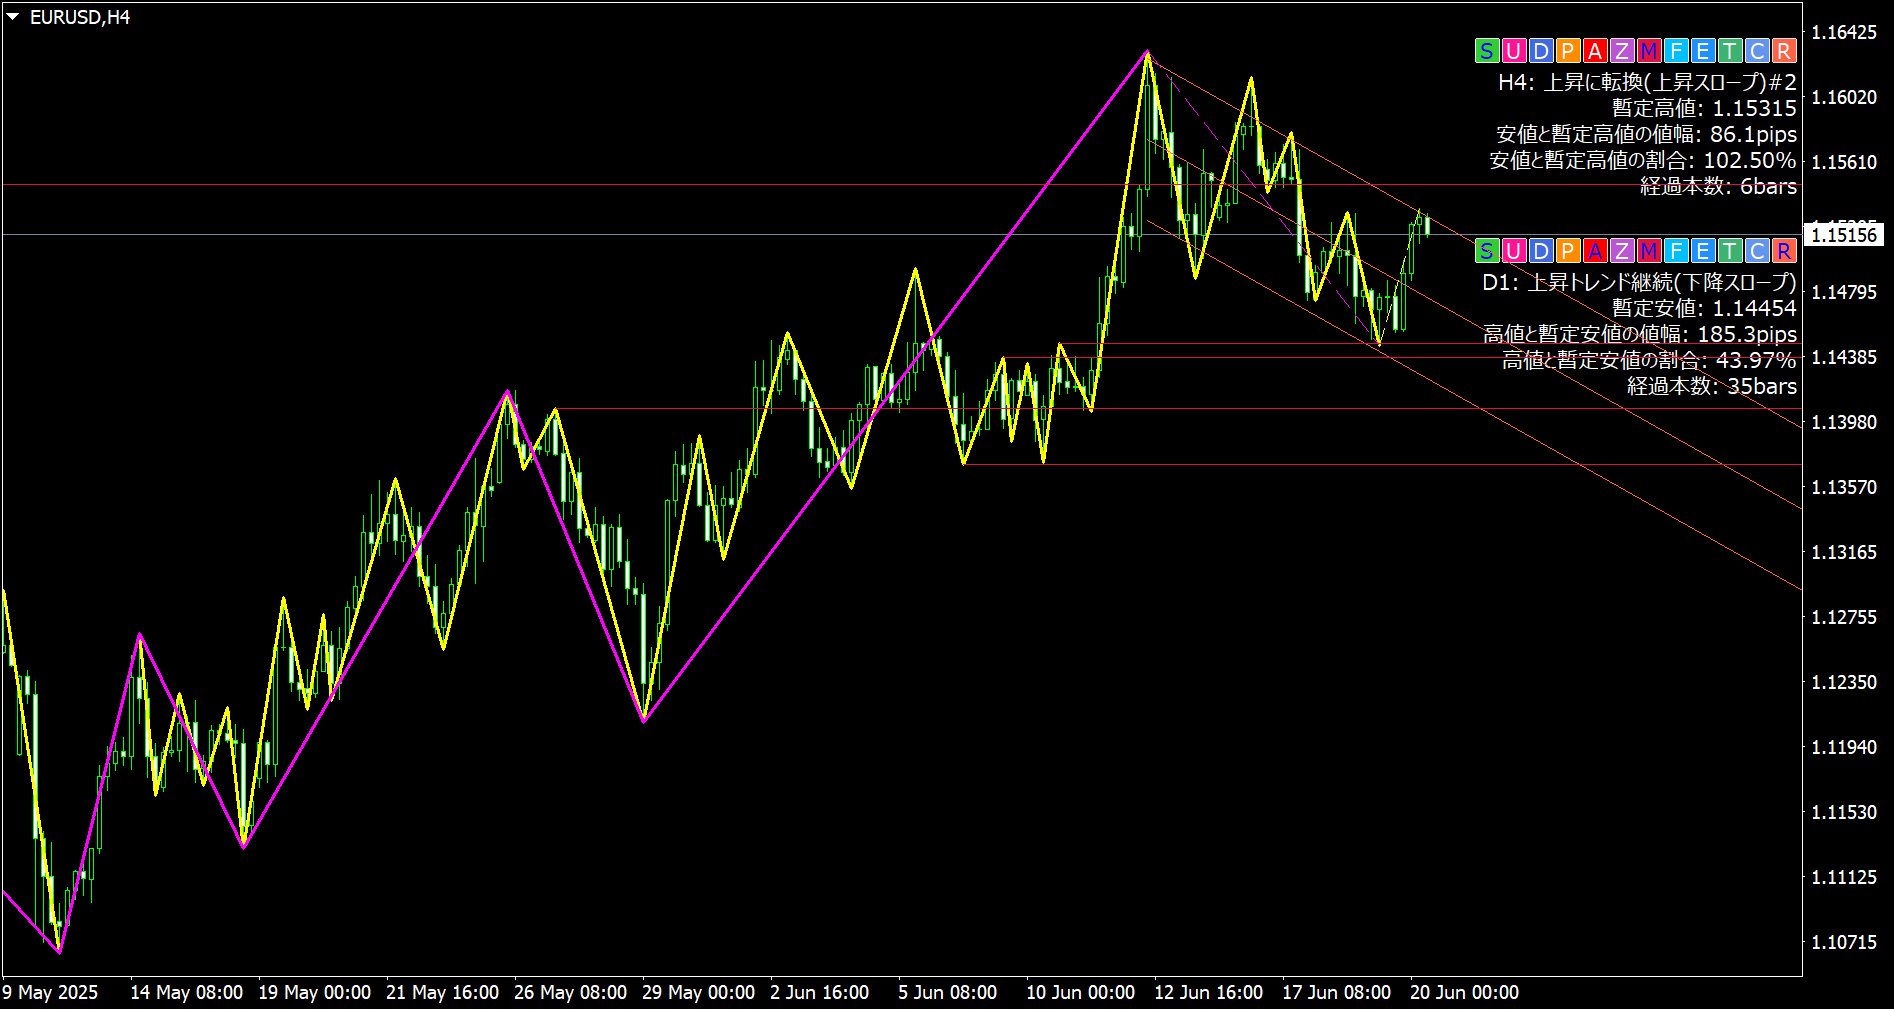
For example, if the third wave is progressing on the higher timeframe while the second wave of the retracement is forming on the lower timeframe, that can be judged asa pullback-buy setup in accordance with the higher-wave trend.
In this way, rather than the waves on each timeframe appearing misaligned,they appear as a unified rhythm, which greatly improves the resolution of environmental awareness.
When alignment is not present, there is also opportunity
Conversely, when the higher-timeframe waves are nearing their end and the lower-timeframe counts start to drift,signs of a potential reversalcan be anticipated and monitored.
WVM brings to light such“drift of the wave’s center of gravity”, allowing you to notice movements that would otherwise be missed by simply changing perspectives.
Waves can be applied by knowing the “shape”
Wave structures are not random; they have certain “forms” to some extent.
By grasping those forms in a visible way,understanding which wave is where on which timeframebecomes a significant advantage for discretionary traders.
The “shape” of waves and the overlap of timeframesbegin to reveal a clearer map of the market.
Next time, we will introduceentry judgments and practical chart usage examplesutilizing this map.