

[Episode 1] A Weapon Supporting Discretionary Judgment ~ Visualize Waveform Analysis with a Wave Master
In discretionary trading, grasping the waves is an indispensable element for judging “which phase the current market is in.”
However, isn’t this how many traders feel?
- “I worry whether I’m reading the wave correctly…”
- “It takes time to recognize the environment, and entries are delayed…”
- “In the end, I’m judging by instinct….”
For such concerns, one answer is ‘MT4 Wave Master (WVM)’.
An approach that visualizes waves on the chart
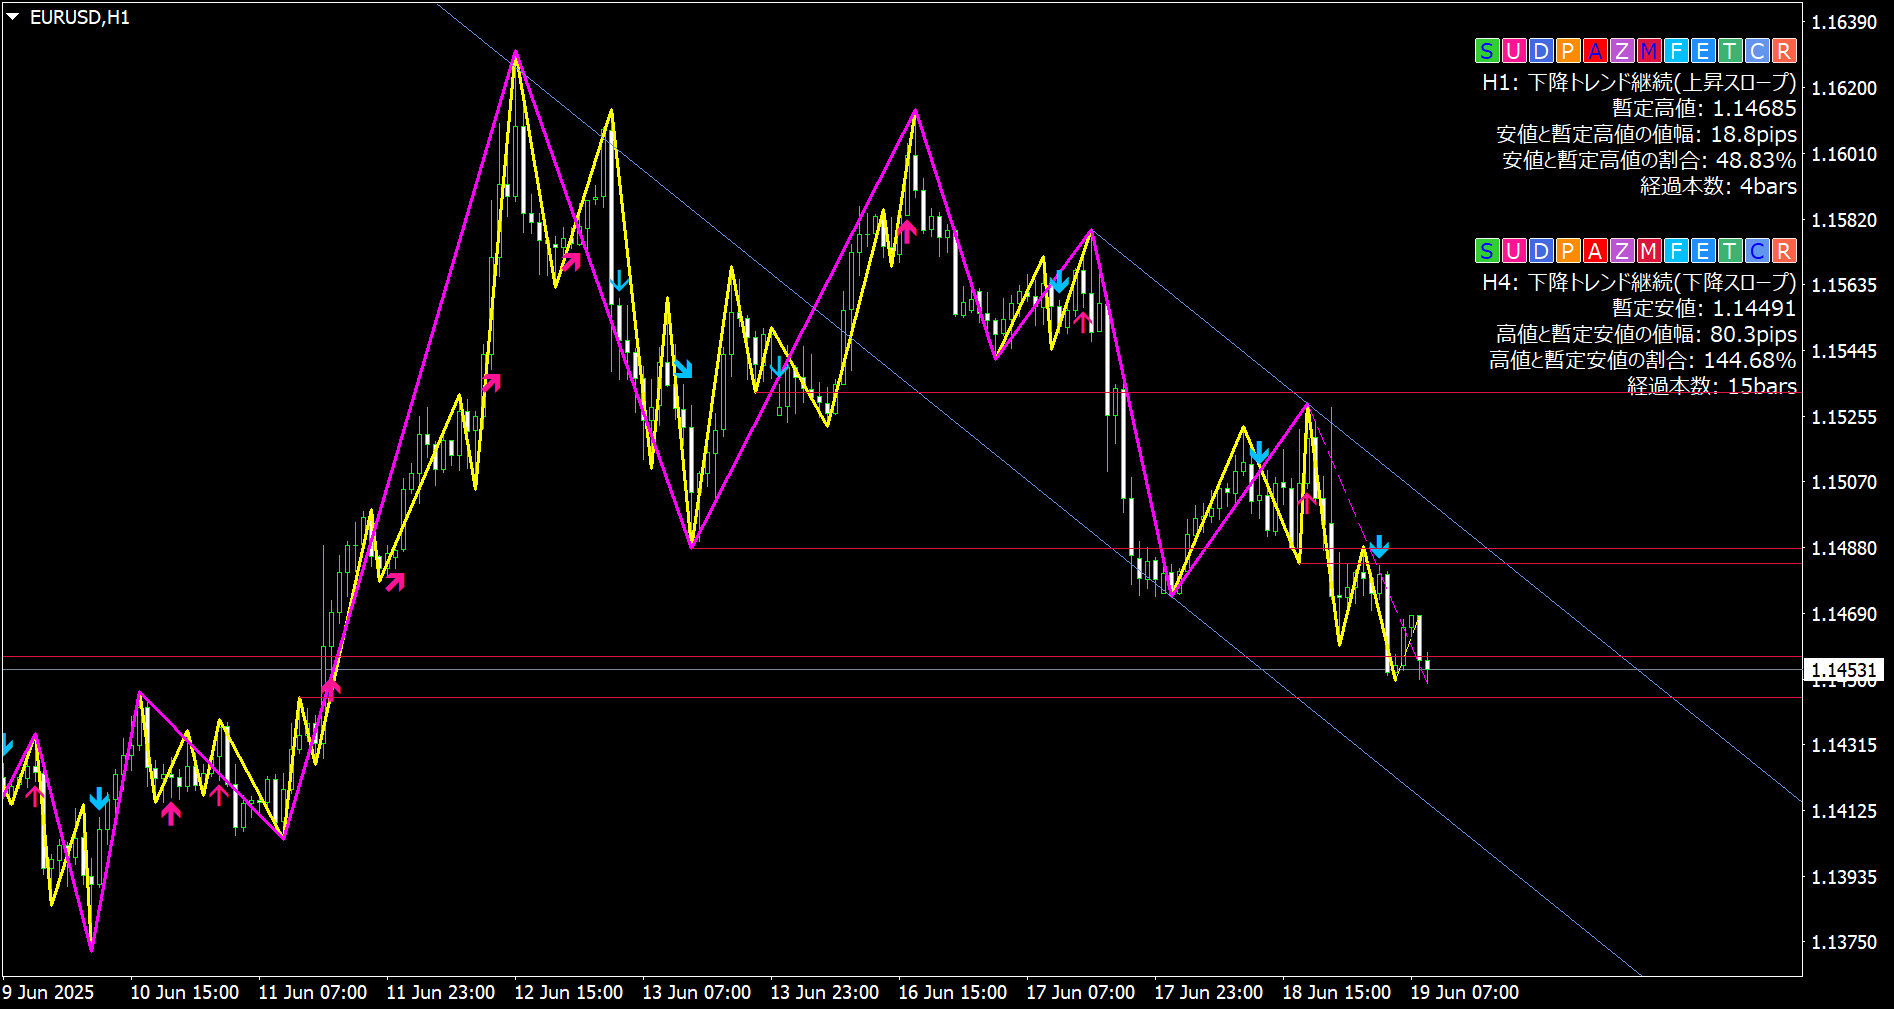
WVMdraws the wave structure with lines,makes the alignment with higher timeframes visible.
In addition to the current wave phase and swing structure, it enables a visual grasp of market conditions such as the emergence, continuation, reversal, and trendless statesof the trend—which is WVM’s strength.
▼ Diagram: Visualization of waves with WVM
This allows not only consistency between your environment recognition and entry decisions but also a more three-dimensional view of the market’s rhythm itself.
Three advantages WVM provides
- A framework for environmental recognition: The “current position” of the wave becomes easier to understand
- Visualized multi-timeframe alignment: It’s easier to confirm whether the upper and lower waves align
- Enhanced discretionary judgment: Subjective wave interpretation gains objectivity through the tool
First, learn the “types” of waves
In the second installment, WVM will show howit draws wave coherence across timeframeswith actual chart examples.
We’ll deliver tips to turn wave analysis into a more reliable weapon.
Visualizing waveswill bring a new perspective to trading.
Please take a step toward capturing the market’s rhythm with this new approach.