

"Peerless" Synchro System Usage Guide / Roles of Each Configuration Indicator ① - Ultimate Synchro Band & MAX Oscillator
■Ultimate Synchronization Band
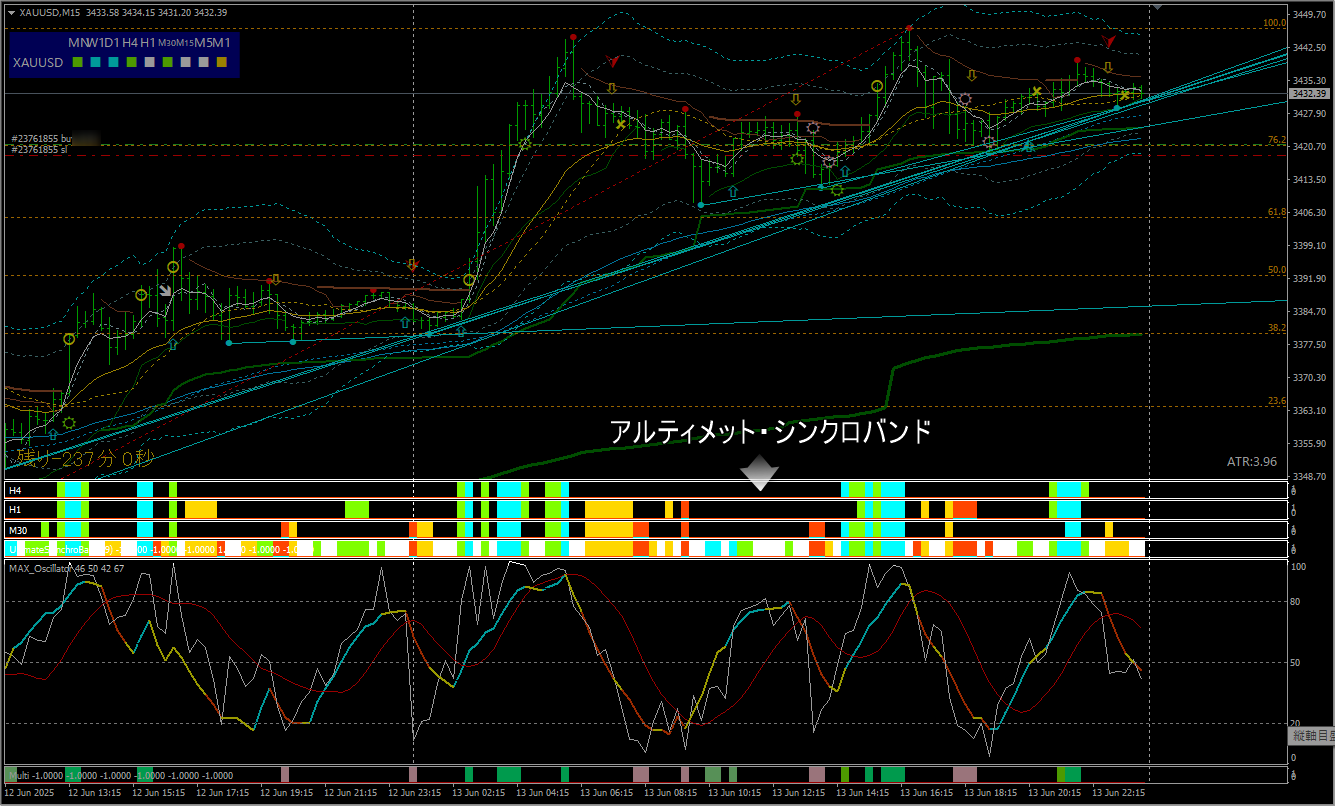
Refers to the bands of color on the oscillator window that line up in order.
■Function 1
Indicates the direction, strength, and consolidation of price movement for that time frame using colors
■Light blue・strong rise■Green・weak rise
■Red・strong decline■Yellow・weak decline
□White・neutral (consolidation or correction)
■Function 2
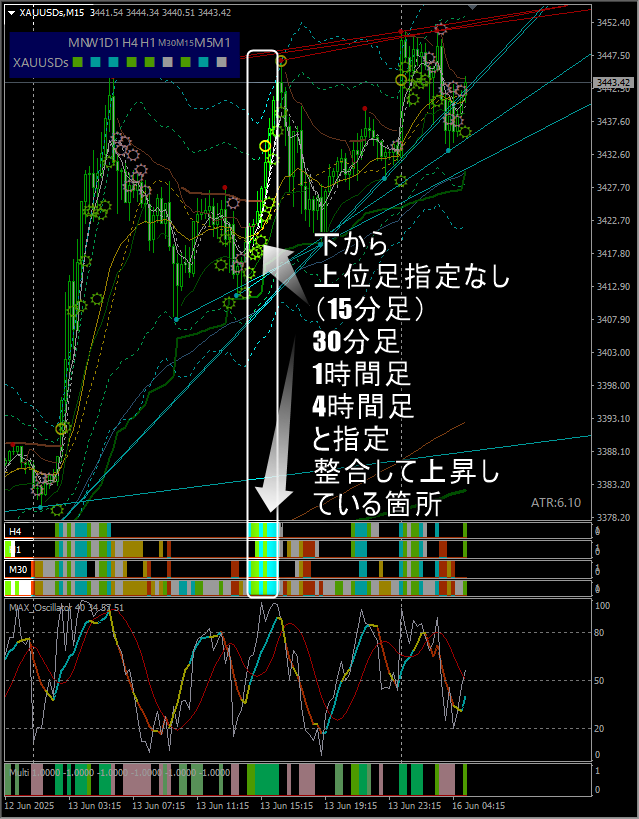
By lining up the bands and specifying the higher-timeframe,it shows the alignment or misalignment with price movements on multiple higher timeframes
※This makes it possible to
A) make it easier to decide whether to hold or take profit
B) see a breakout from a consolidation
(when the timeframes were not aligned, they align, making breakouts easier)
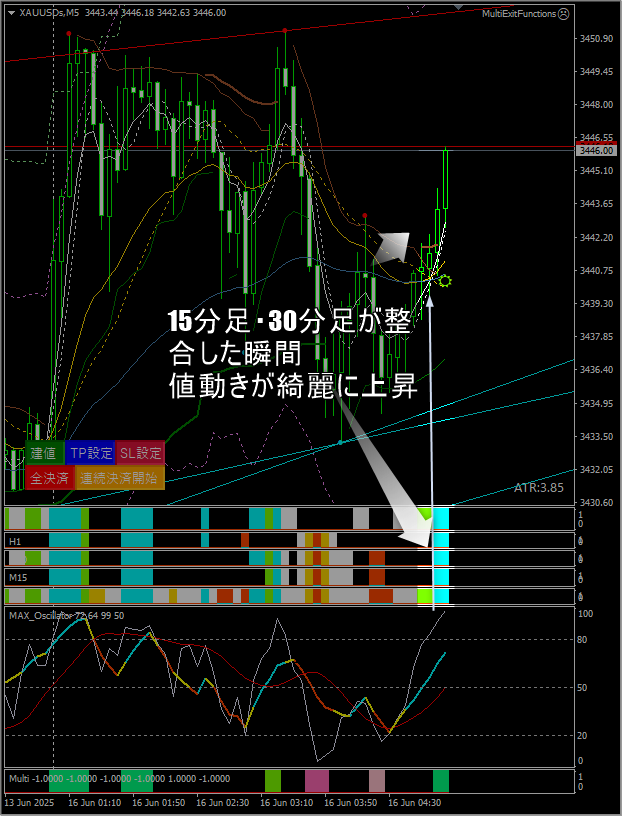
Also, notablywith high-timeframe alignment, strong synchronization (light bluered) tends to produce a strong one-way price move
① Entry becomes more certain
② In continuation or re-entry continuation, you can hold positions with confidence
③ Relatively early, you can place a stop and move it to the favorable price, reducing risk.
■Weakness
The start and end of waves, or when synchronization is likely, cannot be determined by the synchronization band alone.
■Countermeasures
Next, introducedMAX Oscillator will compensate for that weakness.
■MAX Oscillator
Three lines provide the following information.
① For the time frame you are watching, the peaks and troughs, direction, continuation, and turning points
② Strength of price movement
Meaning of the three lines
① MAX Oscillator itself (thick line colored red, yellow, blue)
Indicates the general direction of the wave
Blue・RisingYellow・Observing (consolidation or consolidation)Red・Falling
② W%R Williams Percent Range (white line)
Shows the direction of the price movement’s extreme
③ Unique Stochastic setting
Indicates the upper/lower pressure and direction of the wave depending on its position relative to W%R.
Example・① blue, ② above ③ and ② direction upward ⇒ price movement rising
① red, ② below ③ and ② direction downward ⇒ price movement falling
Otherwise, observe
■How to read price movement strength
White line ② breaks above the other two lines and points upward (strong rise)
White line ② breaks below the other two lines and points downward (strong decline)
※When White line ② is sandwiched between the other two lines, it tends to be in a volatile consolidation state
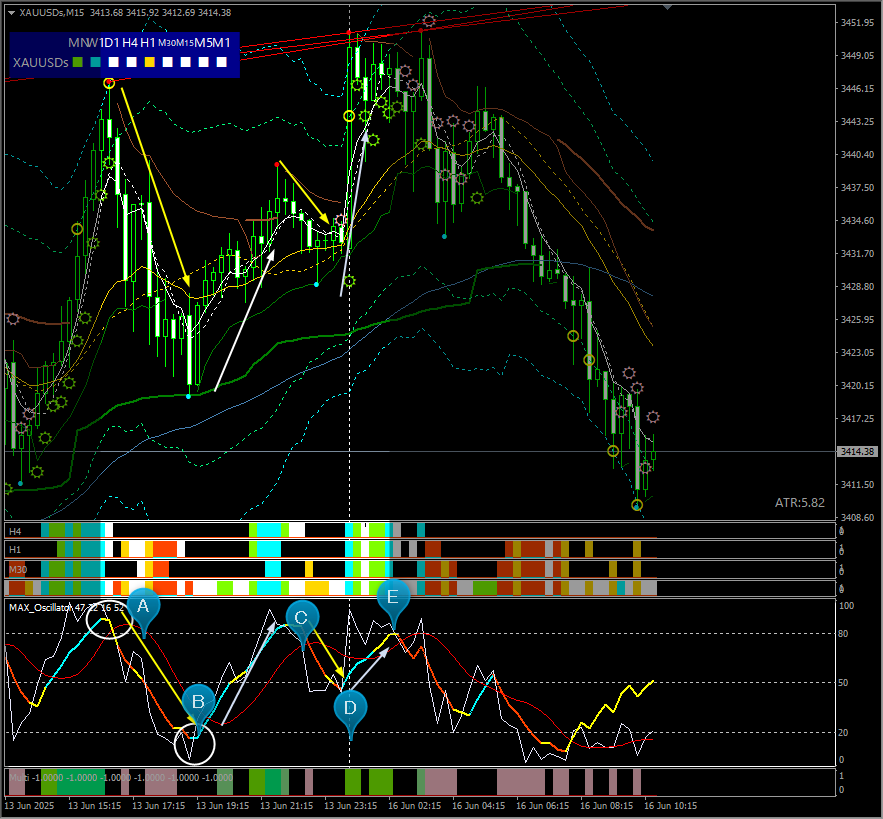
Example・ EURUSD 5-minute chart
At point A,White line is sandwiched between the other two lines and is in a consolidation state.
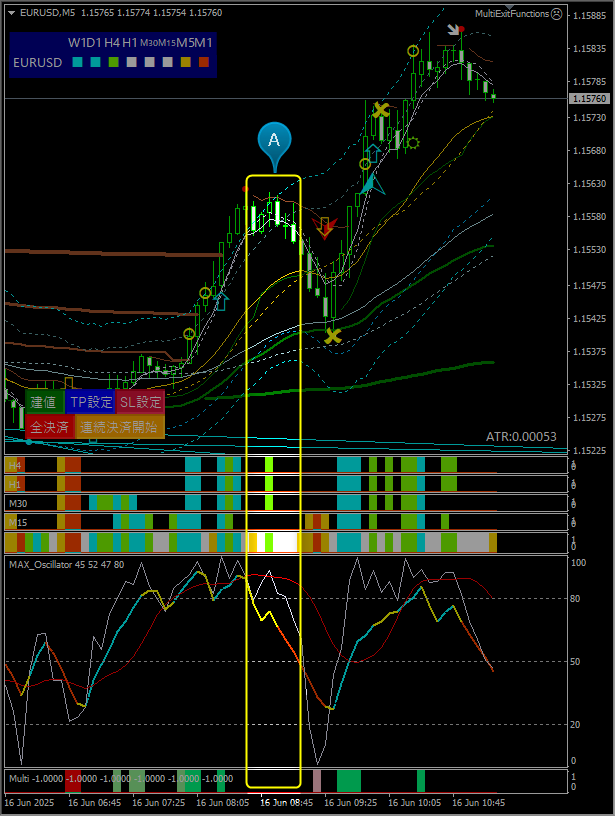
This MAX Oscillator and Synchronization Band together allow exact judgment of price movement state.
■Recommended entry method
Especially for day trading, this method is recommended.
2MA crossing & Synchronization Band + Higher-timeframe alignment
Enter at “start”
Detailed steps
(In an uptrend)
① EMA5 and EMA20 golden cross (cross upward)
② The synchronization band of that time frame aligns with the higher timeframe and lights an up signal
③ MAX Oscillator also shows an up move
⇒ Long entry
(In a downtrend)
① EMA5 and EMA20 cross deadly (cross downward)
② The synchronization band of that time frame aligns with the higher timeframe and lights a down signal
③ MAX Oscillator also shows a down move
⇒ Short entry
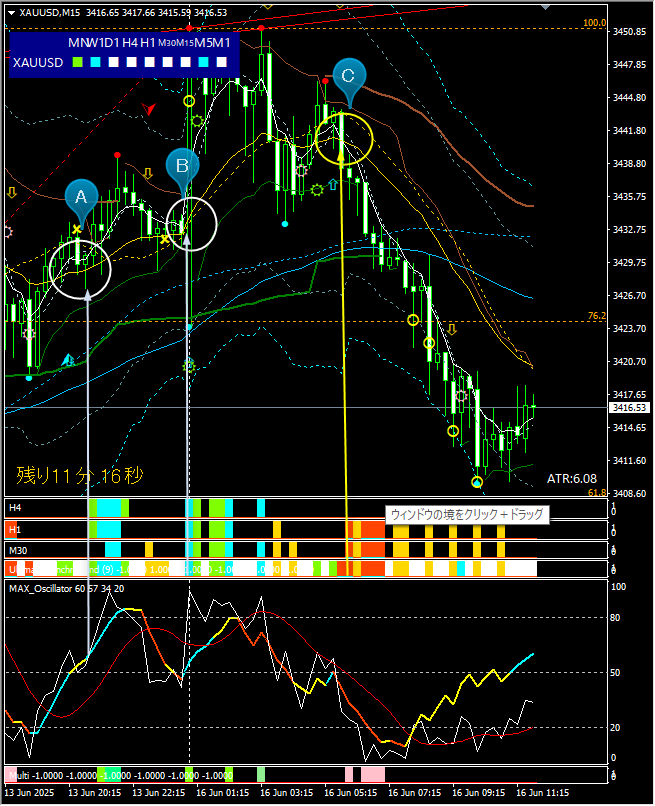
Example・ Gold 15-minute chart: buy at A or B, sell at C
■ Cautions
① Even if two MAs cross golden or dead,
if the higher-timeframe Synchronization Band does not align and there is not much follow-through, retreat
② What timeframe should you use?
It can work with any timeframe, but1-minute and 5-minute timeframes tend to be noisier
※Personally,I mainly use 15-minute chart,and when timing is off or when riding a wave mid-way, I often use 1-minute or 5-minute charts
to enter under the same conditions.
■ About the Tenka Musou Synchronization System
Please see the following page
https://www.gogojungle.co.jp/tools/indicators/50319?via=users
■ About the video for this content
Please refer to the following YouTube video
https://youtu.be/6vNqjNGC_ng?si=gp385rwK9xGDVss9