
Why does it always advance while pausing, even in strong markets, part 2
Continuation of the article from the day before
There are two types of digestion (consumption/assimilation) of ⚪︎⚪︎⚪︎
Horizontal axis digestion and vertical axis digestion
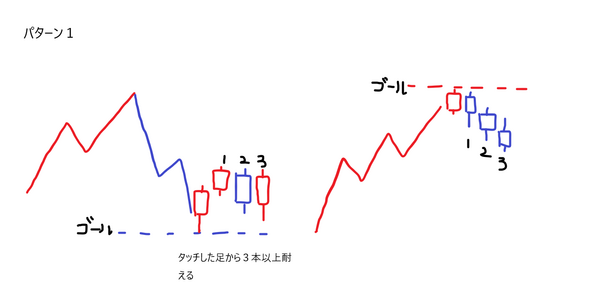
Horizontal axis digestion means that when a certain value (=⚪︎⚪︎⚪︎) is reached, some number of candlesticks cannot exceed that value
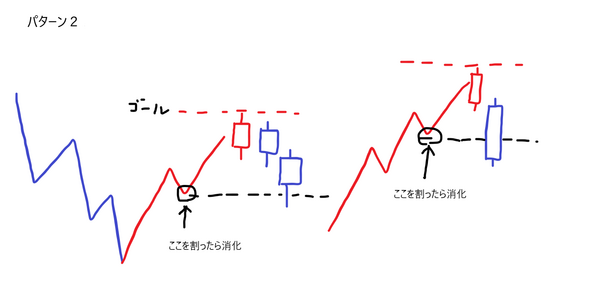
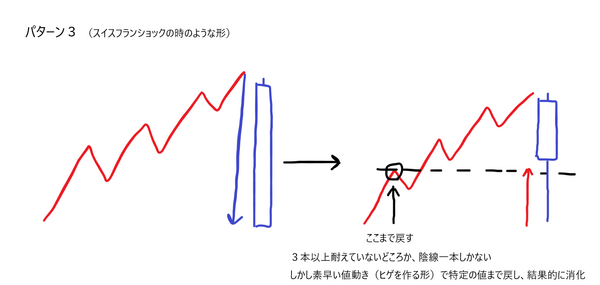
And vertical axis digestion means that when a certain value (=⚪︎⚪︎⚪︎) is reached, you must return to a certain value before you can move forward
Please actually look at the price movement of the Swiss franc shock on YouTube (the euro/franc)
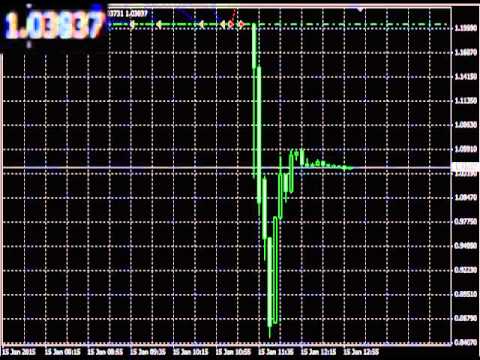
Multiple vertical moves can be seen before reaching the final value of 0.966 (around that level)
When the 1-minute chart reaches its goal, you return to a certain value and proceed
When the 5-minute chart reaches its goal, you return to a certain value and proceed
When the 1-hour chart reaches its goal, you return to a certain value and proceed
・
・
・
In this way, up to reaching the monthly candlestick level of ⚪︎⚪︎⚪︎,
the lower-timeframe ⚪︎⚪︎⚪︎ reaching, then continuing forward is repeated
The most important thing here is that you must set ⚪︎⚪︎⚪︎ yourself
For example, my settings for ⚪︎⚪︎⚪︎ are
On the horizontal axis, candlesticks cannot exceed 3 or more
On the vertical axis, there is a retreat back to a certain value
If neither of these conditions is satisfied, you cannot move forward — I make this a personal rule
Example
End
If any consultants have questions, feel free to ask anytime
Excerpt from Blog: Inside Information of a Full-Time Trader, April 8, 2024