

【Episode 02】RCI x 3 rods "double ceiling and double base", how is it? (Total 15 episodes)

What is "RCI Double Top and Double Bottom"?
Hello to those who enjoy every day with investing, those who deeply love investing, and those who want to make their dreams come true with investing!
We are the "Trezo" development team!
Now, let's quickly look at the chart“Double Top and Double Bottom”on the chart!
We would like to proceed, but...
First, RCI is not built into MT4 from the start.
So we prepared something like this first.


● The download destination will be introduced later!
From here, there are very important points when setting trading conditions.
First, let's review what RCI is and think about the base conditions.

What is RCI,
RCI = an oscillator that ranks "time" and "price" and quantifies their correlation
as an indicator.
And,
If it exceeds 80%, it is overbought; below -80% it is oversold
that’s the idea.

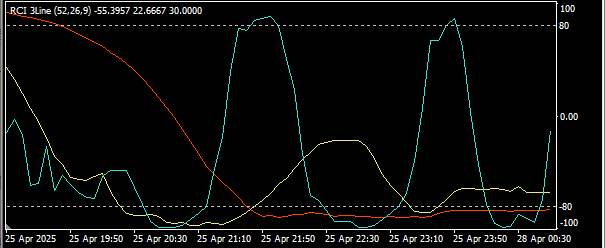
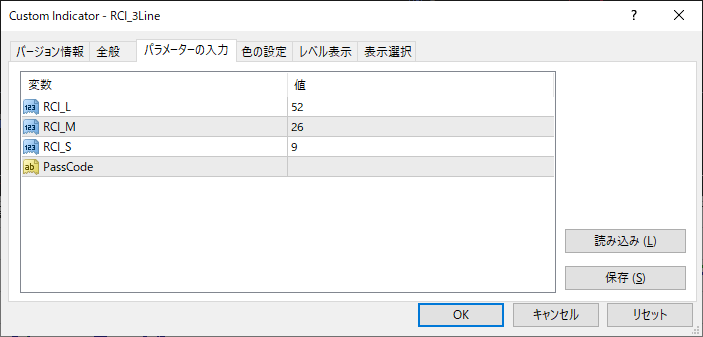
“Double Top and Double Bottom”isusing threeRCIs.The period (count) is often seen in the following combinations.
Long-term line = 52 (bars)
Medium-term line = 26 (bars)
Short-term base line = 9 (bars)
First, let's try this.

Next, what is a "Double Top and Double Bottom" like this?
Double Top =Among the three lines long-term, medium-term, and short-term,
the long-term line,the medium-term lineisupand clings to the upper side,the short-term base lineisdownand when the short-term line aligns again with the long-term and medium-term lines,
an entry upward (↑)
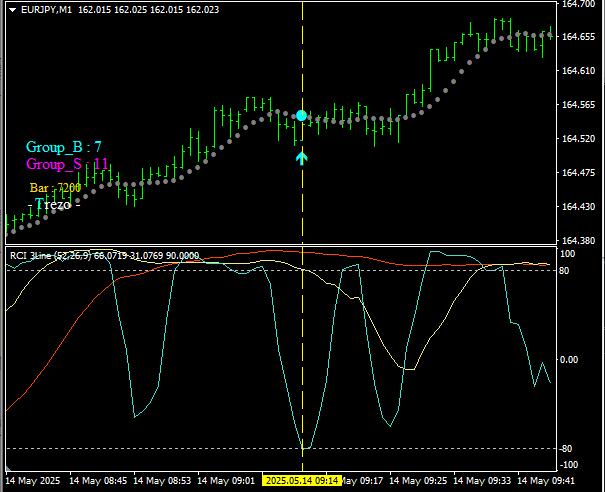

“Double Top” refers to the state shown in the image above.
The long-term line and medium-term line are up, while the short-term line is down.
“Since the long-term and medium-term lines indicate the trend, the short-term line will temporarily detach and then return upward. In other words, it is expected to rise again after this.”
That is the theory.
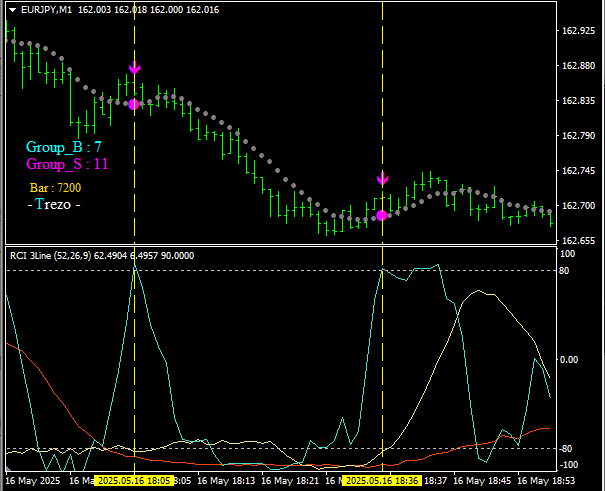

“Double Bottom” looks like this.
It is the reverse of the previous “Double Top.”
Double Bottom =Among the three lines long-term, medium-term, and short-term,
the long-term line,the medium-term lineisdownand clings to the lower side,the short-term base lineisupand when the short-term line aligns again with the long-term and medium-term lines,
an entry downward (↓)

Then,
we would like to set the following criteria for entries.
Buy = long-term line 80% or more, medium-term line 80% or more, short-term line -80% or less
Sell = long-term line -80% or less, medium-term line -80% or less, short-term line 80% or more
One important point here.
【!】The entry and exit conditionsshould be,“not vague”or“intuitively”“feel”orto be removed, and set as strictly as possible. In other words,quantified.
This is one of the aims we keep in mind when developing so that results do not vary greatly from user to user. We consider this very important.
Especially when developing an EA, there must be no ambiguous elements.
Even if it seems good, for example
Long-term 90%, Medium-term 85%, Short-term -79.8%
(Long-term OK, Medium-term OK, Short-term just misses)
Then Buy cannot be entered.
If you relax the conditions and trade and win, then next time you would further loosen the conditions, and once-set criteria would become increasingly uncertain.
If
Long-term 90%, Medium-term 85%, Short-term -79.8%
and you can always win, then the standard values should be
Long-term 80% or more, Medium-term 80% or more, Short-term -75% or less
Then, thisrule must be strictly followed.

Now that the entry conditions are decided, let's quickly look for points on the chart that meet the conditions!
But!
Gulp!
We notice something!
MT4 has drawn the three RCI lines, but finding “Double Top and Double Bottom” among them seems very difficult!
You might think, but when you look closely...
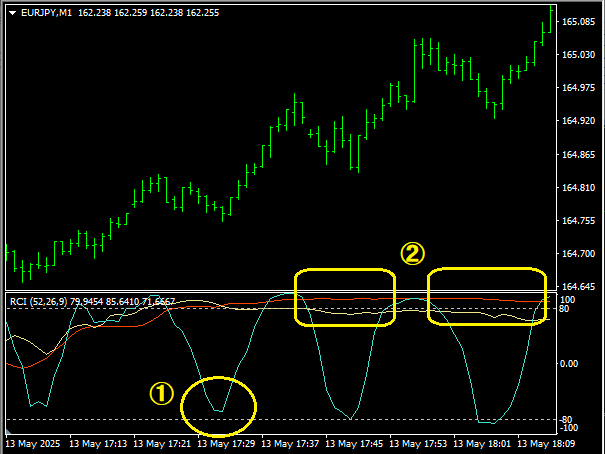
① The short-term line does not reach -80%
② The medium-term line does not reach 80%
There are many near misses like this...
It is very hard and inefficient to examine each point with one eye to find those that meet the criteria.

So!
We made a signal tool like this!
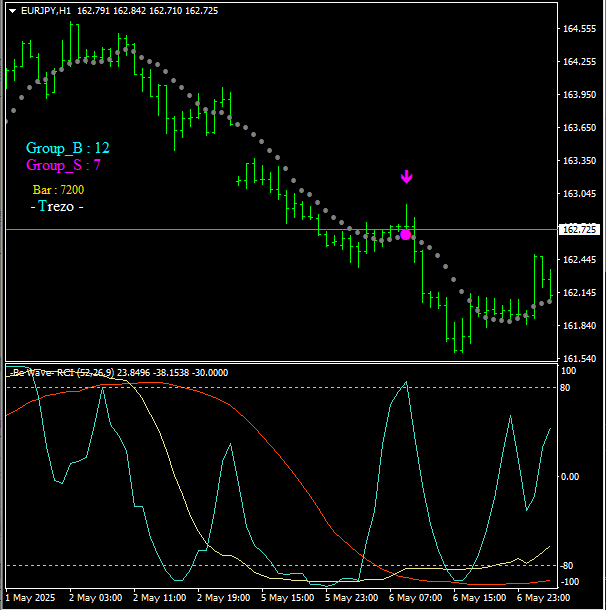
When all three lines long-term, medium-term, and short-term meet the conditions, it will emit a signal on the chart.
This means you no longer need to look at or display all three lines.
Next time, let's try using this!
This signal tool will also be introduced next time.
Of course, it is downloadable for free too!

This time, the indicator that displays RSI in three lines is introduced.
(Product ID: 62695)
|
RCI_3Line
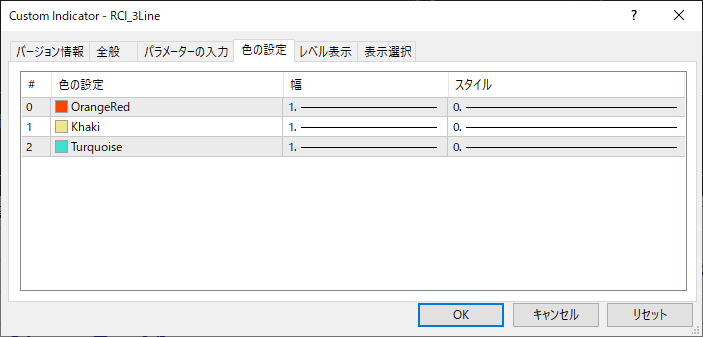
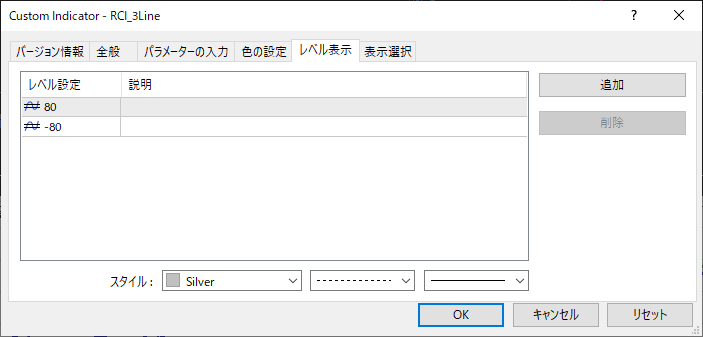
Parameters are as follows. Period (count) can be set for each. Colors can also be changed. Use your preferred combination! Levels and display can also be changed. ※ The three RCIs are calculated up to 7,200 bars. For recent validation, this number is sufficient. 【1-minute chart】= 5 days (7,200 bars = 60 bars × 24 hours × 5 days) 【5-minute chart】= 25 days (7,200 bars = 12 bars × 24 hours × 25 days) 【15-minute chart】= 75 days (7,200 bars = 4 bars × 24 hours × 75 days) |


Click here to download
 |
RCI_3Line The indicator introduced this time can be downloaded here. The number of bars is 7,200. |
 |
TopEarn (Top Earn) |