
【New Year First Trade】20190102 (Wed) Trade【Celebration】
Last time's article
Was the first trade of the new year as planned?
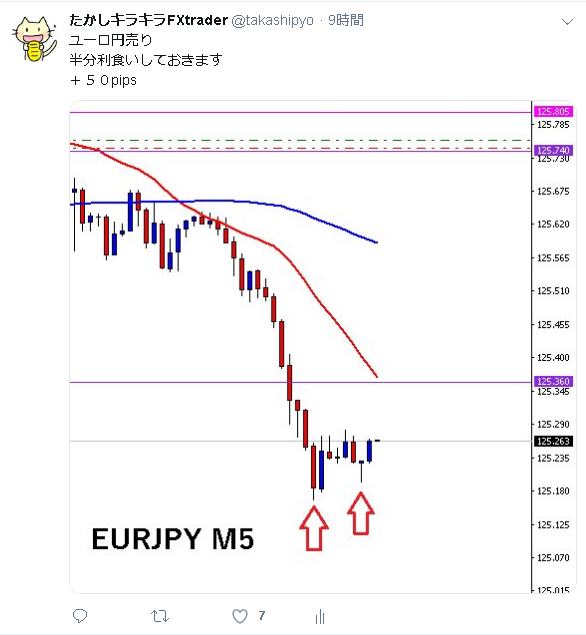
Sales of EUR/JPY began, in 2019
As the scenario predicted, it fell smoothly, and after confirming the rising low on the 5-minute chart, I took partial profit on half of the position.
+50 pips profit
I secured the profit reliably.
Tweet
The remaining half was taken as it trailed and hit take profit.
Tweet

The red dotted line is the stop order. Even if it bounces, the unrealized profit will be protected.
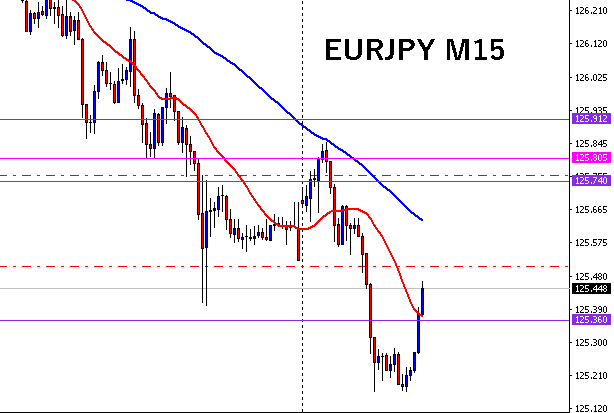
The stop order hit the red dotted line, and the remaining half was also taken profit.
+25 pips profit
Next, since GBP/JPY was also coming to the scenario point,I entered short.
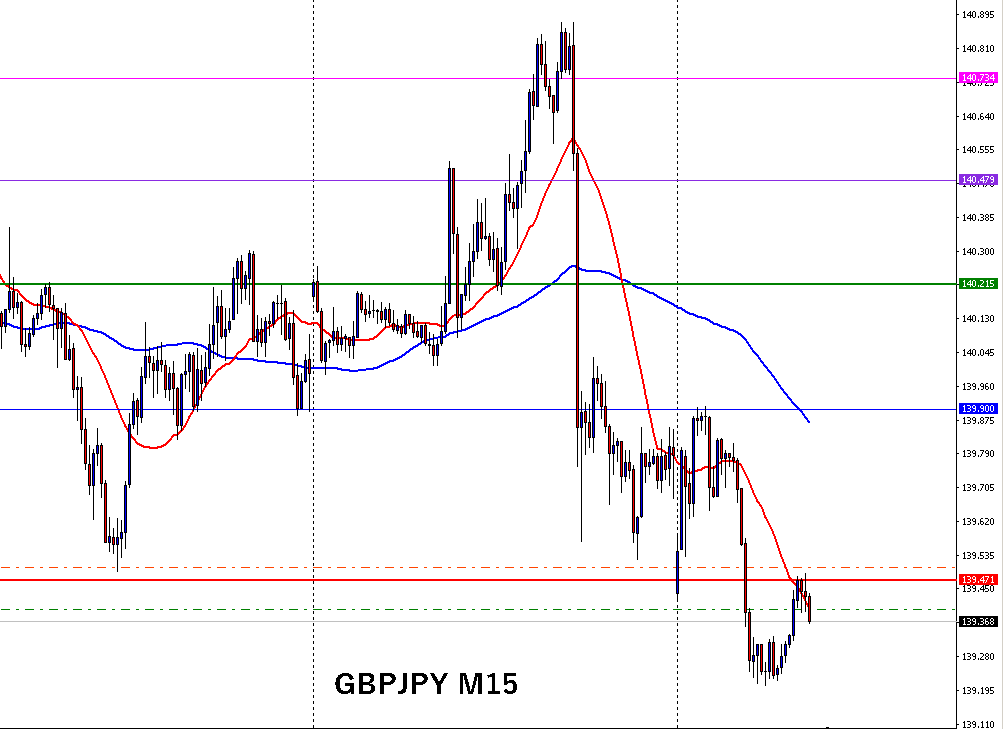
Stop loss is 10 pips, placed above the red line.
I posted in advance on the members' blog a selling scenario at the red line (139.471).
And it fell with great speed.
Tweet
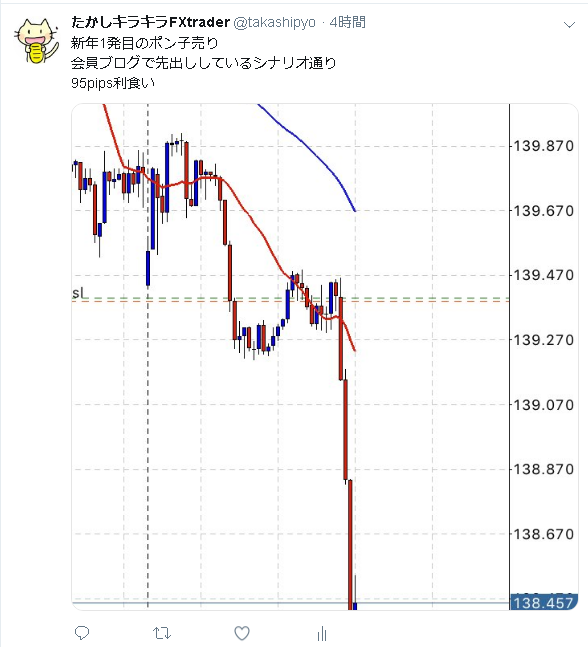
Since I entered and then went out, the chart image is a screenshot from my smartphone.
+95 pips profit
My favorite GBP/JPY first trade of the year went big as planned. I could take a large gain.
With a 10 pips risk, I captured 95 pips. It was a tasty move.
When stop loss is 10 pips, some are surprised by how small the loss limit is.
「With spreads included, is it that tight?」「Won't it stop out quickly?」
You may hear that, but of course it includes spreads.
Sometimes it stops out quickly, but not every time.
In this case, both EUR/JPY and GBP/JPY trades achieved profit without hitting a 10-pip stop loss, right?
The accuracy of the line and scenario is also important.
For GBP/JPY this time, I sold based on the red line and placed a stop above it.
The pre-drawn red line worked solidly.
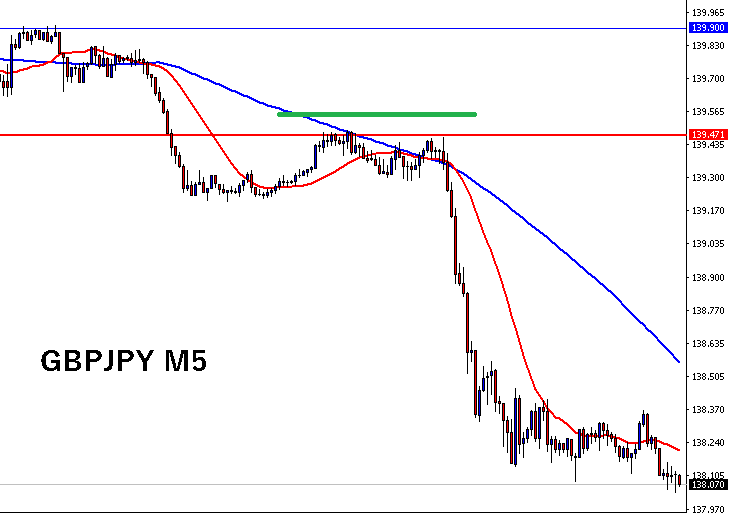
Because the red line was firmly effective, placing a stop above it did not trigger.
Whether you can draw this line in advance is crucial.
In the follow-up analysis,this line in advance is where I plan to selland post it on the members' blog.
There are also explanation videos on how to draw these lines and how to outline scenarios on the members' blog, so if you're curious, please subscribe and take a look.
Drafting a scenario in advance to sell when the price comes near this line (a plan), and posting it in advance,
then actually trading exactly as planned and showing it.
I think not many people can do this. (If there are, please tell me. I want to learn!)
The members' blog also features chart explanations.
20190102 EUR/USD chart analysis
This is not a rear-view analysis, but a forward analysis.
When people talk about analysis, they often explain which to buy or sell, i.e., entry analysis.
The above analysis suggests, “It’s better not to enter here.”
Tweet
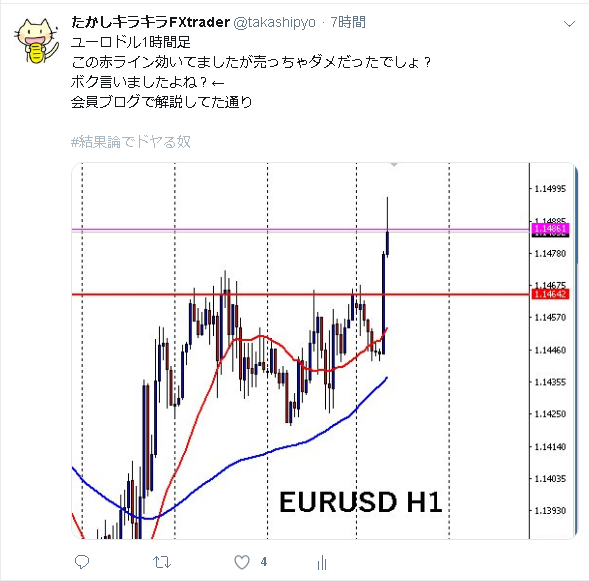
The red line seems to work well, but this is an explanation that you should not enter a sell near this red line.
Just because you can draw a line does not mean you should bet everything at the line.
Explaining why you should not enter at such lines is provided in advance.
After a chart forms, it’s easy to say later, “This is why you shouldn’t sell here.”
Therefore, I believe in forward-looking, not retroactive explanations.
For those who want to study that as well, please subscribe to the members' blog and read it repeatedly.
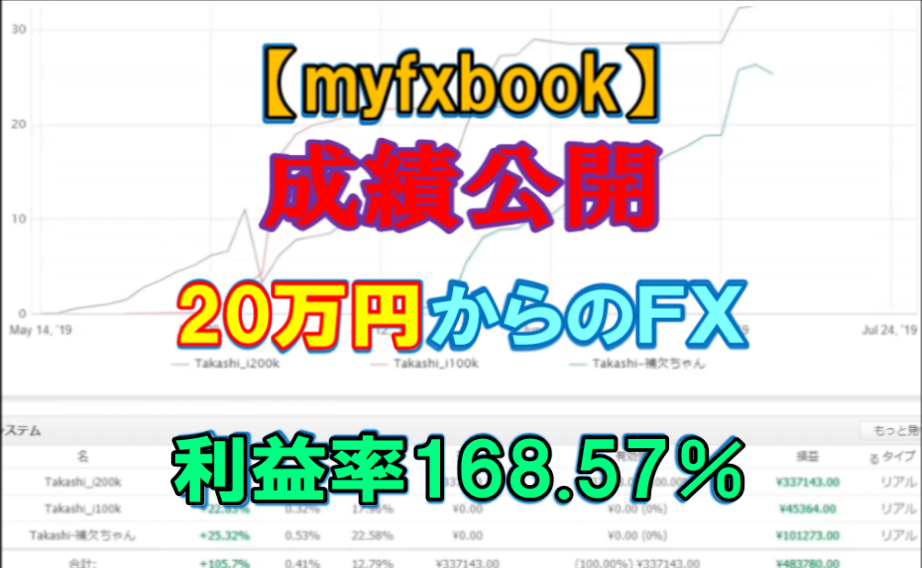
In 2019, the first trade of the new year proceeded as planned (pre-planned): EUR/JPY and GBP/JPY, making it a very good start. Thank you.
EUR/JPY +50 pips profit (half),+25 pips profit (half)
GBP/JPY+95 pips profit
I’m on Twitter:https://twitter.com/takashipyo
Trading videos are up:Trade that made 100,000 yen into 1,000,000 yen