
[Episode 08] RCI x 3 Standpoints: "Double Ceiling, Double Bottom" — How is it? (Total 15 episodes)
|
Please! If you are viewing this series for the first time, please be sure to start from Episode 1! We have included very important content in the early part, and this解説 (explanation) introducesIndicatorsandSign Tools,Tester EAare also available for free distribution! |

RCI "Double Top / Double Bottom"
Right now, Case: B is in season!
Hello!
And good evening!
We are the Trezo development team!
In the previous Episode 7, we learned that you can aim to increase effectiveness by setting the pair, timeframe, and market conditions accordingly.
To win and keep winning, verification is important, and we learned that trading with confidence is possible.
This time marks exactly the halfway point. From now on, we will continue to explain in an easy-to-understand way, using diagrams and tools!
Next time (Episode 9), we will again give away a tool for free that you can use in practice!!
Stay tuned!
To use that tool correctly and effectively, this is a very important episode!
Especially the latter half!
Now, let's watch together and enjoy!

Let's first look at the previous-to-last Episode (end of Episode 6) about AUDUSD, M1, and downward trend!
(Sorry for jumping around the episodes, because this contains very important content, I wanted to take my time...)
Default Settings
■ 1 year / Lots: 0.01 (minimum lot)
■ Pairs: AUDUSD ■ Timeframe: 1 minute
■ Maximum number of positions: 1 (two when hedging)
■ RCI acquisition lines (all standard values): Long-term 80%, Mid-term 80%, Short-term -80%
■ Settlement conditions: When opposite position is acquired
■ Settlement options: No DeMarker, no trailing stop
■ Mode: Case A (Trend)
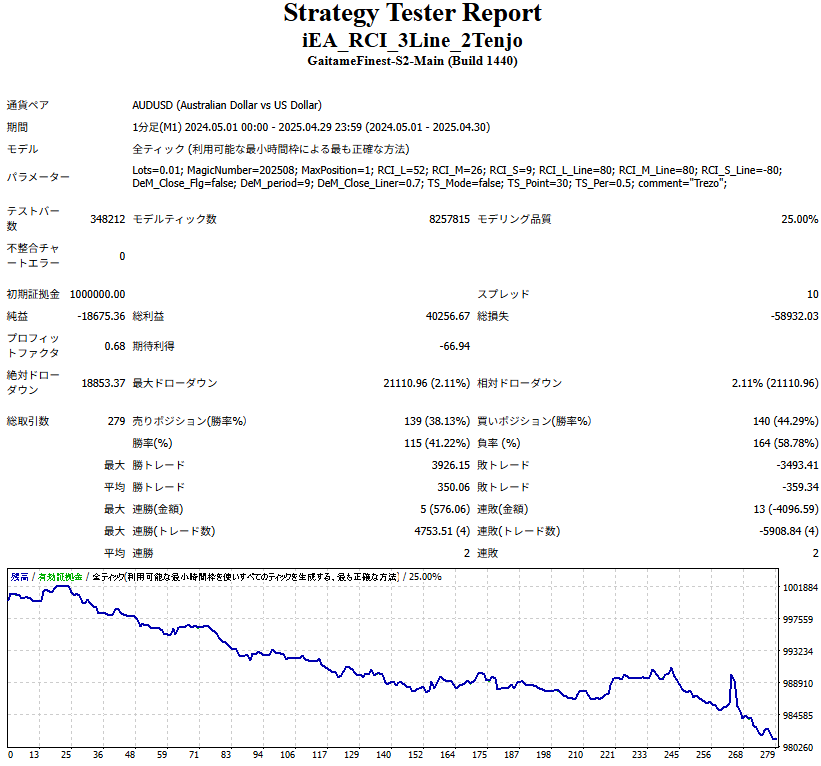
We tested by default.
As initially expected, when a “Double Top” appeared, we entered a Buy position, and when a “Double Bottom” appeared, we entered a Sell position, aiming for a trend direction guided by the long-term and mid-term lines. ... [Case: A (Trend)]
However, unfortunately we could not win here.
Then, somehow we noticed a clean downward trend!

We immediately test the “Double Top” as Sell, and “Double Bottom” as Buy. It is a completely opposite entry.
■ 1 year / Lots: 0.01 (minimum lot)
■ Pairs: AUDUSD ■ Timeframe: 1 minute
Change
■ Mode: Case B (Reversal)
Only
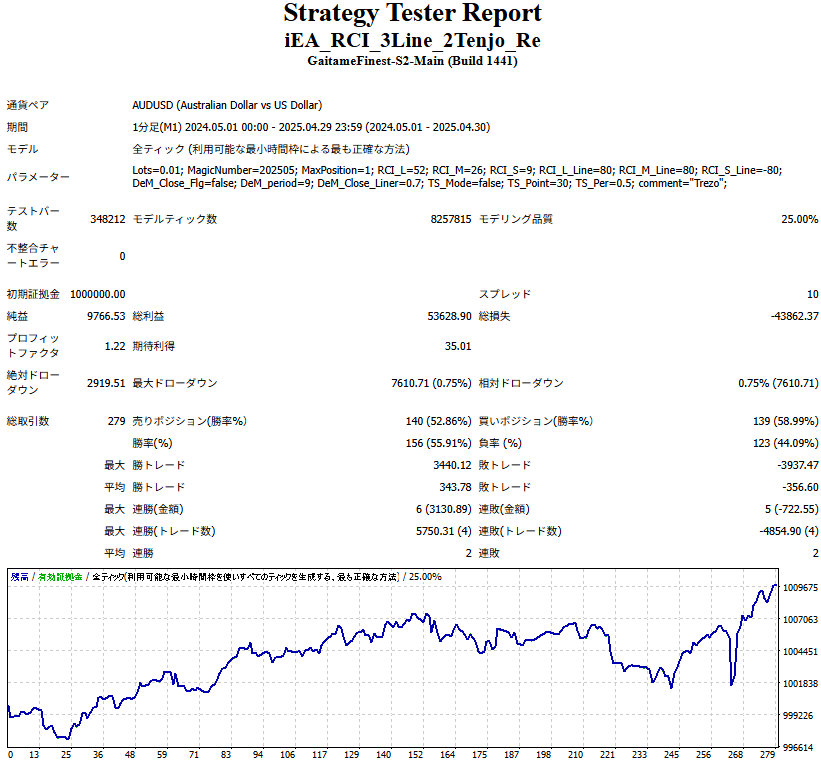
The result is not a perfect upward-right trend, but it turned out clearly positive!
The aim was successful!
The difference from the two above is only whether you traded with Case A (Trend) or Case B (Reversal).
All parameter values are defaults.
This time, for Case A (Trend), we showed that when a regular downward-right trend is visible, Case B (Reversal) can be effective, so we left all settings at defaults.
By changing the settings or combining other settlement methods, it seems you can win even more!

From now on, we will look more closely at Case B (Reversal), but there are important points we want to convey.
Knowing what we will explain next will help you trade with confidence and further enhance effectiveness when aiming for Case B (Reversal)!
This is a very simple principle. I want you to understand why Case B (Reversal) appears frequently.
Now, here we go.
The next two images are examples of winning with Case A (Trend).


After the "Double Top" signal, price returns to the trend and rises.
Next, similarly after "Double Bottom," it returns to the original trend direction and wins.

After the signal, the long-term and mid-term lines are drawn as if, and the short-term line resonates again. The price movement after the signal is solid, a winning pattern.
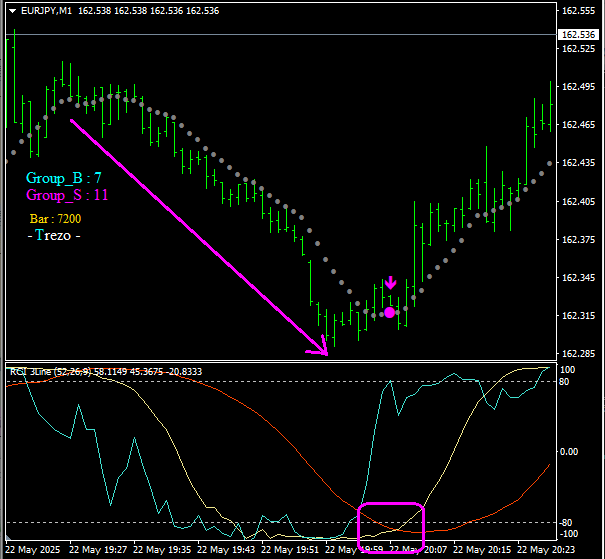
However, in the next example, when the same "Double Bottom" signal appeared, we entered a Sell position, but the price moved in the opposite direction and we lost.
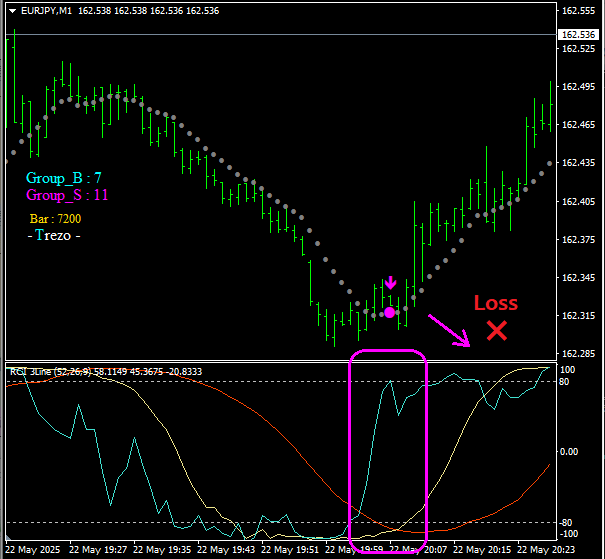
Why does this happen?
In the first place, the terms "Double Top" and "Double Bottom" occur when the price continues to move in roughly the same direction for a certain period, i.e., a trend is forming.Look at what happens next. Before the signal, price movement continues in the same direction.

In particular, the long-term line is set to 52 bars, so it is quite a slow-moving indicator.
If this state does not continue to some extent, the sub-chart's □ in the lower area will not cause the long-term and mid-term lines to stay low.
And there is one more case after the signal: Case C (Sideways). After the signal, price movement stops and nearly stagnates, but this case is very rare.
Why is that?
If price movement in the same direction continues for a while,
this RCI oscillator is“overbought”,“oversold”
is an indicator to observe, so when "Double Top/Double Bottom" appears,“oversold continues” or“overbought continues”state is said.
Thereafter, a strong trend may continue, or of course, a reversal often occurs, and in reversals price may move sharply to settle debts of the past.
This is a big loss pattern when initially entering with Case A (Trend).
Why do Case B (Reversal) occur relatively frequently, and why does price move strongly in the opposite direction in those cases? You may have understood. For Case A (Trend) assume Case B (Reversal) with caution; and when aiming for Case B (Reversal), keep Case A (Trend) in mind for safer and more effective trading.

【Point!】
Actually, while conducting various verifications, I noticed a big fact.
When testing across several currency pairs on a 1-minute chart, for many years up to the recent months to a year or two, the conventional theory of Double Top/Double Bottom allowed winning with Case A (Trend).
However, that conventional wisdom seems to be shifting little by little.
(For reference)
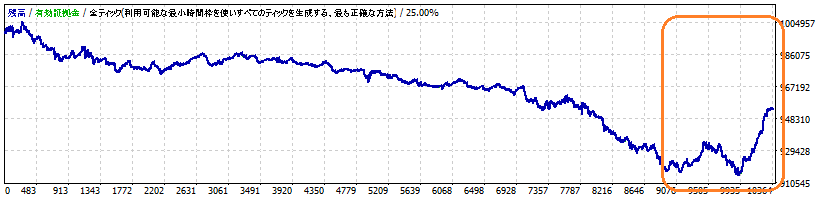
We did this kind of test.
1-minute chartfor10 years. Until about 1-2 years ago, Case A (Trend) was winning, but recently Case B (Reversal) has become more dominant.
■ Period: 10 years
■ Timeframe: 1-minute
■ Mode: Case B (Reversal)
【Currency Pair 1】
We also tested other major currency pairs.
【Currency Pair 2】

When trading using Double Top/Double Bottom, if you only know Case A (Trend), you could win in the past, but recently you also need to be aware of Case B (Reversal).
【Currency Pair 3】
In the first place, conventional wisdom is formed when the same method continues for a long time. It does not appear suddenly, but becomes conventional (method) because you have been winning the same way for a long time.
【Currency Pair 4】

【Currency Pair 5】
Of course, there are times when Case A (Trend) can win, and times when it can lose.
Similarly, there will be wins and losses for Case B (Reversal). The key is what you do next, but in the next episode we will introduce several test results for Case B (Reversal) and explain them.
"Two-Sword Style"
Next time, we will also distribute the tester EA for Case B (Reversal) for free without operation!

Also, if you would like to use the EA we developed, we'd be glad. -Click the image!-
 |
 |
 |
||
CHFJPY -M15- |
EURUSD -M5- |
GBPCHF -M15- |
||