

【Episode 05】RCI x 3 “Double Ceiling / Double Bottom”: How about it? (Total 15 episodes)
|
Please! If you are viewing this serialized article for the first time, please be sure to start from “Episode 1”! We have included very important points in the first half, and this article mentionsthe IndicatorsandSignal Tools,Tester EAalso offered for free distribution! |

RCI “Double Top, Double Bottom”
Tester EA Start!
Hello, and good evening!
We are the development team of “Trezo”!
First of all...
If you have forgotten the keywords for [Case: A (Trend)] and[Case: A (Trend)][Case: B (Reversal)], or if you have not yet seen an explanation about this, please be sure to read the previous “Episode 4”!
This time, [Case: A (Trend)] and[Case: A (Trend)][Case: B (Reversal)]will become fairly important words.

Until last time, we only looked at “EURJPY,” “1-minute chart,” and “Bar: 7,200 bars,” butthe basics of “Double Top and Double Bottom”could be learned.
And now, the Tester EA finally makes its entrance!
Let's leverage the system to broaden our view and conduct verification!
It feels like we are gradually approaching the location of a treasure chest!
First of all, keep a broad perspective!
Now, we will immediately expand the scope a little and proceed with verification.
Other currency pairs, timeframes, and the period to be tested.
First, please take a look at this.
This is the Tester EA that we will use from now on!
You can also use this. The download source will be provided a little later.

For now, whether to go with one position or to allow additional positions—our priority is to verify the effectiveness of this method rather than to win, so we will trade with a single side“one position”only.
The lot size will be the minimum,“0.01”.
Next, we would like to consider the exit criteria. There are many criteria we could try, but in the early stages of validating effectiveness, we often do something like this.
“Exit when the opposite signal appears”
We will hold the position until that happens.
We have built the tester so that such things can be done, so let's start with this!
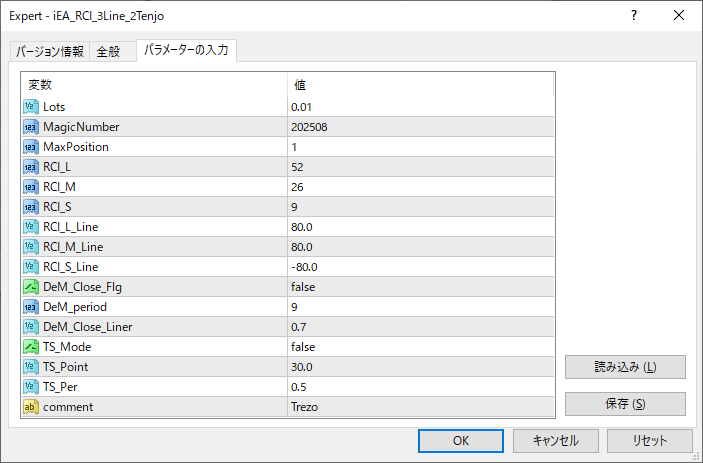
[Acquisition Conditions]
| “Double Top” = Acquire Buy position “Double Bottom” = Acquire Sell position |
Double Top (Buy) = RCI: Long-term line 80% or higher, mid-term line 80% or higher, short-term line 80% or lower
Double Bottom (Sell) = RCI: Long-term line 80% or lower, mid-term line 80% or lower, short-term line 80% or higher
※ Sell criteria line is automatically set as the inverse of the Buy line.
【Position Addition Criteria】
| Do not add positions while already holding a position |
【Exit Criteria】
| 【Point!】 Exit when the opposite position acquisition signal appears Buy position exit condition = “Double Bottom” Sell position exit condition = “Double Top” |
Buy position exit condition = executed simultaneously with Sell position acquisition
Sell position exit condition = executed simultaneously with Buy position acquisition
This means we will always hold one of the positions.
【!】Another important thing!
Initially, we tested under the assumption that after Double Top/Bottom, the price would return to the trend direction. However, we found that returning to the trend direction is not the only possibility; in addition to Case: A (Trend), there are signals that move in the opposite direction, known asCase: A (Trend)【Case: B (Reversal)】as well. And there were surprisingly many of these.In number, Case: A (Trend) is somewhat more frequent, but not by much, and there were occasions where the price moved sharply due to reversals.(Case: C (Sideways) occurs infrequently and does not much affect profit or loss, so we will not consider it here.)In short, this test aims to verify the effectiveness of the method “After Double Top/Bottom, return to the trend direction,” and also to【Case: A (Trend)] vs 【Case: B (Reversal)]battle for dominance. If one of these becomes strongly biased, the method could be adopted as a viable approach.Of course, the results are not universal—they depend on the currency pair tested, the timeframe, and the period. Different pairs move in different ways, and results can change with time. It is important to use a method suited to the environment to efficiently profit from the right currency pair and timeframe. Please try using the Tester EA to uncover the treasure chest!For now, rather than examining each data point in detail, compare the top graph with the others below. You will understand what is important!■■■ 1 year EURJPY M1 Position count: 1 ※ Exits only when the opposite position is acquiredWe started with a basic form for testing.We will try many variations from here.■ 1 year EURJPY M1 Position count: 1 ※ Trailing stop used■ 1 year EURJPY M1 Position count: unlimited ※ DeMarker used in exit criteria■ 1 year EURJPY M1 Position count: unlimited■ 1 year EURJPY M1 Position count: unlimited, each position uses trailing stop【Point!①】Note that the graphs do not differ much whether you exit only when the opposite position is acquired or you use various exit methods.“The first half trends downward, then a dip near the center, then a little profit is returned, and the end tends to fall again.”Rather than thinking about exit methods from the start, we first learn the tendency and then, in the next stage, try more effective exit methods.There are not many examples where a big drawdown graph turned dramatically profitable with a single exit method.From this, it is also very meaningful to decide exit methods to suit profitability, win rate, and safety, which are important themes.And, as always, the timing of acquisition becomes crucial.【Point!②】This time, unlike the initial expectation, Case: B (Reversal) turned out to be more favorable. Incorrect information or assumptions often cause losses.It is also important to verify again, and over time the method may stop working. Sometimes verification is essential.Of course, there are currency pairs that will utterly dominate Case: A (Trend). Whether it turns profitable or not, if a tendency (a certain slope) shows up as in this case, the opportunity for profit becomes evident.【Point!③】Of the five, the second and the fifth show a relatively strong upward trend, even amid fluctuations. Is this currency pair’s chart suited for trailing stop, or is multiple positions effective?If Case: B (Reversal) stands out as dominant from the start, perhaps breakouts could be profitable. Let's verify that in a future episode as well.Next time, we will test with different currency pairs, timeframes, and periods to widen the range and depth. We will learn more then, and I look forward to the next episode!iEA_RCI_3Line_2TenjoFrom here you can download the Tester EA introduced in this article.Only for demo accounts.TopEarn (Top Earn)EURJPY -M15-High win rate! A trustworthy talent!TopEarn (Top Earn) version for EURJPY.Also a big gift!
(Case: C (Sideways) occurs infrequently and does not much affect profit or loss, so we will not consider it here.)
In short, this test aims to verify the effectiveness of the method “After Double Top/Bottom, return to the trend direction,” and also to【Case: A (Trend)] vs 【Case: B (Reversal)]battle for dominance. If one of these becomes strongly biased, the method could be adopted as a viable approach.
Of course, the results are not universal—they depend on the currency pair tested, the timeframe, and the period. Different pairs move in different ways, and results can change with time. It is important to use a method suited to the environment to efficiently profit from the right currency pair and timeframe. Please try using the Tester EA to uncover the treasure chest!

For now, rather than examining each data point in detail, compare the top graph with the others below. You will understand what is important!
■■■ 1 year EURJPY M1 Position count: 1 ※ Exits only when the opposite position is acquired

We started with a basic form for testing.
We will try many variations from here.

■ 1 year EURJPY M1 Position count: 1 ※ Trailing stop used

■ 1 year EURJPY M1 Position count: unlimited ※ DeMarker used in exit criteria

■ 1 year EURJPY M1 Position count: unlimited

■ 1 year EURJPY M1 Position count: unlimited, each position uses trailing stop

【Point!①】
Note that the graphs do not differ much whether you exit only when the opposite position is acquired or you use various exit methods.
“The first half trends downward, then a dip near the center, then a little profit is returned, and the end tends to fall again.”
Rather than thinking about exit methods from the start, we first learn the tendency and then, in the next stage, try more effective exit methods.
There are not many examples where a big drawdown graph turned dramatically profitable with a single exit method.
From this, it is also very meaningful to decide exit methods to suit profitability, win rate, and safety, which are important themes.
And, as always, the timing of acquisition becomes crucial.
【Point!②】
This time, unlike the initial expectation, Case: B (Reversal) turned out to be more favorable. Incorrect information or assumptions often cause losses.
It is also important to verify again, and over time the method may stop working. Sometimes verification is essential.
Of course, there are currency pairs that will utterly dominate Case: A (Trend). Whether it turns profitable or not, if a tendency (a certain slope) shows up as in this case, the opportunity for profit becomes evident.
【Point!③】
Of the five, the second and the fifth show a relatively strong upward trend, even amid fluctuations. Is this currency pair’s chart suited for trailing stop, or is multiple positions effective?
If Case: B (Reversal) stands out as dominant from the start, perhaps breakouts could be profitable. Let's verify that in a future episode as well.
Next time, we will test with different currency pairs, timeframes, and periods to widen the range and depth. We will learn more then, and I look forward to the next episode!
 |
iEA_RCI_3Line_2Tenjo From here you can download the Tester EA introduced in this article. Only for demo accounts. |
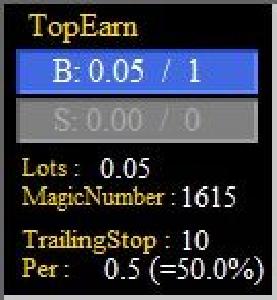 |
TopEarn (Top Earn) |