

【Episode 04】RCI x 3 rods "Double Ceiling, Double Base", how about it? (All 15 episodes)
|
Please! / Request! If you are viewing this serialized article for the first time, please be sure to start from “Part 1”! We also include very important content in the front section, and in this explanation you will findIndicatorsorSignal tools,Tester EAalso available for free distribution! |

RCI “Double Top / Double Bottom”
Investigation starts!
Hello!
We are the Trezo development team!
This time, we will explain what we learned from the previous results.
We had only tested EURJPY and 1-minute charts so far, but so far it did not look like a long winning streak with consecutive wins and big gains.
First, we will explain when the “Double Top / Double Bottom” appears, as we have understood from this.
Actually, this is very important!
There were two main patterns.
First one.
【Case: A】There is a trend, and price moves temporarily in the opposite direction to the trend,
→After that, price moves againin the trend direction.
In the first place, the purpose of “Double Top / Double Bottom” is to target this kind of trade method.
(Note: A trend means price continues in the same direction)
And here is the other one!
【Case: B】There is a trend, and price moves temporarily in the opposite direction to the trend,
(Until now, same as before)
→After that, price reverses back in the opposite direction to the trend. In other wordsreversal.
When counting the occurrences, it turned out that this Case B occurs not rarely but quite often.
From the original aim, this is a losing pattern.
Since the Double Top / Double Bottom occurs when price moves in the same direction for a certain period, after a signal the price almost never stops moving and tends to move in one direction.
Still, although infrequent, Case C where the price rate stagnates after a signal also occurred.
This does not have much impact on profit and loss, so from here we will not consider Case C (stagnation) and will focus on Case A (trend) and Case B (reversal).

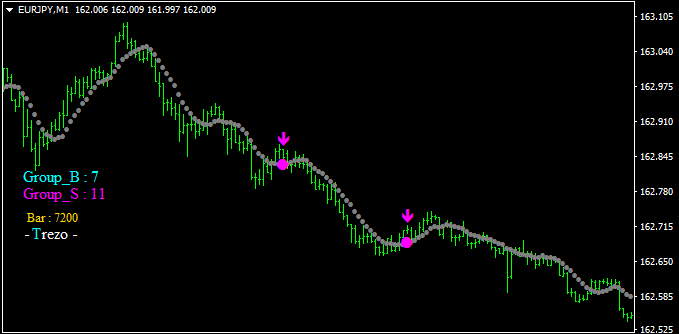
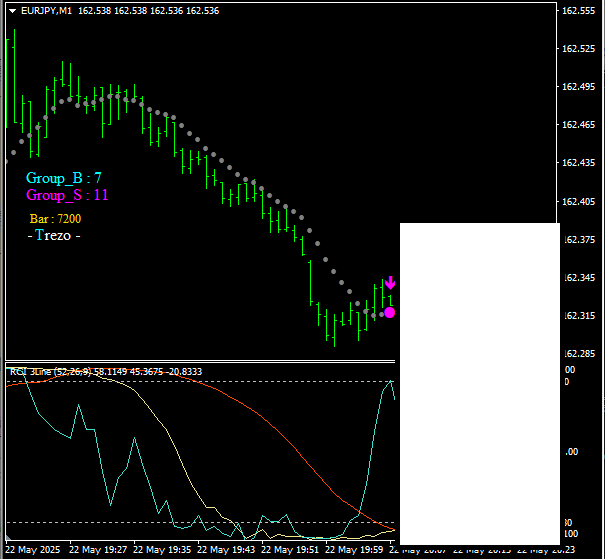
Now, let’s take a closer look at Case B (reversal), which did not match our initial expectation.
In this kind of case, what would happen next?
Please try to predict what happens after this.
After the signal, does it seem like it will develop into Case A (trend)?
Is it because the previous three RCI lines are nicely moving downward and forming a trend?
Or is it because at that point the rate is located lower on the main chart (around 162.3 yen)?
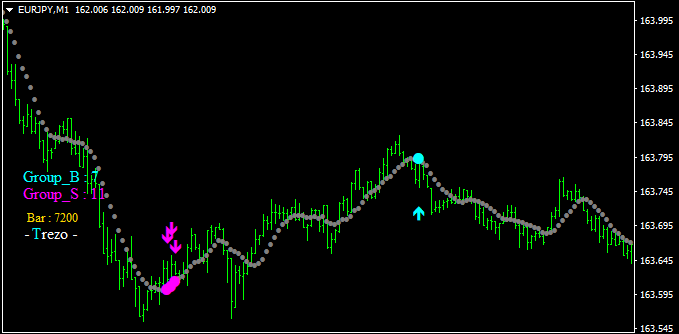
The result was as follows.
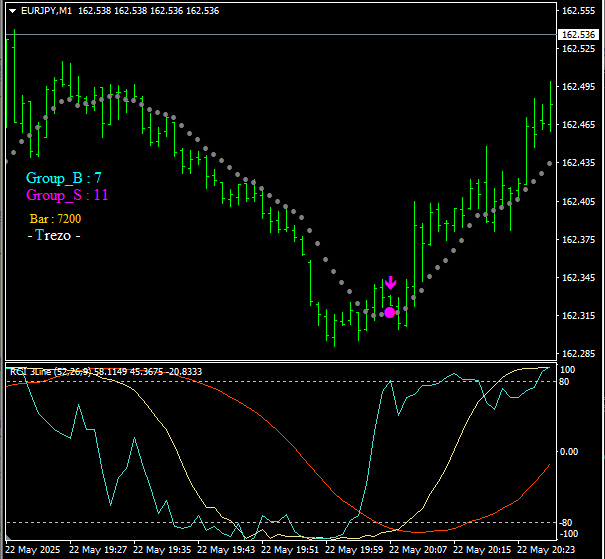
This time it was Case B (reversal).
Three RCIs moved in the following motion.
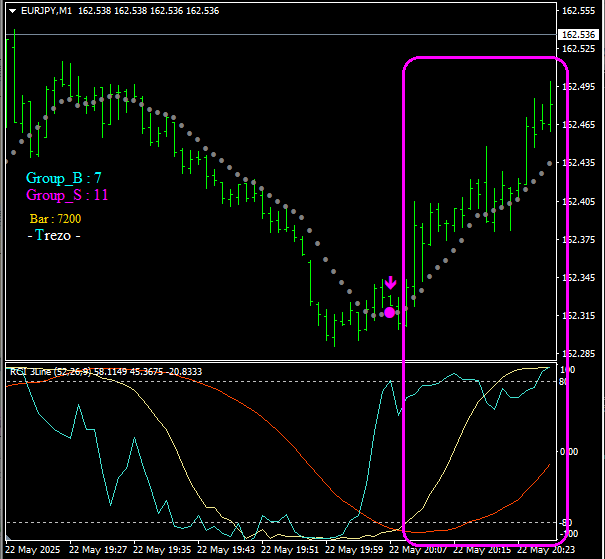

The long-term and mid-term lines, which were the guides for the trend, started to follow the short-term line.
Nevertheless, it’s okay!
Of course, at the time of the signal it is impossible to predict 100% what will happen next.
Also, it is not easy to find a method that yields big wins one after another.
So, next we will introduce what to do next!

【!】
In this validation, there was not a large bias in the appearance frequency between Case A (trend) and Case B (reversal).
Is it because EURJPY and 1-minute charts happen to be like that, or is it just this period? We would like to look at other currency pairs and timeframes as well.
And, finally, we will also consider the timing of exits and test over a longer period, and quantify the data such as profit and loss.
We will also prepare testers EA for that, so we will learn more as we go!
We’ll look forward to the next time, and for now, that is all...
This is the EA we developed! We would be happy if you could also use this!
 |
 |
 |
||
CHFJPY -M15- |
EURGBP -M5- |
EURJPY -M5- |
||