

[Episode 03] RCI x 3 Posts: "Double Ceiling, Double Bottom"—How Does It Stand? (Total 15 Episodes)
|
Please! If you’re reading this serialized article for the first time, please be sure to view from Part 1! We’ve included very important information in the first half, and this explanation featuresIndicatorsandSignal Tools,Tester EAfree distributions as well! |

RCI “Double Top / Double Bottom” investigation starts!
Hello to those who enjoy investing every day, those who deeply love investing, and those who want to make their dreams come true with investing!
We are the Trezo development team!
This time, using a quick-signal tool, we will look at “Double Top / Double Bottom”
Of course, we’ll make it free again this time as well!
Now, an introduction to a convenient tool!
Let’s set it up right away!
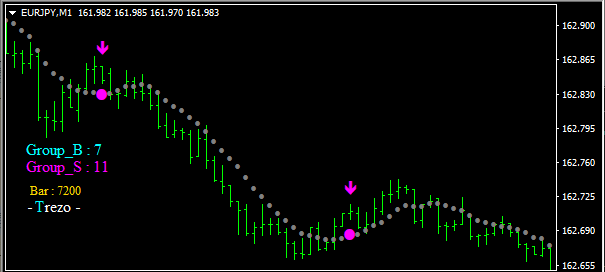
This time we decided to try it on the EURJPY 1-minute chart.
Yes!
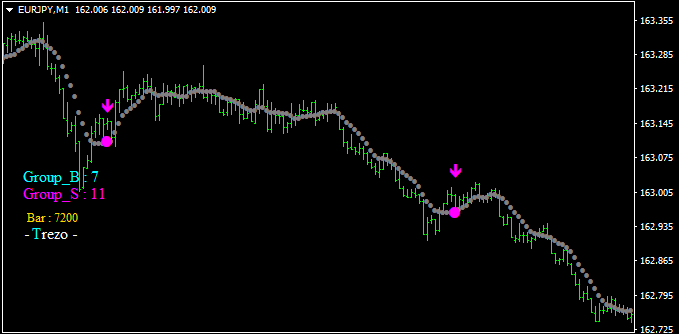
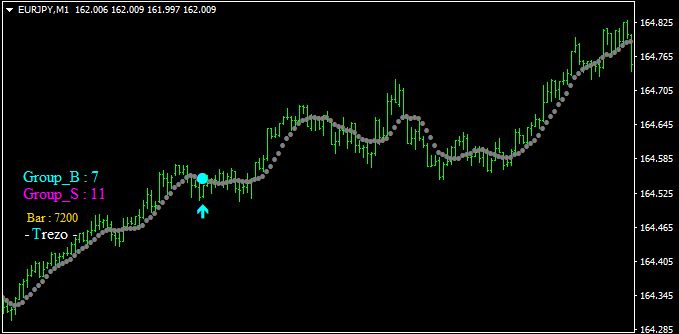
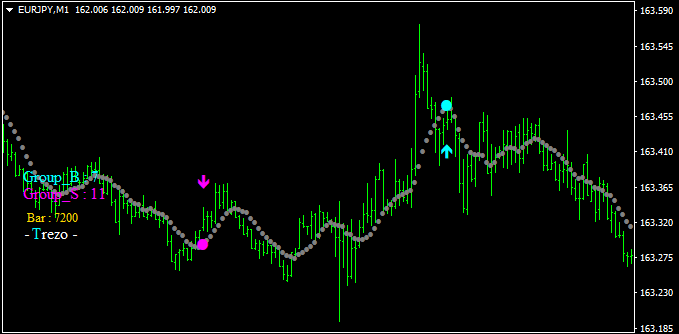
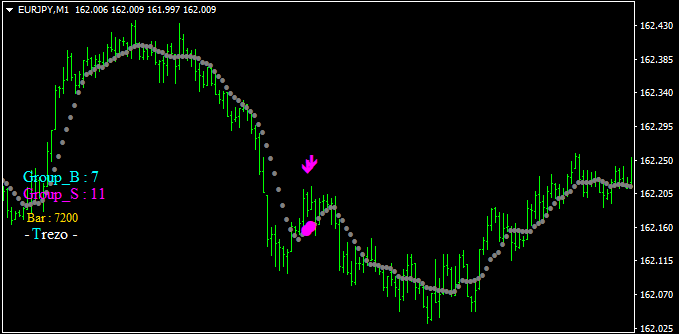
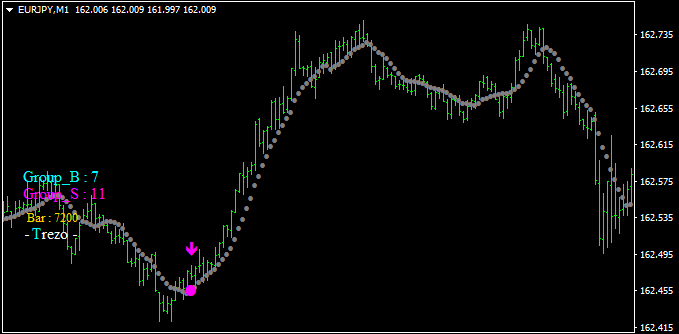
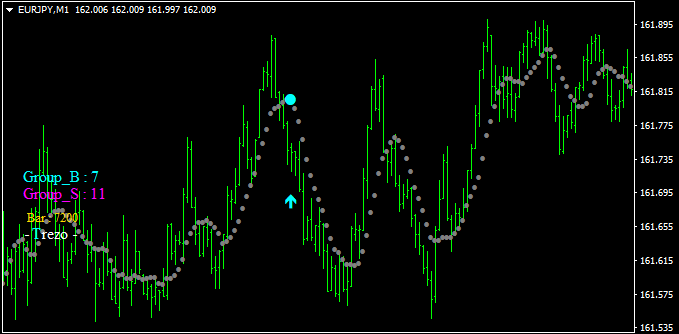
After you set it, it will display on the chart like this.
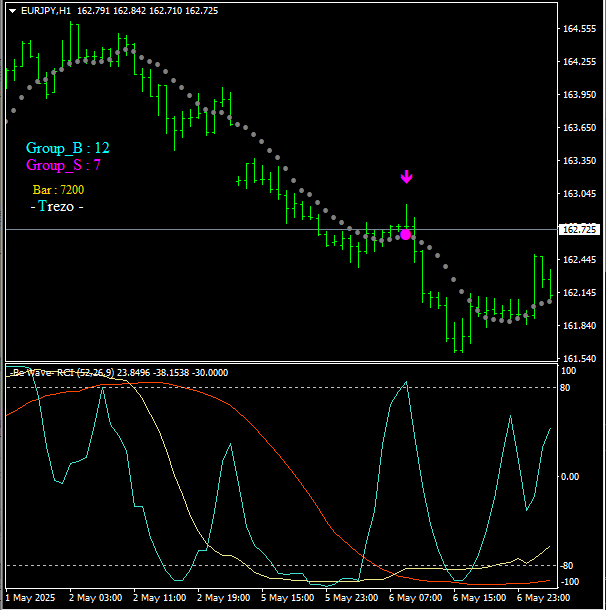
When displayed together with the previously distributed indicator “RCL 3Line,” it looks like this.
Where the bars satisfy the double-bottom condition, a “●” and “↓” appeared.
Now you don’t need to look at three RCI lines each time, so you can display RCI in a sub-chart or not!
Also, it counts how often it occurs within the period.
Group_B : 7indicates the number of times the “double top” occurred.
Group_S : 11is the number of times for the “double bottom.”
Bar : 7200represents the number of bars. The target period is 7,200 bars.
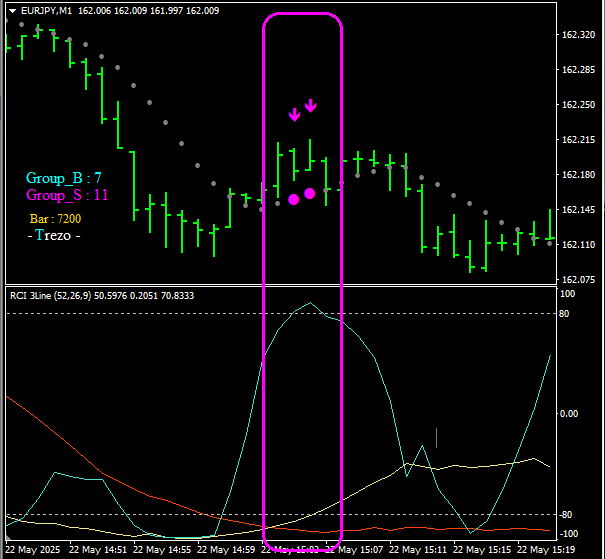
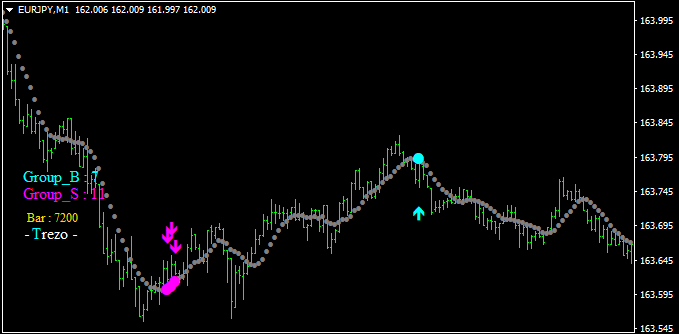
In this way, even if the conditions are met consecutively, it is counted as 1.
Therefore, occurrence counts are labeled as “Group.”
In cases like the above, they are separated, so of course it is counted as “2.”
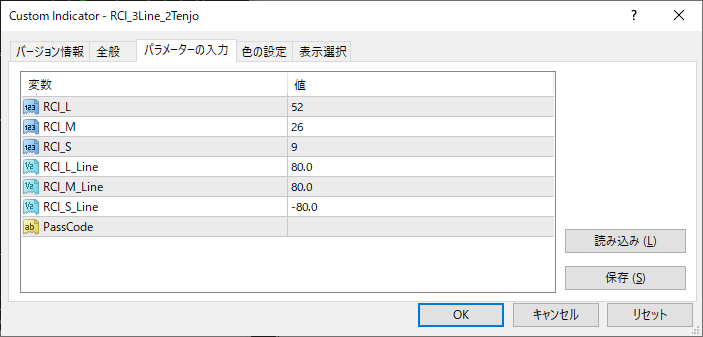
The default is the condition set previously.
Buy = Long-term line 80% or more, Mid-term line 80% or more, Short-term line -80% or less
Sell = Long-term line -80% or less, Mid-term line -80% or less, Short-term line 80% or more

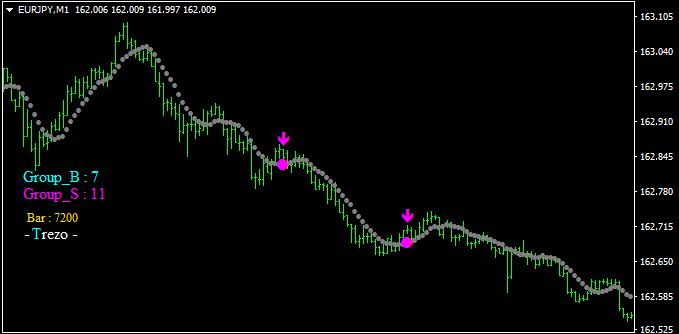
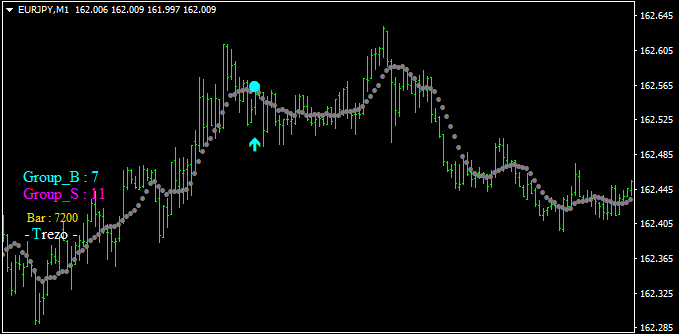
Now, let’s perform a test.
We will try several patterns in order from the oldest.
【↑】Oh, this looks good already!
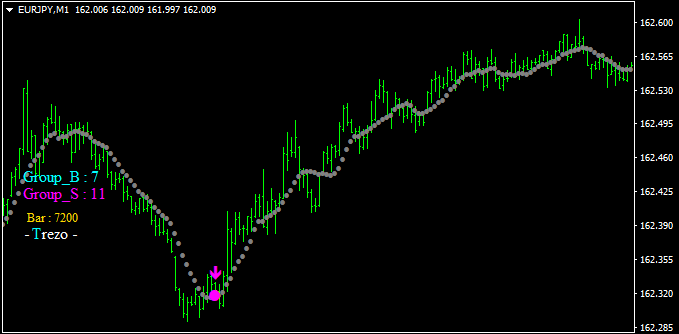
【↑】These two seem likely to lose...
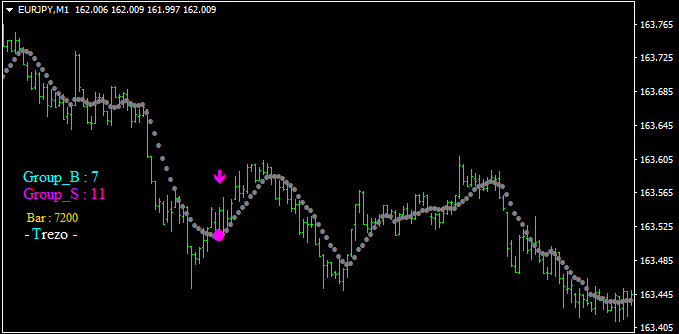
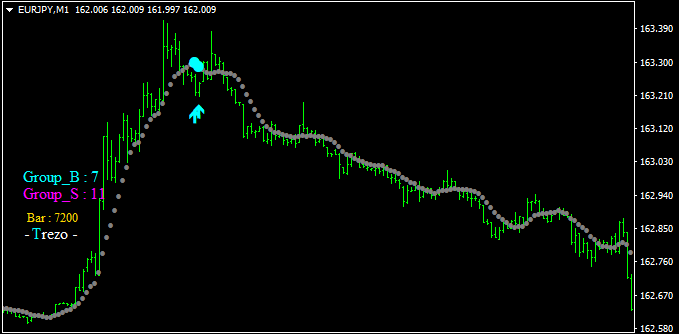
【↑】Depends on the timing of the exit
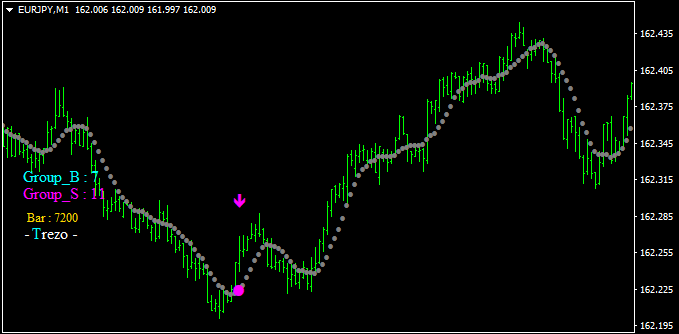
【↑】Hmm, a bit subtle

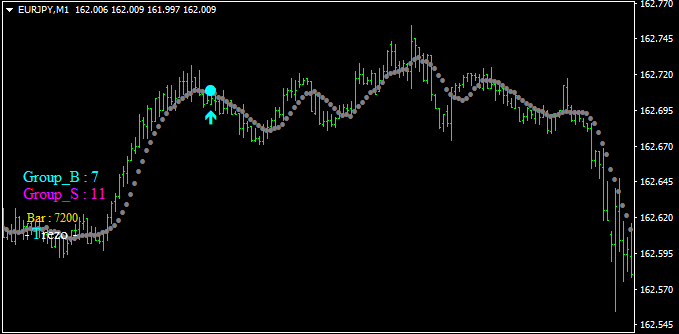
【↑】Very good! A strong possibility of a winning streak!
【↑】This one also seems to be a winner! It looks like a continuing downtrend so far. Overall, it feels like we’re ahead!
【↓】Now, from here, let’s keep watching.
The above shows “Double Top (Buy)” ×7 times, “Double Bottom (Sell)” ×11 times.
(5 days = Bar: 7,200)
Next time, we’ll analyze these results in a bit more detail!
After that, we’ll look at a longer period and other pair charts as well, so we’ll also prepare the tester EA by then!
This time it was the EURJPY 1-minute chart, but it can be used for most currency pairs and timeframes. If you try various pairs and timeframes, you might find a treasure chest with excellent compatibility!
Please give it a try!
 |
RCI_3Line_2Tenjo The indicator introduced today can be downloaded here. The number of bars is 7,200. It works on most currency pairs and timeframes in real time, so it can also be used as a signal tool! |
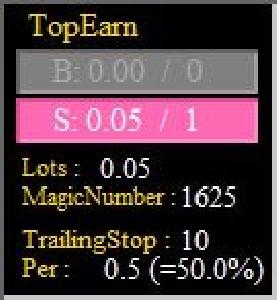 |
TopEarn (Top Earn) |