

Utilization of the "Visualization Indicator" (Part 202)
Utilization of “Visualization Indicator” (Part202)
1. Further evolution of the “28 Currency Pair List Indicator” into an indicator
“8CPVisualization Indicator”to draw USDJPYUSDJPY.
The “8CPVisualization Indicator” includesOceania version,London version,NewYork version,AnyCP version. This time, I used theLondon version.
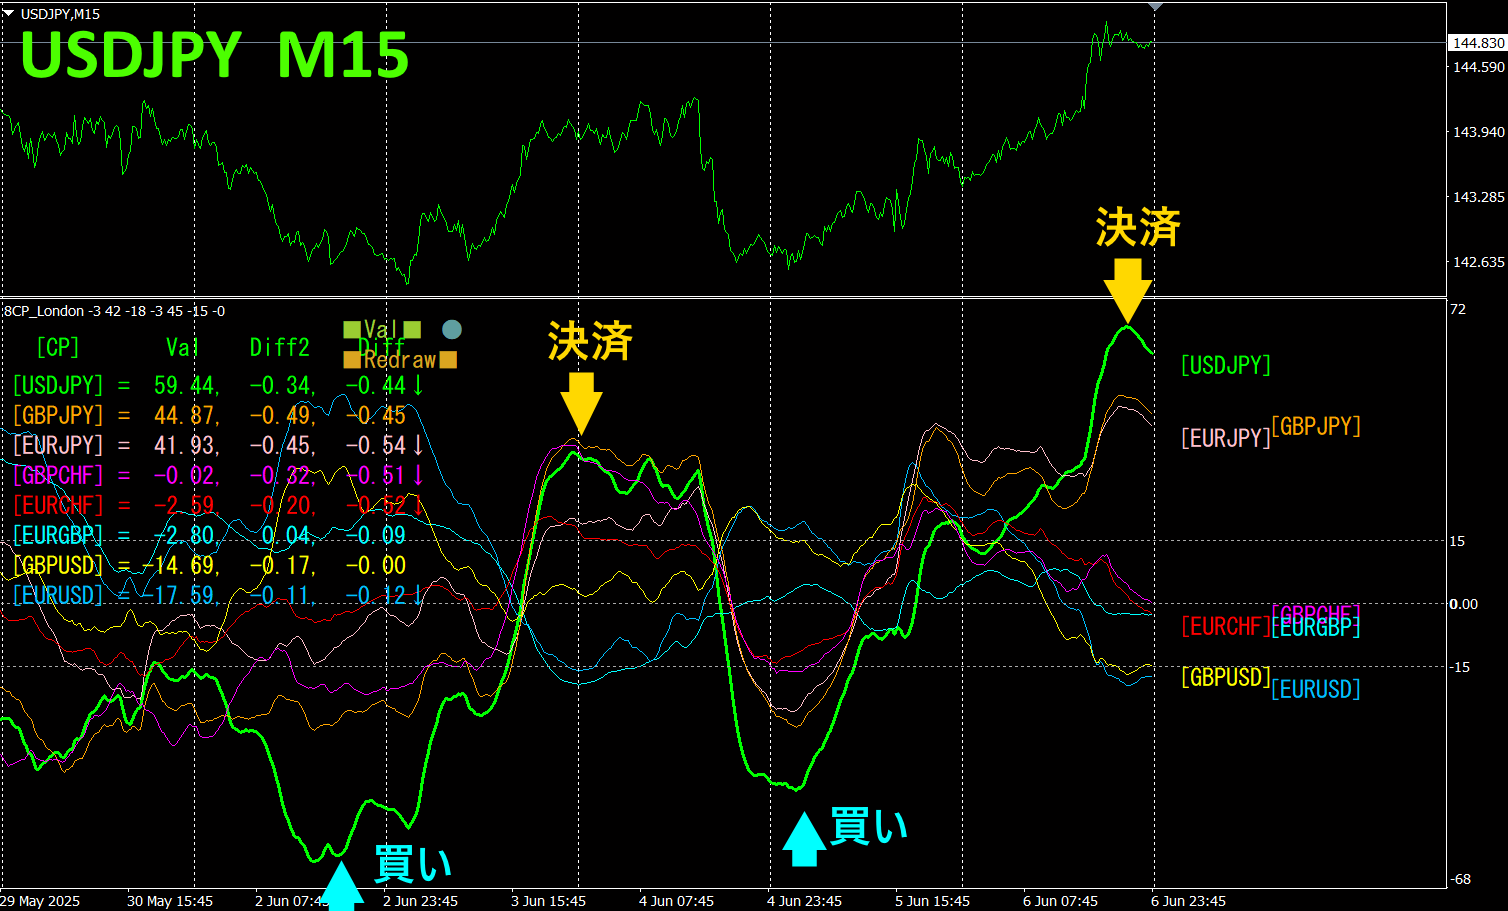
The upper half is a 15-minute chart of. The lower half shows the results from the “8CPVisualization Indicator”; the green thick line graph corresponds toUSDJPY.
This strategy targets rebounds from divergence. I pay attention to rebounds when price has broken away from other chart groups and diverged far from the zero line. I also focus on the large waves indicated by the USDJPY graph. On Monday,USDJPY dropped sharply below other graphs and hit bottom. From there, I bought for a rebound and earned about140pips in profit. Similarly, on Thursday, a similar situation occurred, so I bought again. I earned about220pips in profit. In total, about360pips in profit.
If you opened a long position on Monday, you would initially incur a drawdown, but because the indicator graph shows a large divergence, I expected a rebound and kept the long position, which eventually recovered to profit as anticipated.
Using “TrendLine-EX allows you to automate entries and exits when a diagonal trendline is breached. Since you can leave it as is, it enables easy trading. “TrendLine-EX is a semi-automatic EA that can automatically sell when the trendline is breached downward and automatically close positions when breached upward.
2. Best SelectTry the Indicator
The figure below is a screenshot taken on2025 year6 month6 day10:19 JST).
Total]The numbers are arranged in descending order. At the very top,NZDJPY is shown in blue across all timeframes.Total value is2154.99, indicating a relatively large positive figure. Across all timeframes, it is clear thatNZDJPY is in an uptrend.

Now, let's look at the NZDJPY chart.
The red arrows mark where the screenshot was taken. It captures a surge during an uptrend. Since the overall trend is upward, buying from here can yield substantial profits. Holding until the weekend would gain about40pips.

The “28 Currency Pairs Best Select
“28 Currency Pairs Best Select Indicator”

https://www.gogojungle.co.jp/tools/indicators/35128
3. 2021 Year5 month to follow EURJPY EURJPY
2021 Year5 month since movement is being tracked.
To view the overall trend, I chart the most recent about30 minutes over the last weeks.
Last time, I wrote the following.
Pink indicatesEUR, green indicatesJPY. In the currency strength chart,JPY andEUR are both slightly downward; compared,JPY is more downward thanEUR. It is almost horizontal. A clear directional cue is hard to read. If anything,EURJPY is expected to move slightly upward in the future.

As expected, it has been rising slowly.
30 minutes of currency strength chart.

Pink indicatesEUR, green indicatesJPY. In the currency strength chart,EUR is downward,JPY shows signs of reversal from a deep bottom, soEURJPY
4.
New Indicator Dual_MACD_Trend_Indicator to tryout
New Indicator “Dual_MACD_Trend_Indicator” please see below.
MT4 version:https://www.gogojungle.co.jp/tools/indicators/62199

https://www.gogojungle.co.jp/tools/indicators/62202
An indicator that clearly shows the direction of the trend with color. If the color bar is Lime, it’s a buy; if Red, it’s a sell, making it easy for beginners to use. If the bars are green, it indicates an uptrend; if red, a downtrend; if no color, no trend. Because it uses color, you can grasp the trend status at a glance.
I installed this indicator on EURJPY's 1-hour chart.
Introducing the indicator clarifies the sell and buy zones. The sell zone is where bars stay red for a long period, with long-term MACD and short-term MACD both declining. The buy zone is where bars stay green for a long period, with long-term MACD and short-term MACD both rising.
MACD main line and signal line: if the main line is below the signal line, it’s a sell; if above, it’s a buy.

The most recent bar is colorless, so the green streak is broken. Also, the main line of the short-term MACD has crossed below the signal line. The long-term MACD line remains above the signal line, but its distance from zero has become quite large, so a rebound is expected. In the currency strength graph earlier,JPY was moving up andEUR was moving down, so going forward,EURJPY is likely to move downward. “Dual_MACD_Trend_Indicator” if read carefully, may provide insight into future market movements.
If you use theDual_MACD_Trend_Indicator, you will no longer be uncertain about the trading direction.
※ Recommended indicators
“Toretore Indicator”
https://www.gogojungle.co.jp/tools/indicators/50115
“TrendLine-EX”


https://www.gogojungle.co.jp/tools/indicators/42257
“8C Currency Strength Visualization Indicator” is described on the following page.

MT4 version https://www.gogojungle.co.jp/tools/indicators/39150
version https://www.gogojungle.co.jp/tools/indicators/39159
【My items for sale】


