
2025-6-2 > 2025-6-6 This week's USD/JPY + Next week's USD/JPY 【Trend Line Pro 2】
【This Week's USDJPY】
First, I will paste the behavior verification video for the weekly prepared 'Trendline Pro 2'.

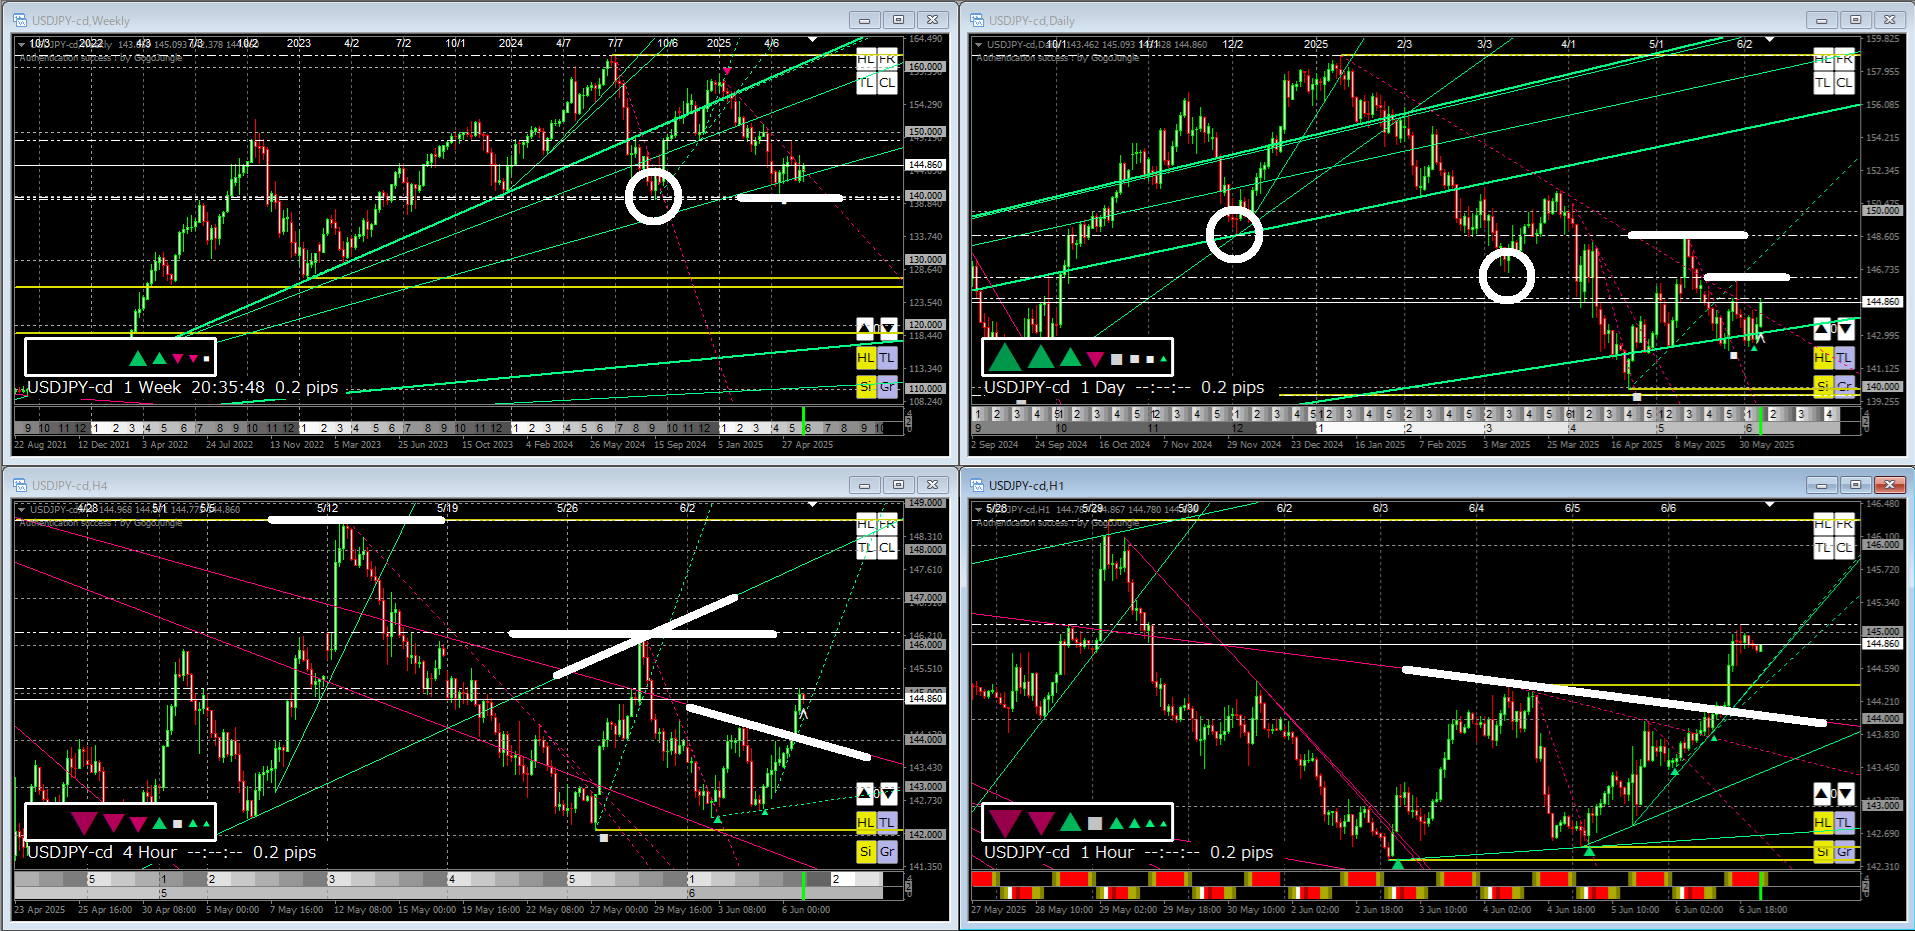
『Starting from the Smallest in the World Next-Generation ZigZag 2』 is the chart image.
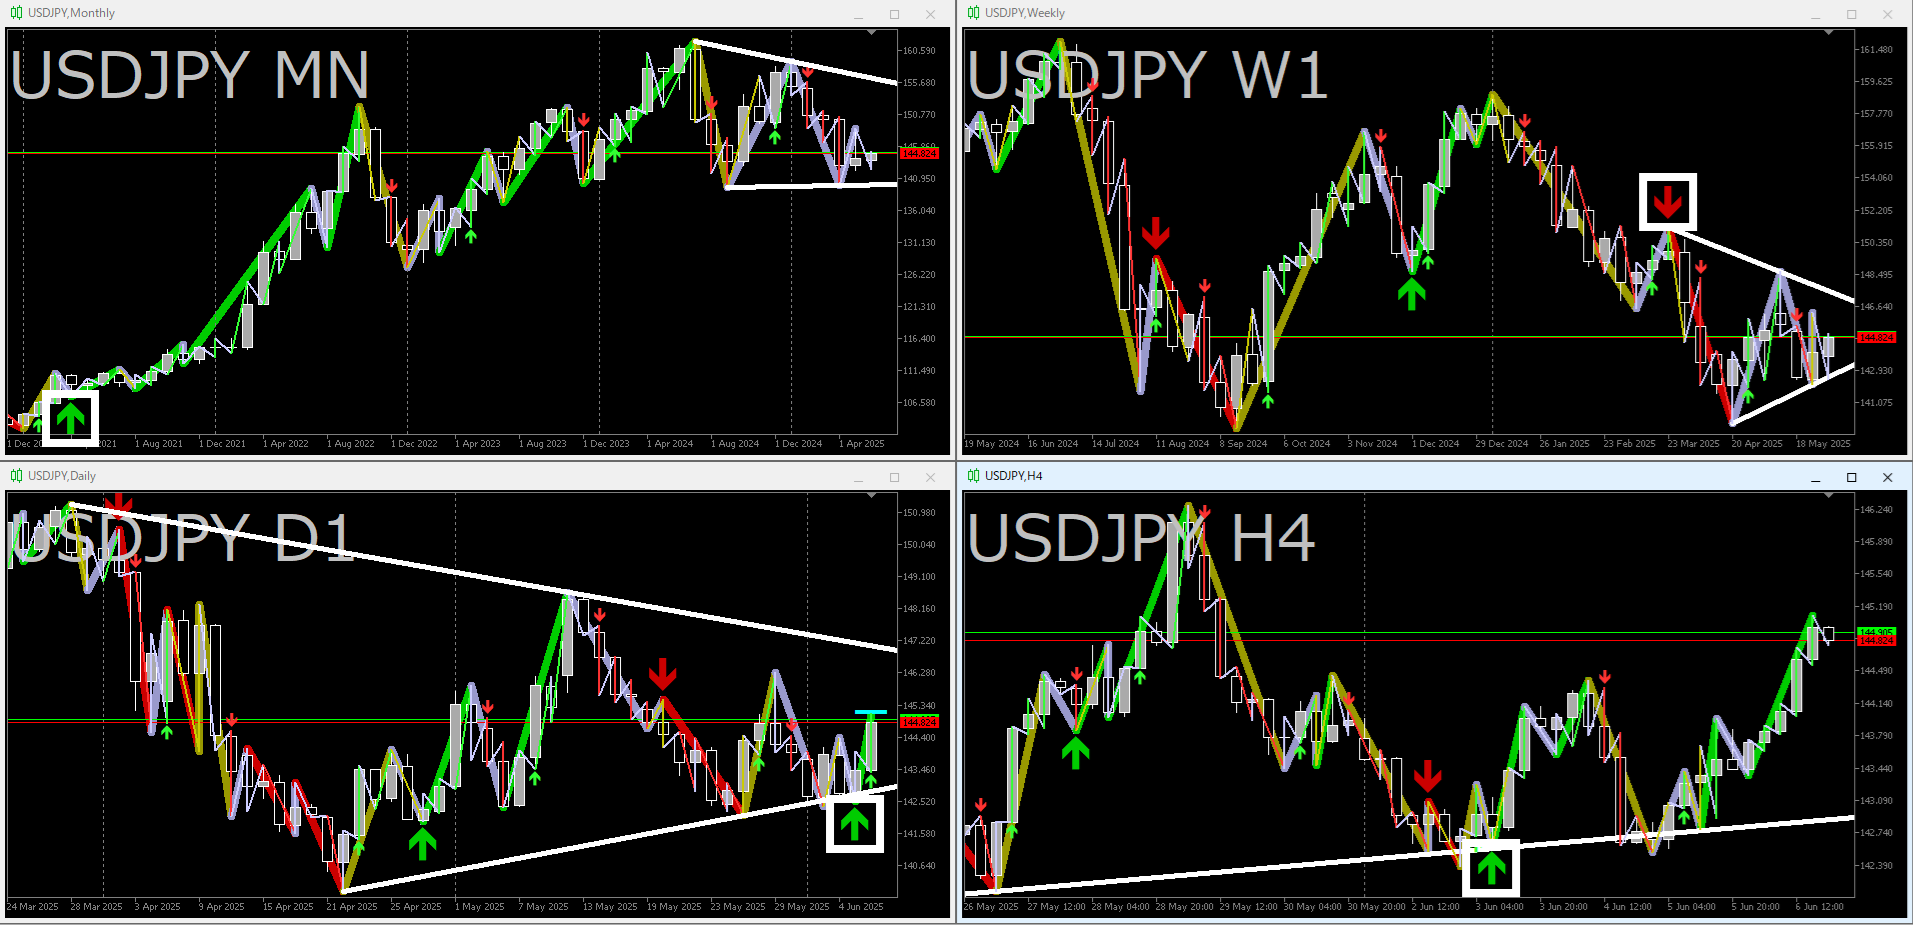
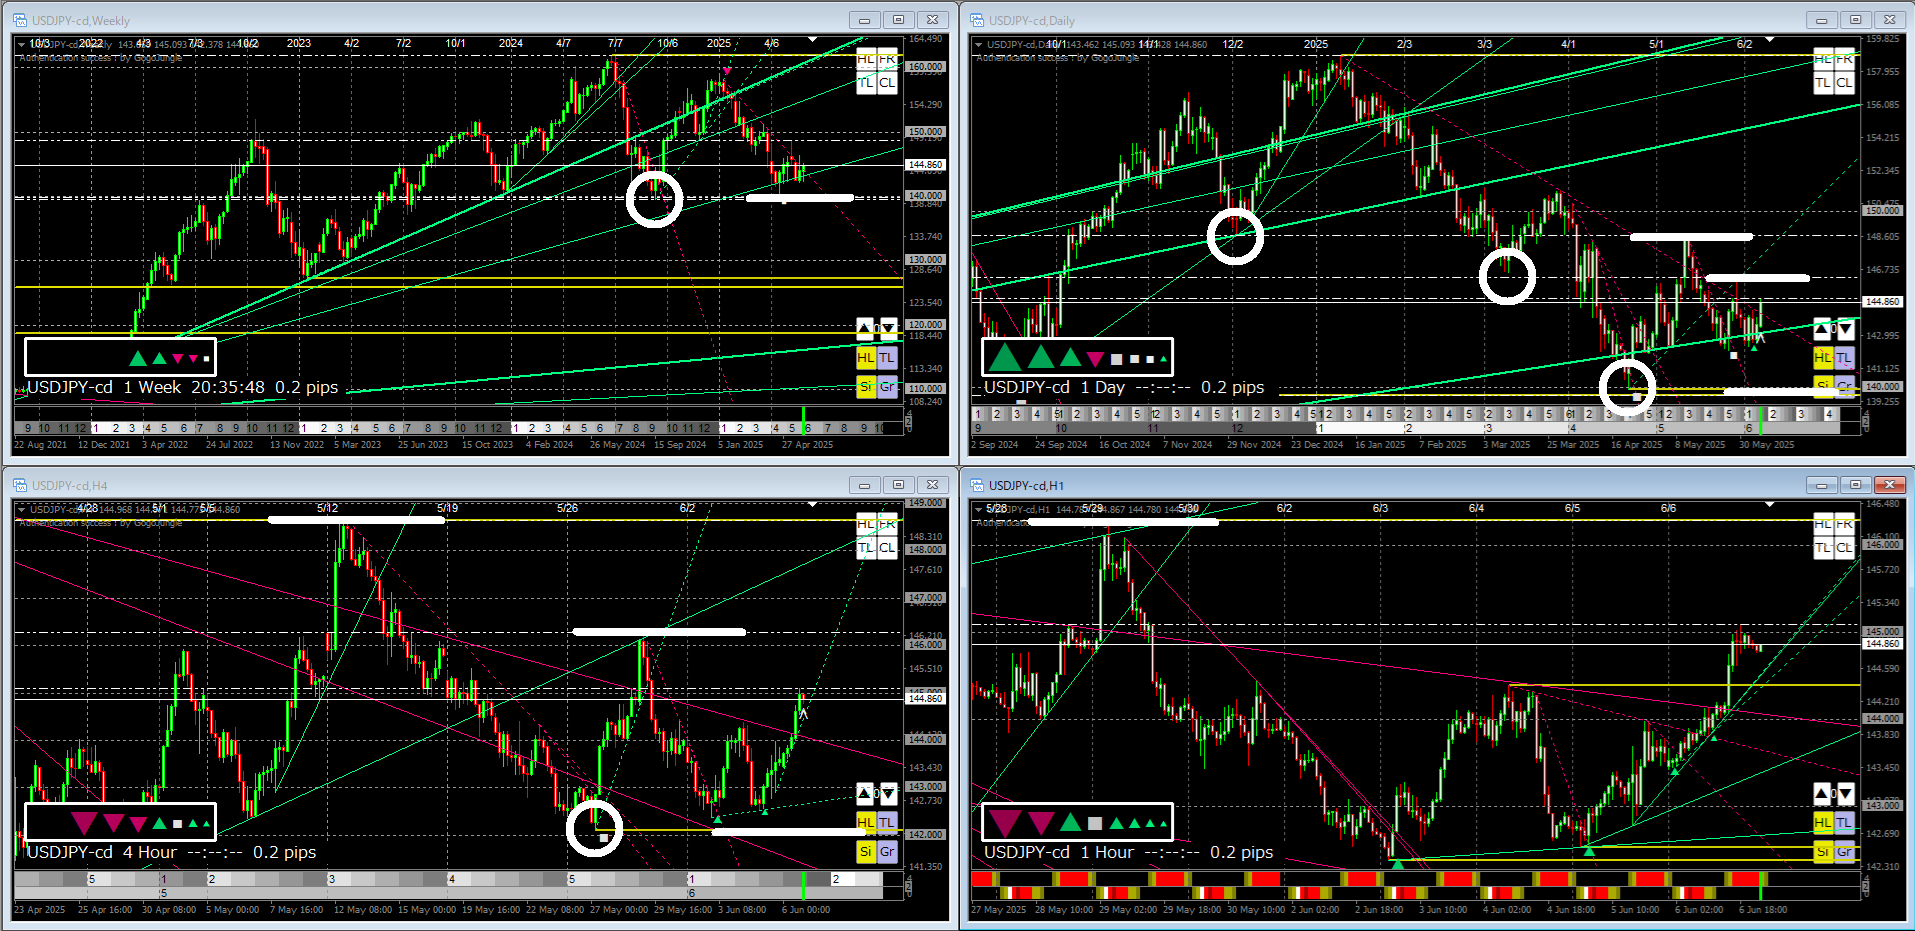
『Trendline Pro 2』 is the chart image.
This week, a consolidation around a triangle formed the focal point.
It was a scenario I expected, but the lack of directional clarity and the occasional sharp moves made it difficult.
Also, the line tended to move sideways, making it hard to use as a reference.
In the middle of the week, a clean rebound occurred from the right-shoulder-downward trendline, but in the subsequent rise, an uptrend was indicated, and the right-shoulder-upward trendline was effective, though I kept wary of potential reversals.
Having an indicator that visually confirms the true market condition is valuable.
【Next Week's USDJPY】
『Starting from the Smallest in the World Next-Generation ZigZag 2』 is the chart image.
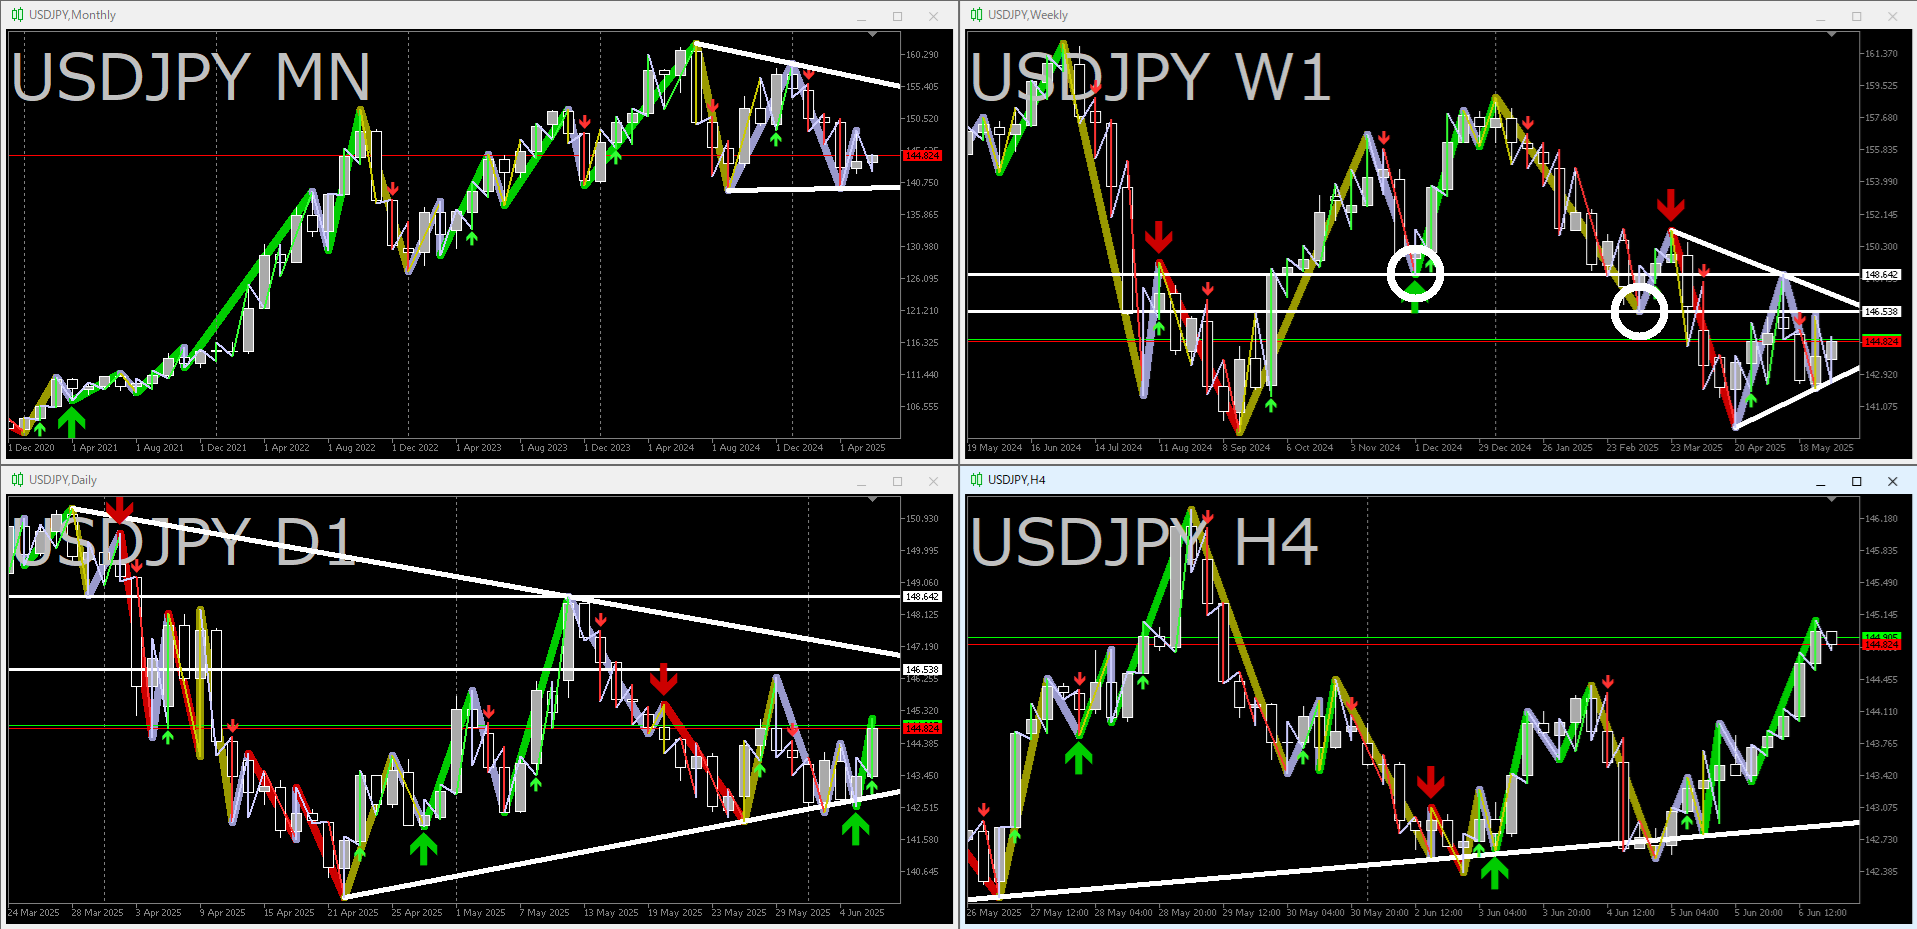
『Trendline Pro 2』 is the chart image.
Continuing from this week, next week too, I expect the triangle formed by the monthly and weekly charts (ZigZag in purple) to be the focus.
The lower line of the weekly triangle drawn last week has barely broken, so the downside remains weak; when it tests lower again, it may break through.
That said, I believe it still requires some time for the monthly low to be breached, so the downside movement may be limited.
In that case, the weekly triangle may transition from a directionless triangle (symmetrical triangle) to a more downside-prone triangle (descending triangle).
Breaking lower is a future possibility; for now, the short term trend is up, so it may be better to focus on how high it can rise.
If it falls from the two white circles on the weekly chart in the image, it will be viewed as a double top; if it falls from the upper line of the weekly triangle, it will be treated as a consolidation breakout.
If all three break above, the monthly triangle becomes a focus.
The more people are watching for a monthly low breakout, the more likely it is that an artificial move toward the monthly triangle will produce a strong rally.
It is a very plausible scenario, so it may be wise to stay alert.
Resistances that people tend to watch are annotated in white.
Hope this is helpful.
【Afterword】6/7 17:35
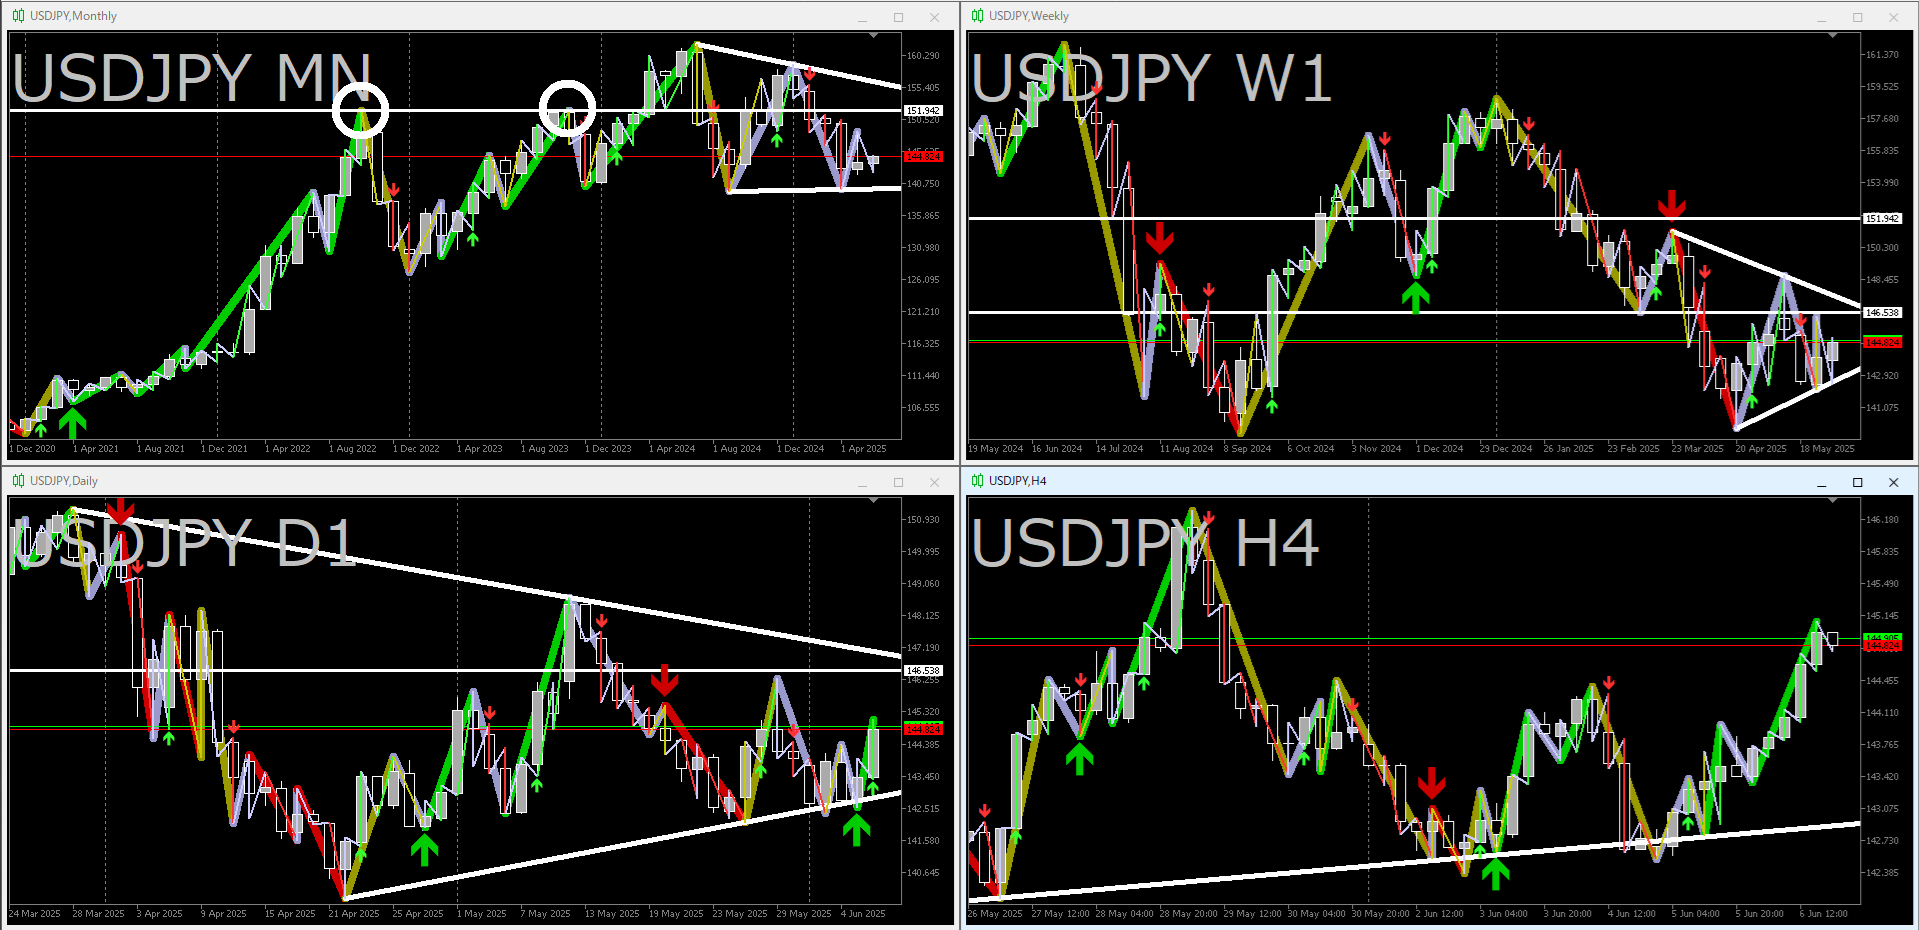
When aiming for a breach of the monthly low, I had forgotten to add the white-circle resistance on the monthly chart that would attract more attention.
The recent monthly movement isa descending triangle (descending triangle),so a break below the monthly low is likely considered.
In that case, given the current chart shape, it seems that it would be more notable to push up to the white circle on the monthly chart once, and then drop, to emphasize the monthly low breakout.
It is at a fairly high level, so it may not be reached within next week, but it could be a good target as part of the time-based adjustment.
* The white circles and white lines shown in the reference image were added later.
* If the image is small and hard to see, right-click the image and choose 'Open image in new tab' to view at full size.
ーーーーーーーーーーーーーーーーーーーー
If you found this article helpful, I would be glad if you click the『 Read more』 buttonbelow (there is no continuation; it's a liking gesture).
ーーーーーーーーーーーーーーーーーーーー