
This is roughly what a method that can continuously win looks like. Please take a look.
One day of the N-Method
GBP/JPY.
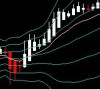
The market had fallen sharply from Tokyo time, but I entered a short position with the N-Method around the 5 o’clock hour.
The image is a 4-hour chart.
As a clue, RSI is under 50 indicating bearishness, it has touched 30, but since the trend is intact we ignore it. And as the middle band slope increases and Bollinger Bands expand, at that point
is the signal for the N-Method.
× ![]()