
This is how a method that can continuously win looks. Please take a look.
One day of the N-Method
GBP/JPY.
The market fell sharply from Tokyo time, but I entered short with the N-Method at the 5 o'clock hour.
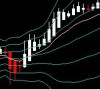
The image is a 4-hour chart.
As a hint, RSI is bearish below 50, touches 30, but since it is in a trend state I will ignore it. And when the slope of the middle band increases and the Bollinger Bands expand, that is
the signal of the N-Method.
× ![]()