

Explain the chain of downward waves in the USD/JPY yearly chart / monthly chart / weekly chart / daily chart (2025/6/4)
6/4 afternoon USD/JPY
In the monthly/weekly/daily charts, both green (mid-term) and blue (short-term) Stochastics are headed downward, and since a bullish candle formed toward the short-term 5SMA, I am targeting the price action where the daily/weekly/monthly charts move to create bearish candles in sequence. ~朝 6/5: daily bearish candle? (if not, lower) ~朝 6/7: weekly bearish candle? ~朝 6/30: monthly bearish candle?
The figure below also shows the relationship with the lower timeframes (one to two steps down) that correspond to bullish→bearish candles on the monthly/weekly/daily charts.
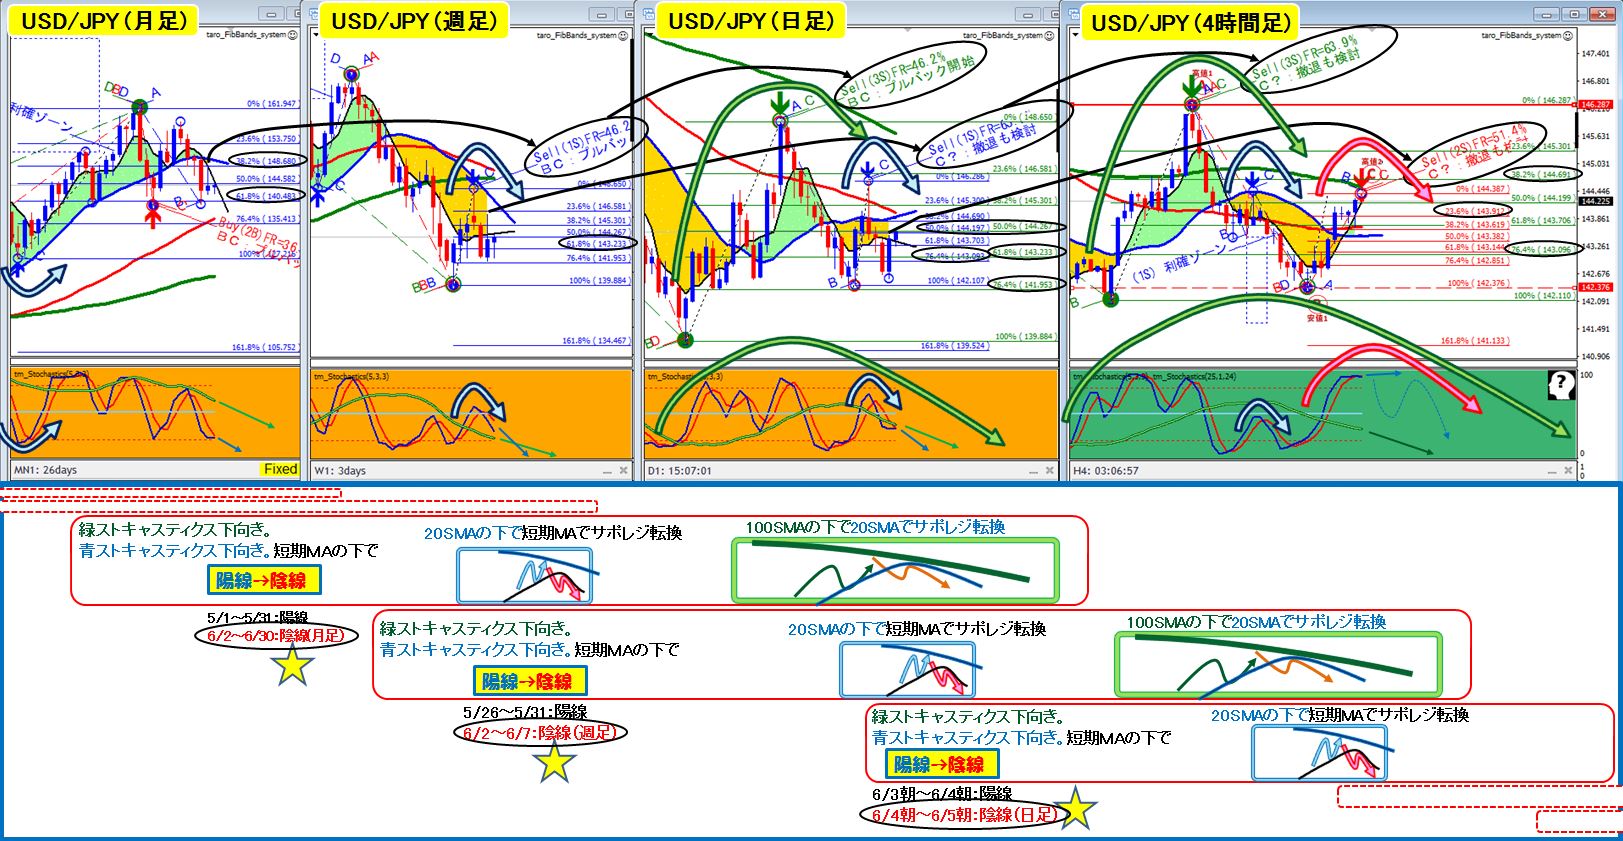
When the candle is moving under the top-tier short-term MA and forms ‘bullish→bearish’,
on the one-step-down mid-tier chart, it appears as a reverse V under the 20SMA (turning from support to resistance with the short-term MA under the 20SMA),
on the two-steps-down lower-tier chart, it appears as a reverse V under the 100SMA (turning from support to resistance with the 20SMA under the 100SMA), which is the basic scenario.
Seeing the same price action on different timeframes looks like this, but the key point is the timing when the higher timeframe’s short-term MA turns into support/resistance while the stochastics head downward and the candle turns from bullish to bearish. As a higher timeframe, this is a momentum where no one interferes and just holds the line with the short-term MA to push a single candle bearish, so it seems easy to move. Traders who trade on 1-step down, 2-steps down, ... up to 9 steps down charts can coordinate timing and strength as a team.
This time, the timing of three stages of wave movement (monthly, weekly, daily) aligns, and it is also a moment when, even at the yearly level, after forming a bullish candle in 2024, a bearish candle could form in 2025, so there is a strong likelihood of downward pressure currently.
Conversely, if all traders around the world using these various large, medium, and small waves cannot push prices lower and prices keep making higher lows on each timeframe, then a substantial upside breakout could be expected.
(Personally, I think it could reach at least the monthly 50SMA or the weekly 200SMA...)