
USD/JPY (Weekly) Chart Analysis (Current状況 of various pullback buy traders and future analysis) [as of 2025/6/2]
Using the current (as of 2025/6/2) USD/JPY weekly chart and various moving averages to perform a dip-buy, I would like to analyze how the current chart looks from the perspective of traders who bought on dips using different moving averages and explain how they are thinking, in order.
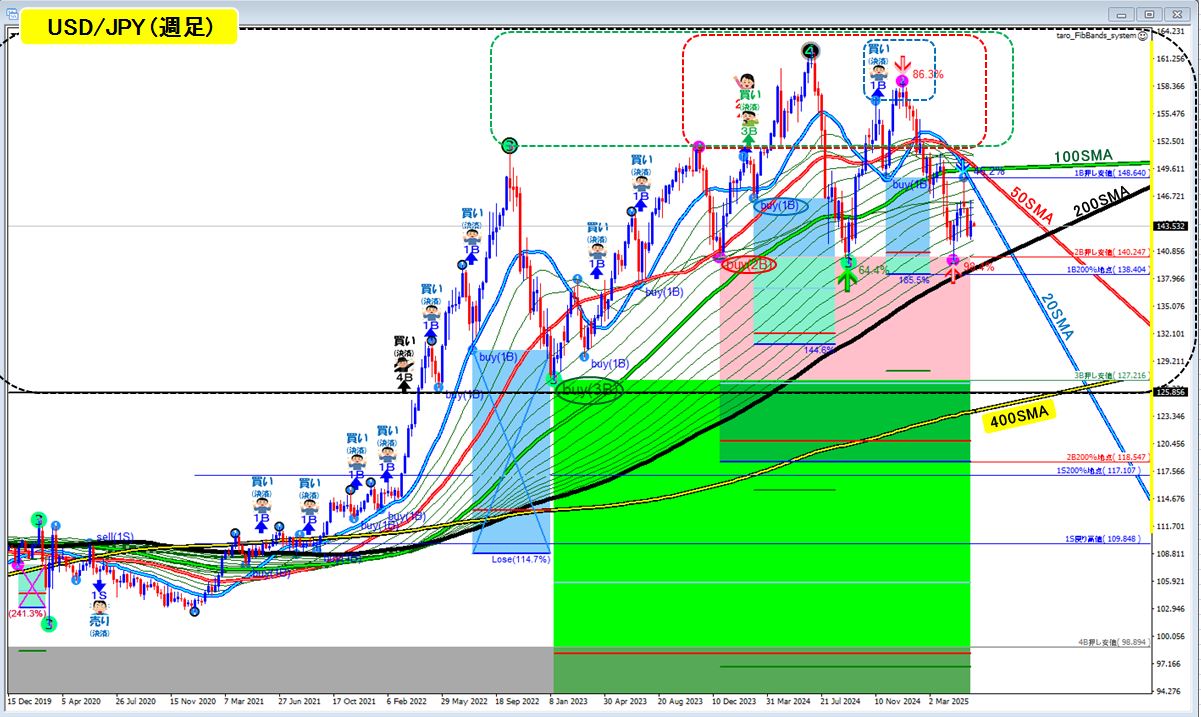
Because the month-end weekly/monthly and the 1-minute confirmations occurred at a quite critical timing, I am posting this article as a reference example for the price action of USD/JPY after 6/1.
The USD/JPY (weekly) chart shown below is complex, so I’d like you to look at it vaguely, but you can see many traders using various moving averages to buy on dips (≈buy(1B~4B)) and taking profits (≈the point above which the colored character illustrations are drawn) in the upper zone.
(In a sense, you can see various characters entering the profit-taking zone and cheering, forming a rough image of many buyers’ positions accumulating.)

We will break down the same scene by each moving average scale: small, medium, and large.
<From the eyes of a trader using blue①20SMA>
20SMAWhat the trader (e.g., Mr. Aoshima) would be thinking about is:
● The moving average was downward, but after the candlesticks crossed above it and turned upward,20SMA(even though this time before turning upward) they would have built a buy position around this area with buy(1B)
● It is assumed they would have taken profits near the dotted line profit zone that marks an uptrend
● If only Mr. Aoshima were in the USD/JPY market, when Mr. Aoshima takes profit, price would return to the buy(1B) level.
● Then, since the margin returns to Mr. Aoshima, his tendency to chase positions (pos-pos) makes him want to enter somewhere
● This time, the candlestick touches near the area where it turned downward around20SMA and Mr. Aoshima is assumed to have sold (sell(1S)) here.
● If the margin size is the same as the buy(1B), the price could fall by the same amount as the lift (i.e., the lower edge of the light blue box at the 1B200% level ≒ 148.64), and if profits had increased the margin size, it could fall further.
(In reality, it isn’t only Mr. Aoshima trading; there are various traders using USD/JPY weekly 20SMA, daily 100SMA, and monthly 5SMA for dips, as well as real demand (buying for travel abroad and trade) and other strategies that influence, so it isn’t this simple, but this is a basic image of price movement.)
● By the way, for USD/JPY (weekly)20SMAThe lower inverted V reversal corresponds to the bullish candlestick on the monthly chart’s -1σ or below the short-term MA, leading to a monthly bullish candle (May) → monthly bearish candle (June), and, around 6/30+α, the weekly chart would20SMAretest the lower side with an inverted-V reversal and make a new low.

<From the eyes of a trader using red②50SMA>Next, from the perspective of a trader using the 50SMA (e.g., Ms. Akaboshi),
● The candlesticks cross above the downward-moving average and turn upward near the 50SMA to buy(2B) and build a position
● Profit is taken near the dotted-line profit zone that marks an uptrend
● If only Ms. Akaboshi were in the USD/JPY market, when she takes profit, price would return to the buy(2B) level.
● Then, as the margin returns to Ms. Akaboshi, she would feel compelled to enter somewhere
● The downward-turning 50SMA is approaching on the right side, so attention is on what action will be taken near the touch point
● If she does the same as Mr. Aoshima, price could fall to around the 2B200% level ≒ 118.547 + α.

<From the eyes of a trader using green③100SMA>Next, from the perspective of a trader using the 100SMA (e.g., Mr. Midorikawa),
● The candlesticks cross above the downward-moving average and turn upward near the 100SMA to buy(3B) and build a position
● Profit is taken near the dotted-line profit zone that marks an uptrend
● If only Mr. Midorikawa were in the USD/JPY market, when he takes profit, price would return to the buy(3B) level. However, since price has not yet returned to the 3B area, the price may bounce off the 100SMA’s lower candlestick body with a lower wick, and this area could become a dip and return to the profit zone. Yet if the 100SMA turns downward and presses on the candlestick top, he might give up and return to buy(3B).
● And when the margin returns to Mr. Midorikawa, he will want to enter somewhere
● We are watching how price acts near the touch of the downward-turning 100SMA
● If he does the same as Mr. Aoshima and Ms. Akaboshi, price could fall to around the 3B200% level ≒ 92.485 + α.

<Black④200SMA trader’s view>
Next, from the perspective of a trader using the 200SMA (e.g., Mr. Kuroda),
● The candlesticks cross above the downward-moving average and turn upward near the 200SMA to buy(4B) and build a position
● Profit is taken near the dotted-line profit zone that marks an uptrend
● If only Mr. Kuroda were in the USD/JPY market, when he takes profit, price would return to the buy(4B) level. However, if candles stay above the upper area of the 200SMA and drop toward the upward vicinity of the 200SMA, he might view that as a dip and buy on a dip. However, since the profit zone has already been established and considering the surrounding conditions, he might choose not to dip-buy and instead break below the 200SMA to fall to buy(4B).
● And when the margin returns to Mr. Kuroda, he would want to enter somewhere after not having opened new positions for years
● If price falls, we want to watch how price acts near the touch of the downward-turning 200SMA
● If he does the same as Mr. Aoshima, Ms. Akaboshi, and Mr. Midorikawa, price could fall to around the 4B200% level ≒ 35.841 + α.
(The USD/JPY has been continuing to fall in stages from around 270 yen per dollar, and the 161.947 high is the high created by Wave N, so there is a possibility of a retracement and a steady fall in one larger wave from around 270 yen per dollar as the next step. The upcoming price action near the weekly 200SMA will likely be a key determinant of the near-term movement.)

<Mixed view of the four traders above>
Next is the chart with the mixed view of the four traders above.
Overlaying the four charts above and also drawing lines for 10–200SMA in 10SMA increments.
● Personally, I’m curious how price behaves around the 200SMA area?
(Dip-baseline rising pattern, rise followed by a high priced peak then decline, or a straight-down drop)
● If price drops, will around 400SMA become a dip and price rises? Or will it break below and continue falling in steps from the $1,270 level? I plan to watch.
(Even if price moves that way, it would take quite a while to fall to 400SMA, so this may not be something to worry about just yet…)
