

Utilization of “Visualization Indicators” (Part 200)
“Visualization Indicator” Utilization (Part200)
1. “28 Currency Pairs List Indicator” is further evolved into an indicator
“8CPVisualization Indicator”forUSDCHF to be drawn
“8CPVisualization Indicator” includesOceania version, version, version, version. This time, we used the version.
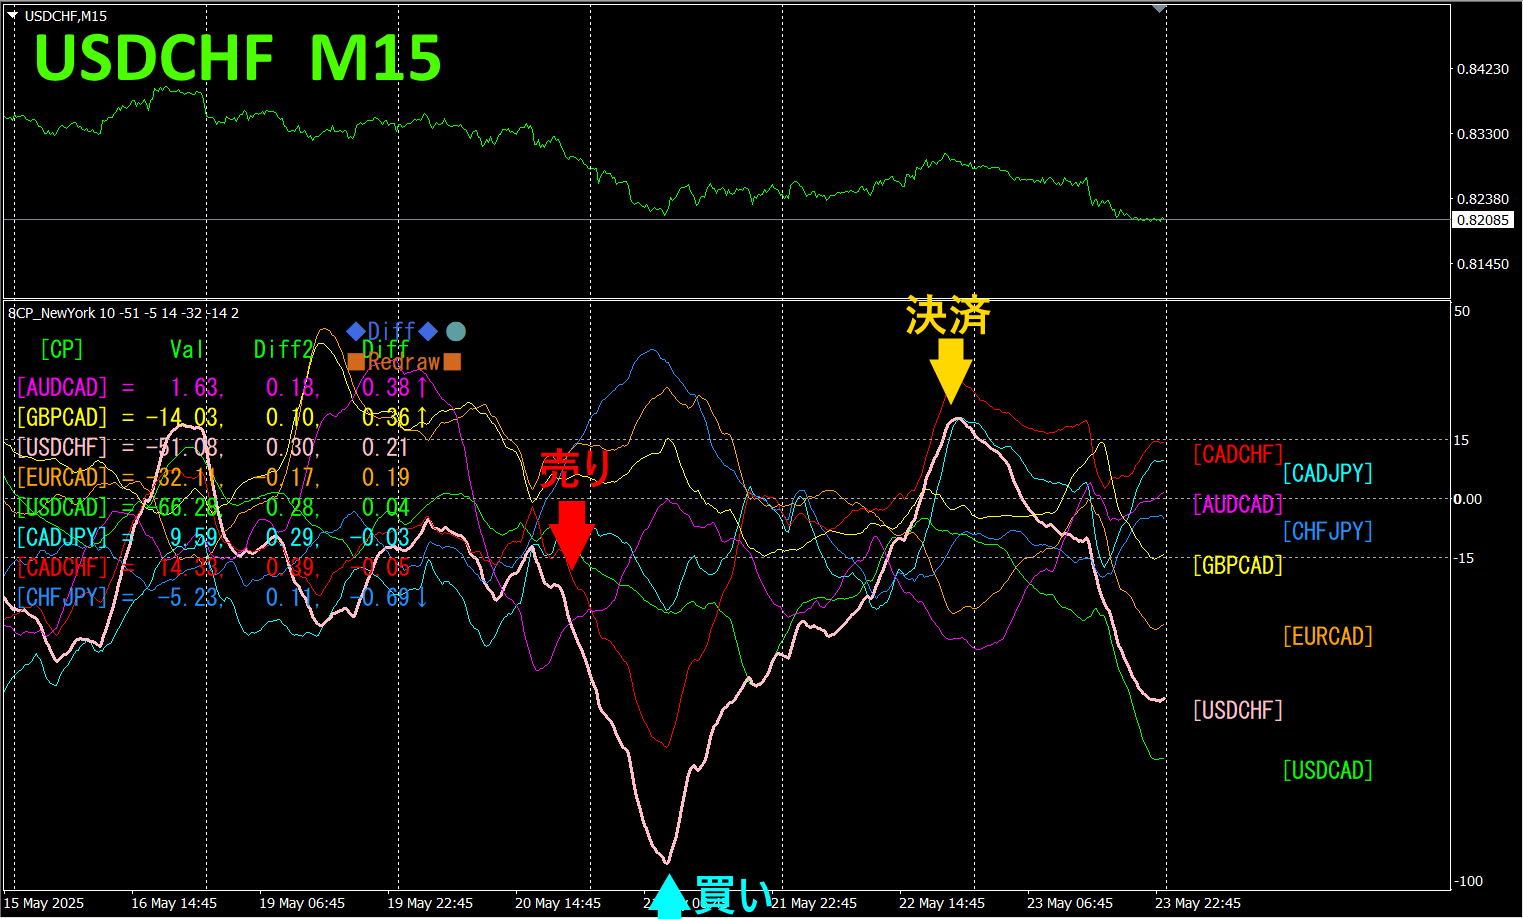
The top half is a 15-minute chart ofUSDCHF. The bottom half is from the “8CPVisualization Indicator”; the pink bold line graph corresponds to.
On Tuesday, fell below other graphs, so we enter a sell. Since the graph reached a bottom, we close the position and then aim for a rebound to the zero line with a reverse buy. If the graph breaks above the zero line and the upward speed slows, we close the position. Profit was about on the buy side, about on the sell side, totaling about.
If you use “, you can automate entries and exits by breaking diagonal trend lines. You can leave the trade as is, making trading easy. “ is a semi-automatic EA that can automatically sell on a trend line break and automatically close on an up break.
2. Best SelectTry the Indicator
The figure below is a screenshot taken on2025 year5 month21 day ()
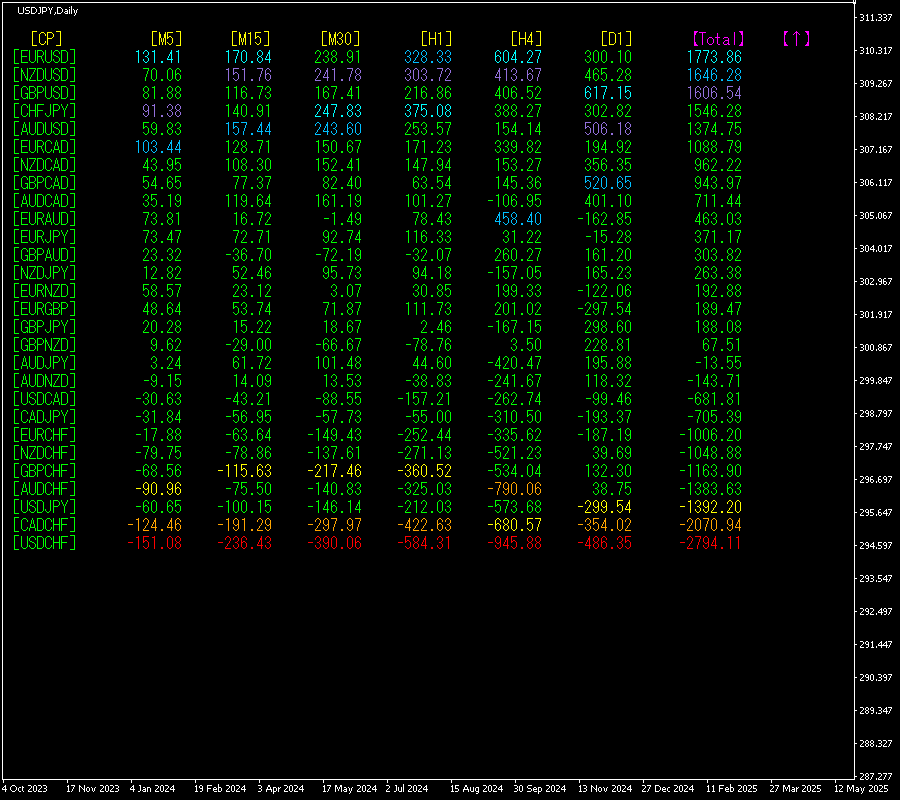
[Total]Numbers are arranged in descending order. The lowest at the bottomUSDCHF shows red in all timeframes. value is , a large negative number. Across all timeframes, shows a downward trend.
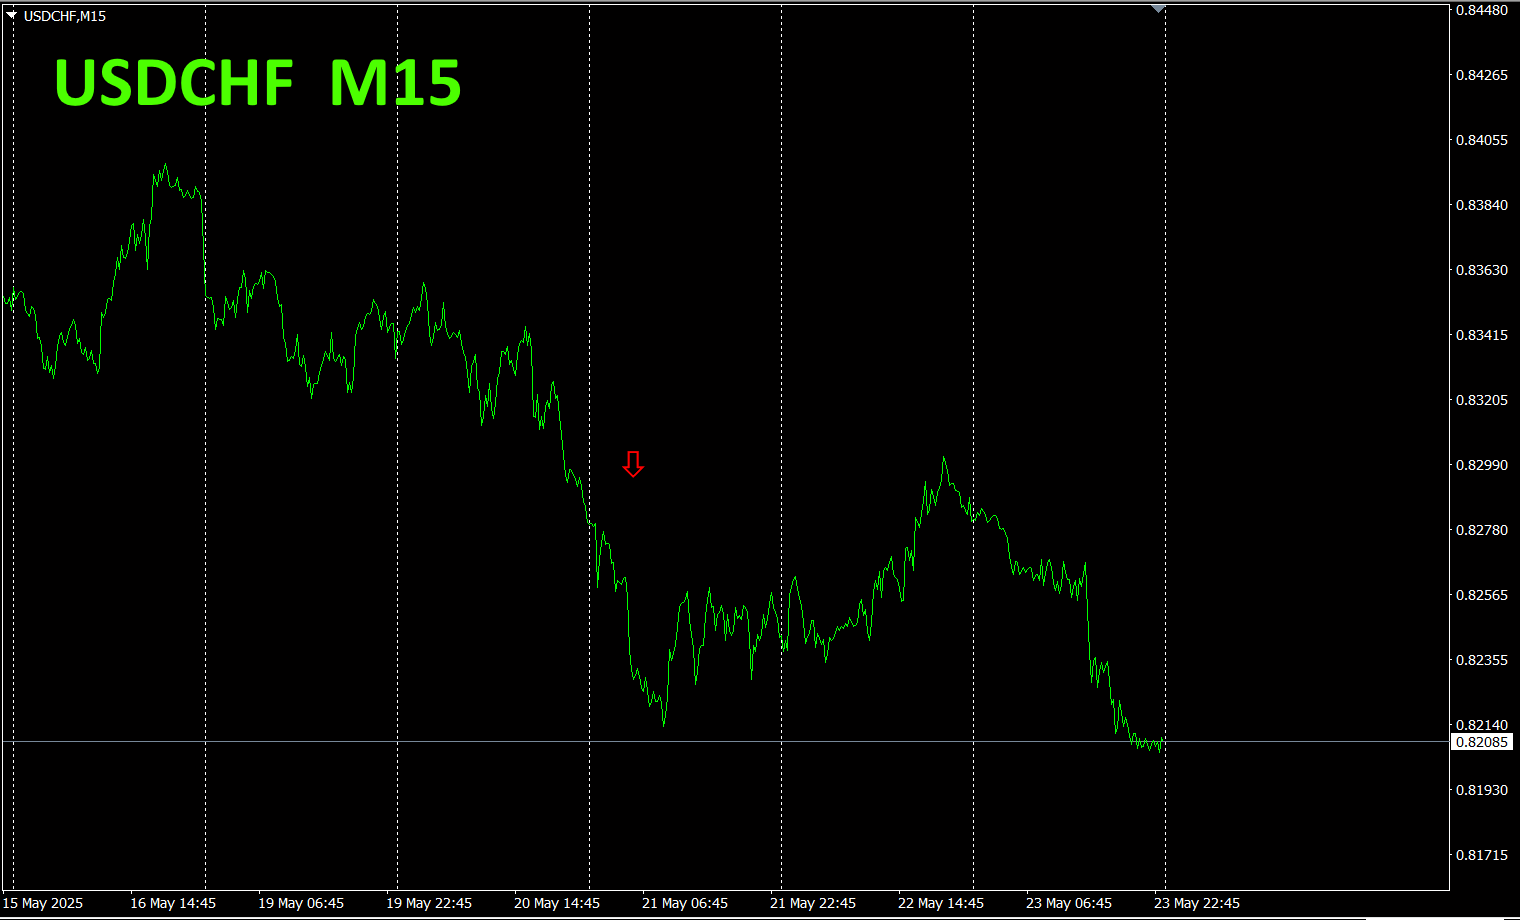
Now, let’s look at the chart for.
The red arrows indicate where the screenshot was taken. It captures the sharp drop during the middle of a downward trend.
“28 Currency Pairs Best Select enables easy identification of which currency among 28 pairs is experiencing the strongest trend. It also tells you whether you should trade now using numbers and colors. It allows you to judge all currency pairs’ movements at a glance.
“28 Currency Pairs Best Select Indicator”
https://www.gogojungle.co.jp/tools/indicators/35128

3. 2021 Year5 month to date EURJPY movement
year5 month onward EURJPY movement
To see the overall trend,30-minute chart shows about the last3 weeks.
Last time, I wrote as follows.
Pink isEUR, green isJPY. The currency strength chart showsJPY rising,EUR slightly declining. Therefore,EURJPY is expected to continue downward.
As expected, it has continued slightly downward.
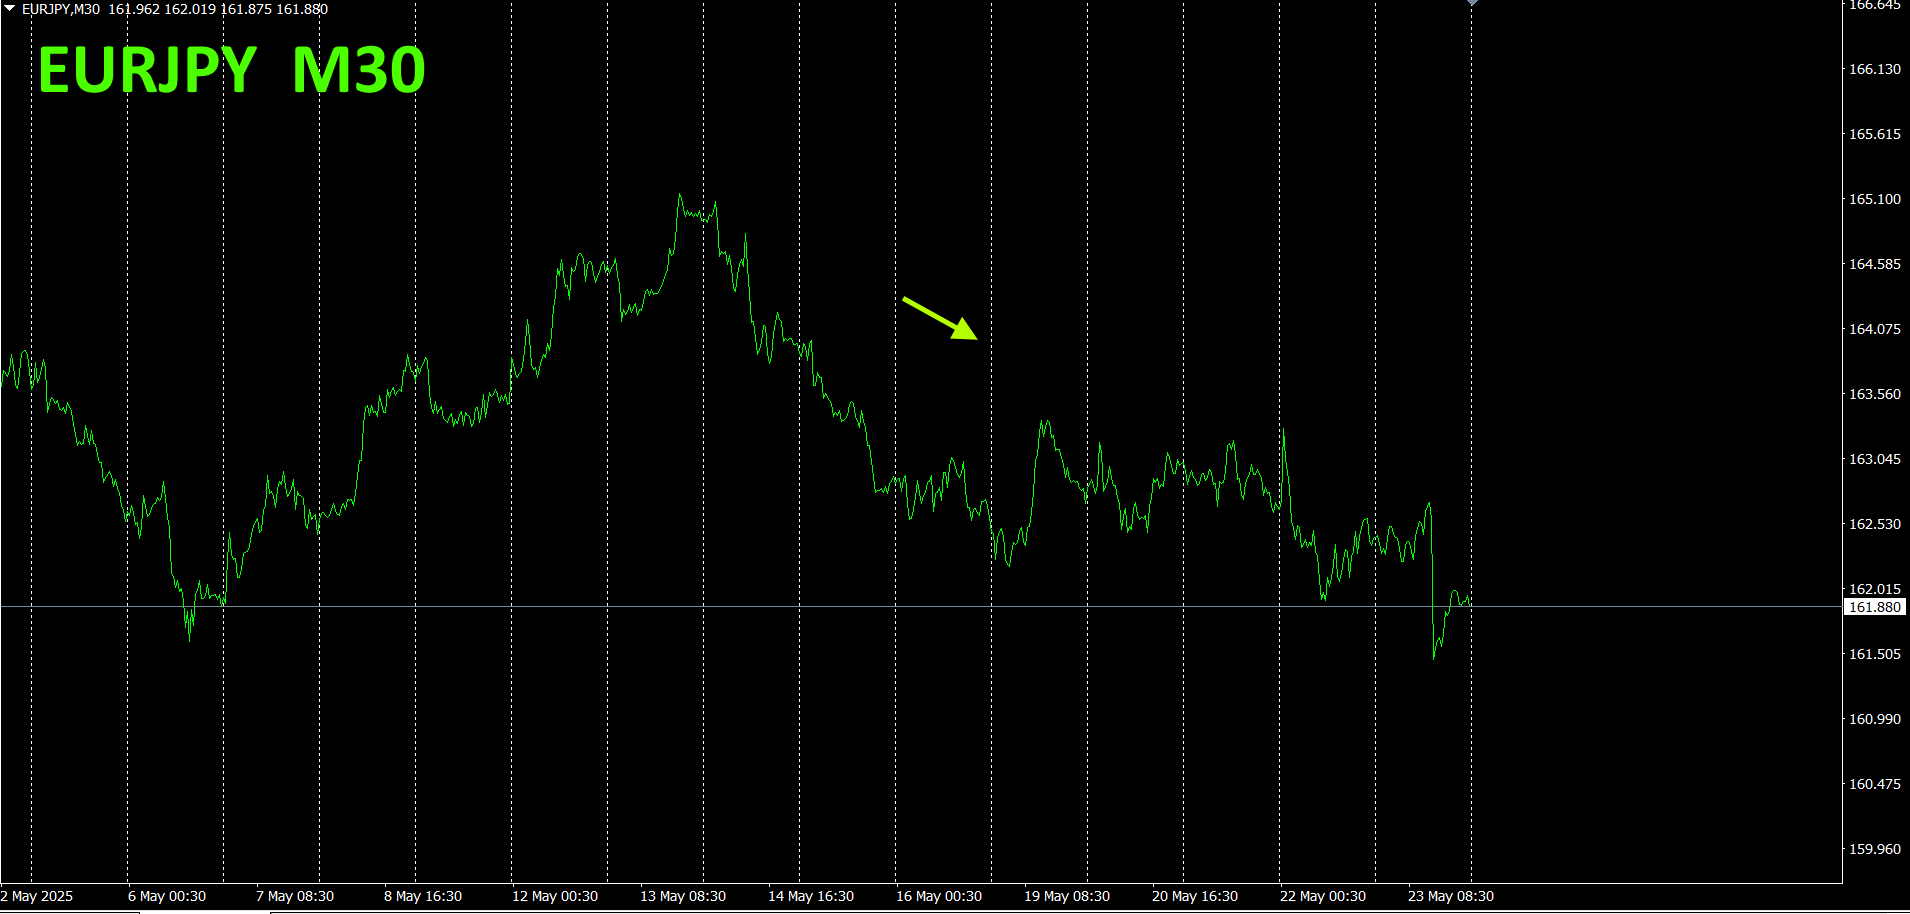
30-minute currency strength chart.
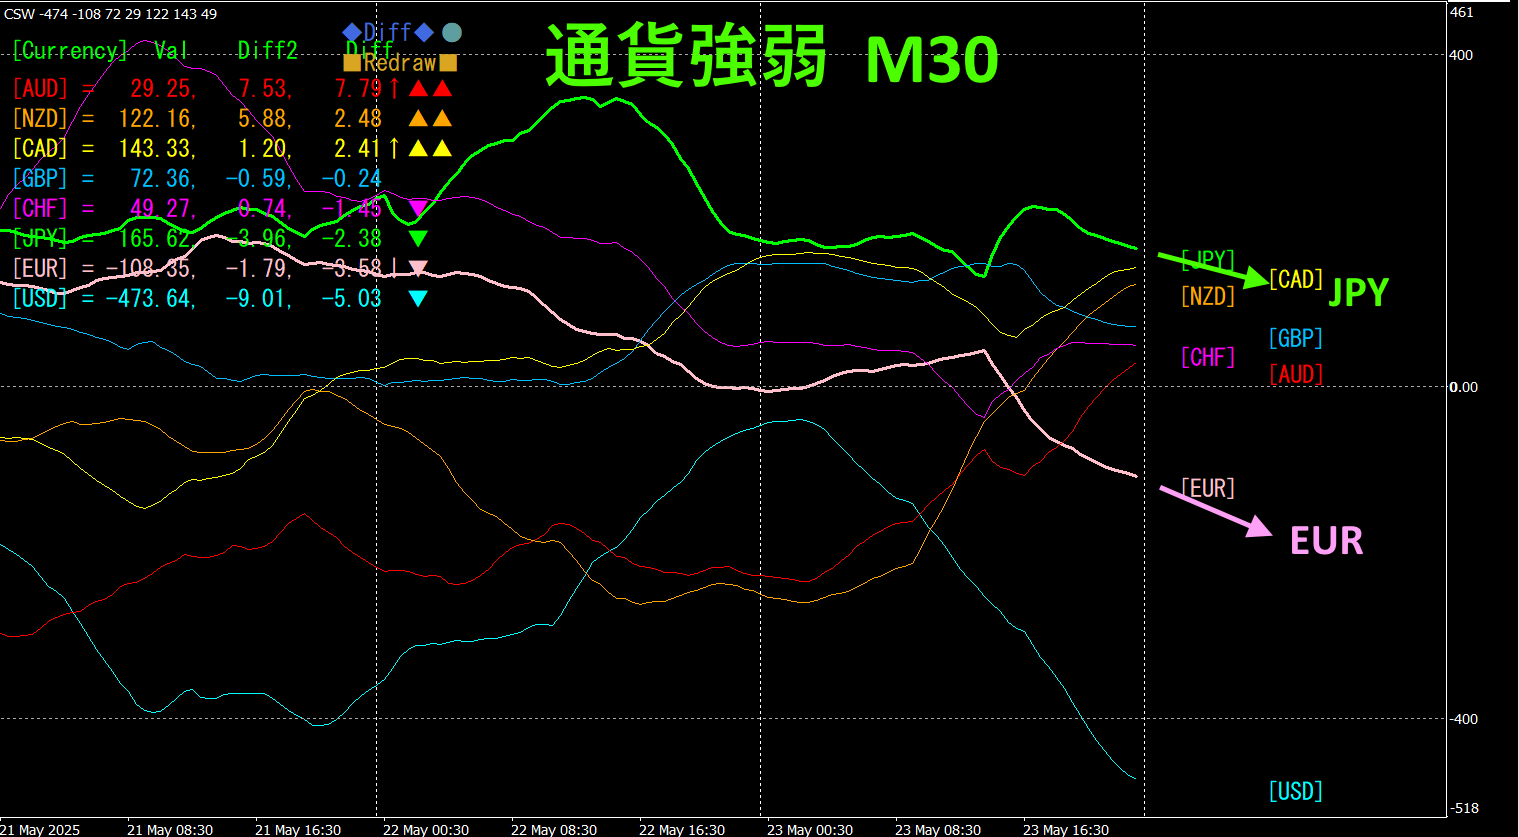
Pink isEUR, green isJPYEUR. The currency strength chart shows and both down, but’s slope value is negative and larger than, so is expected to continue slightly downward.
4.
New Indicator “Dual_MACD_Trend_Indicator” please see below.
MT4 version: https://www.gogojungle.co.jp/tools/indicators/62199
MT5 version: https://www.gogojungle.co.jp/tools/indicators/62202
A trend indicator that clearly shows direction with color. If the color bar turnsLime, it is a buy; if it turnsRed, it is a sell. It is easy for beginners to use. If the bar color is green, the trend is up; if red, down; if no color, there is no trend. With color display, you can grasp the trend state at a glance.
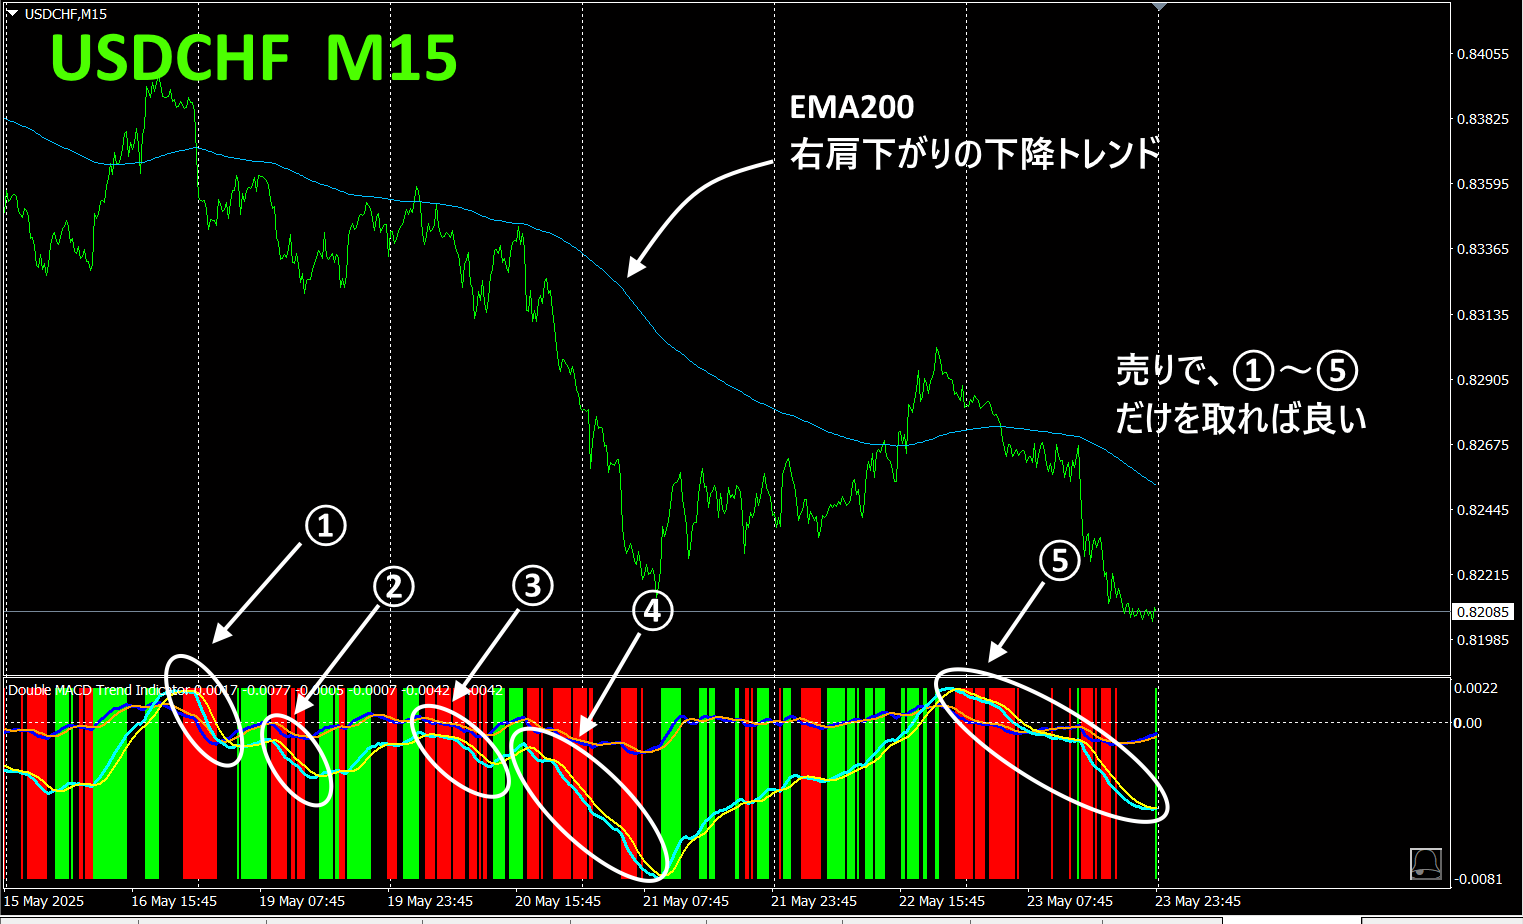
Now, I have applied this indicator to the on the-minute chart.
A moving average (EMA200) is included. Since the overall trend is downward, the only trade to consider is“Sell”. The target is when the indicator bar turns red and the long-termMACD graph is sloping downward. In the diagram above, items ① to ⑤ fit these conditions. In other places, you should“not trade”.
With thisDual_MACD_Trend_Indicator, trading becomes more decisive and you will no longer doubt the direction.
※ Recommended Indicators
“ToreTore Indicator”
https://www.gogojungle.co.jp/tools/indicators/50115
“TrendLine-EX”

https://www.gogojungle.co.jp/tools/indicators/42257
“8C Currency Strength Visualization Indicator” is described on the following page.

MT4 version https://www.gogojungle.co.jp/tools/indicators/39150
MT5 version https://www.gogojungle.co.jp/tools/indicators/39159
【Items I have on sale】


