

【GOLD5.19の日足分析】“寄付きから買い一色”の強気ローソク足をどう読む?
Hello, traders—this is Tengen.
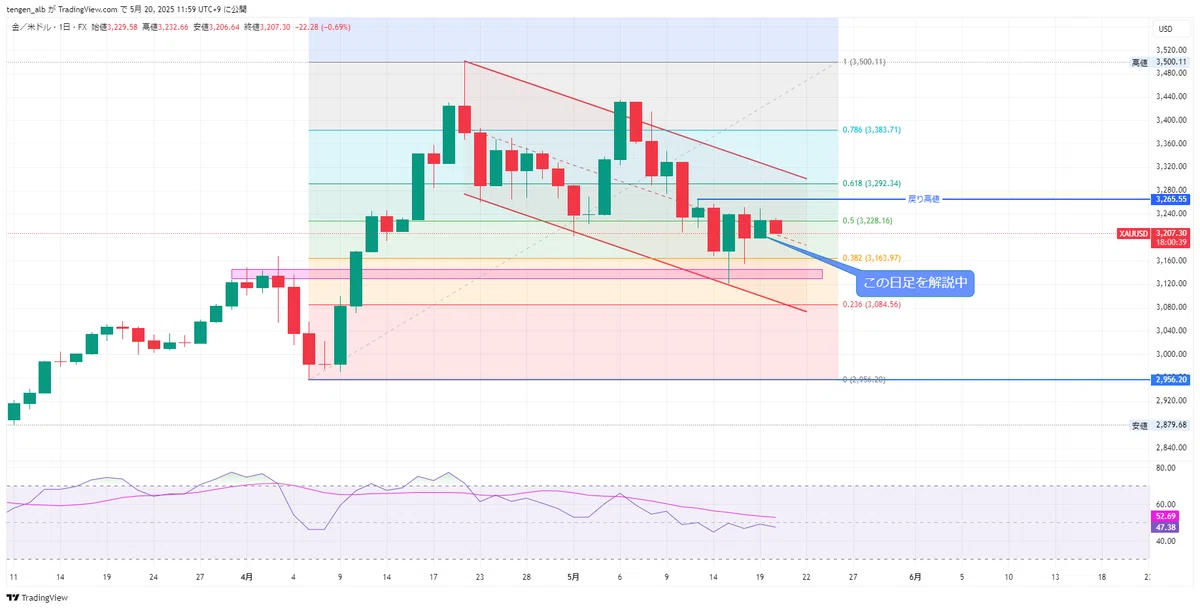
This time, based on the Gold (XAU/USD) daily chart from yesterday, May 19, I will perform a four-price technical analysis that even beginners can understand.
✅ GOLD Four Prices (OHLC) on 5/19
Open: 3,198.67
High: 3,249.76
Low: 3,198.67
Close: 3,229.58
Looking at this price movement, what can we read from it?
? Point ①: Open = Low → “No lower wick bullish candle”
The characteristic of this candlestick is,open and low are the same = no lower wick.
This implies that from the open to the close, buying was dominant.
In other words,a decisive upward move.
? Point ②: The close is slightly pulled back from the high
The high is 3,249.76, but the close is 3,229.58.
The slight pullback can be a sign of taking profits or selling into rallies.
However, since it still ended with a bullish candle, the buying bias remains in effect.
✅ How should a trader judge this?
From this daily chart, we can see:
✔ The uptrend is continuing
✔ Even with a temporary pullback, the overall bullish sentiment is strong
✔ The next point to watch iswhether the price can make a new high (break above 3,250)