

2025/5/19 Nikkei Futures Outlook
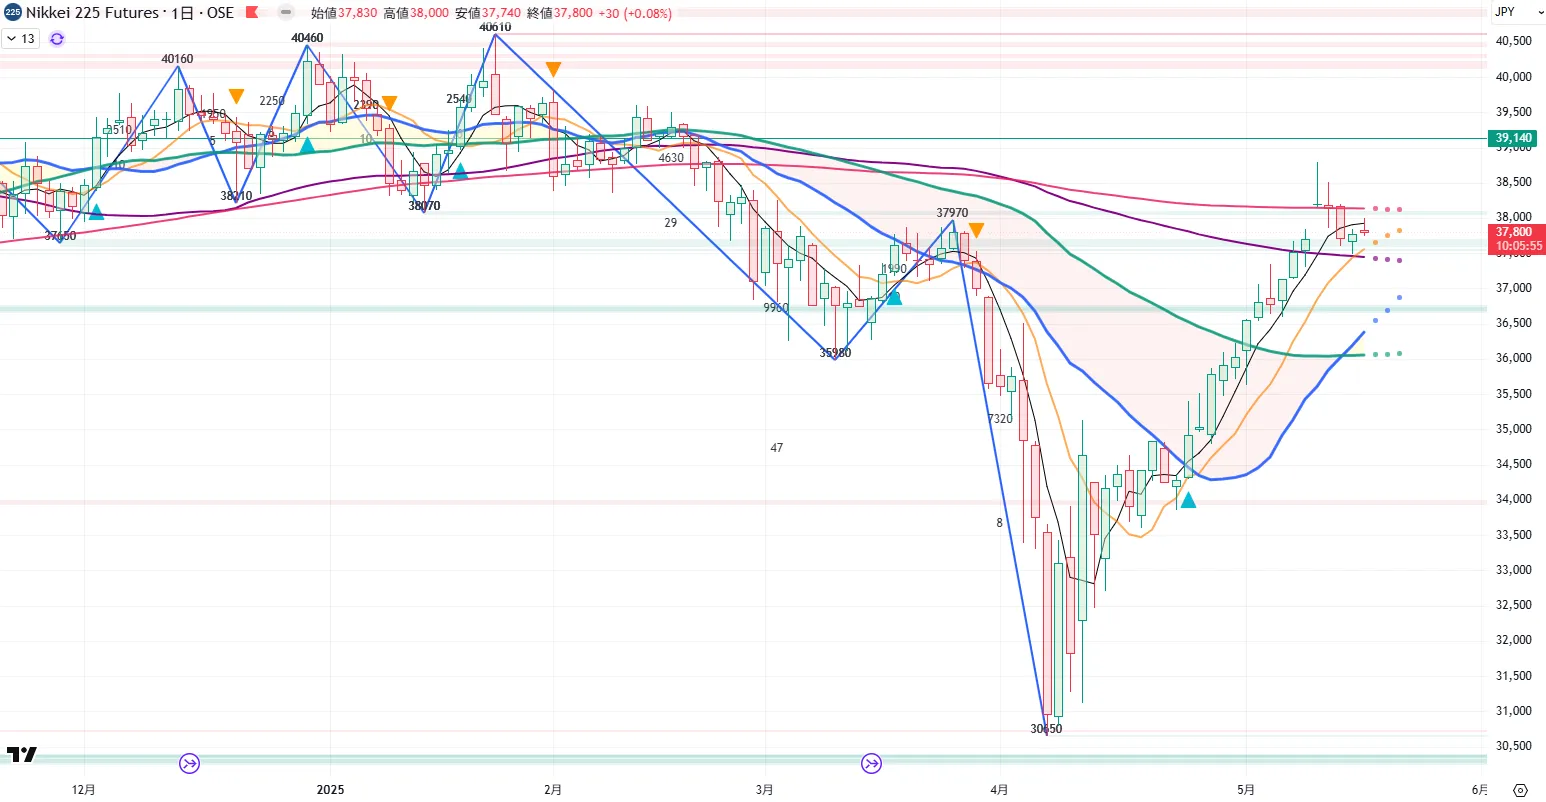
Daily
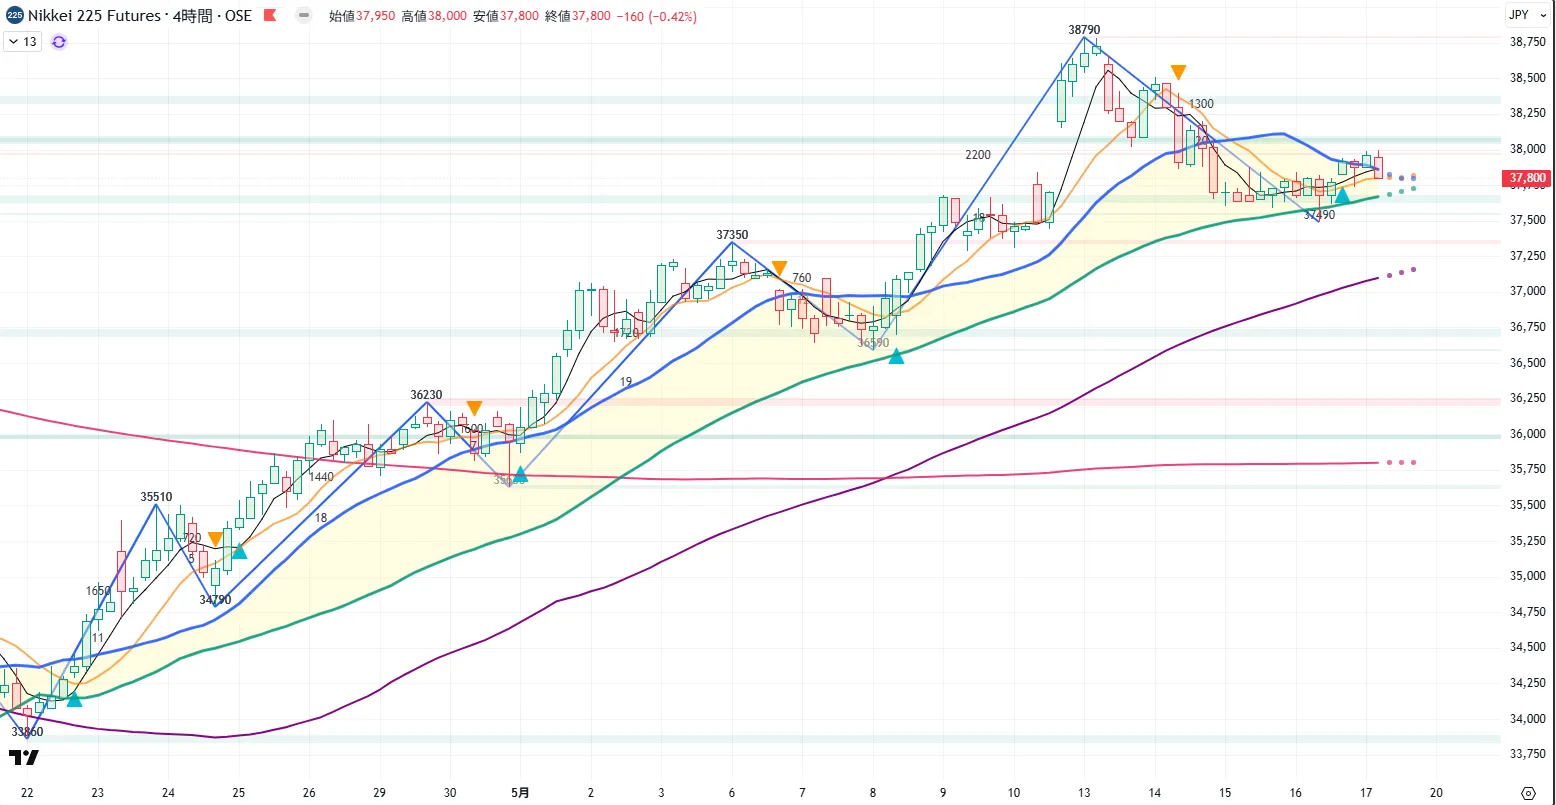
4-hour
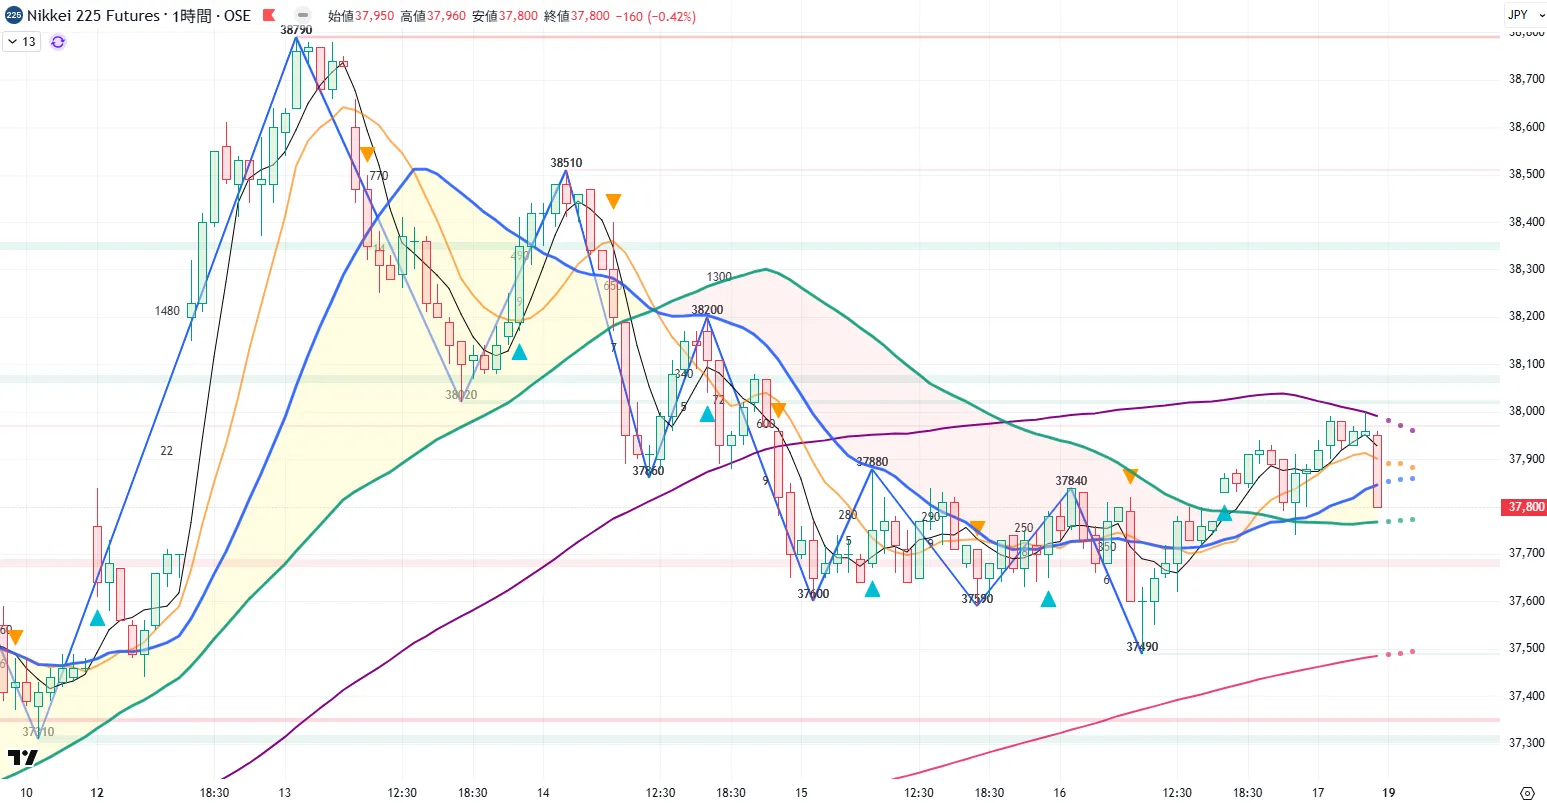
1-hour
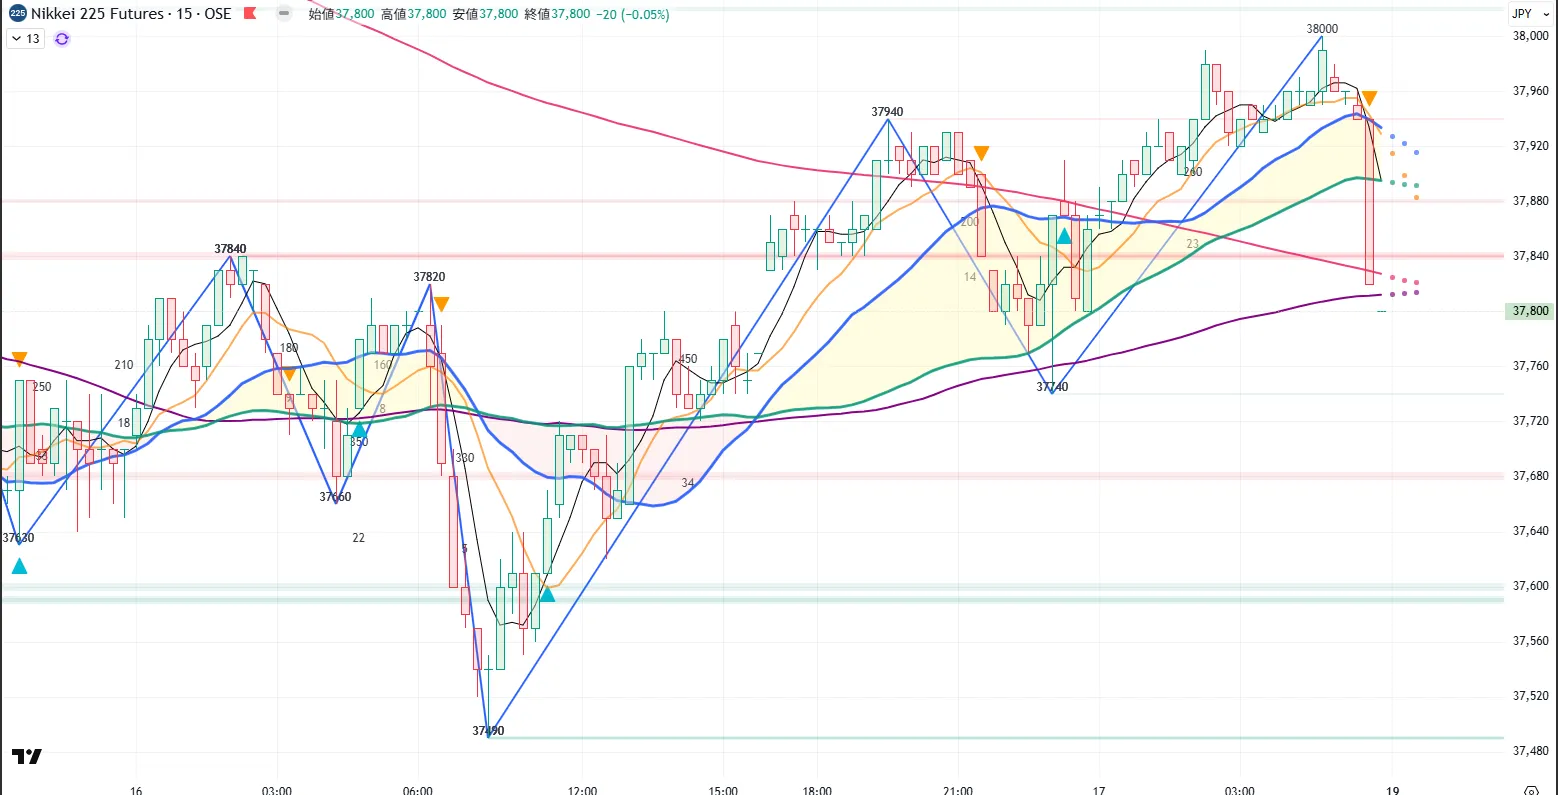
15-minute
Market Overview
Daily: trendless, rising wave, turning price at 37,480, downtrend wave
4-hour: uptrend, rising wave, turning price at 37,610, downwave
1-hour: uptrend, rising wave, turning price at 37,430, downwave
15-minute: uptrend, rising wave, turning price at 37,430, downwave
Overall Evaluation
During the night session, after the 15-minute, 1-hour, and 4-hour charts turned upward, the price was capped by the 100 MA on the 1-hour chart and the 20 MA on the 4-hour chart, pushing up to 38,000
After the NY close, Moody's downgraded U.S. Treasuries, so it was inevitable that the price would test lower
If the price breaks below the previous range zone lower bound around 37,500 and dives to 37,430, all timeframes will have a turning point in the wave
First, observe the 1-hour movement, and if a break below 37,430 occurs on a definitive candle, this pullback will be considered finished for now
In that case, the scenario targets around 36,500, which was the starting point of the upward move on the 4-hour chart; as a pullback, selling would be considered, but since 37,400 around the daily 100 MA and 10 MA are strong support, if it breaks through here by today's close, the flow would become a short
Even if it does not reach 37,430 and holds, it would be prudent to stay sidelined until the NY session tonight