

Usage of the "Visualization Indicator" (Part 199)
Utilization of the "Visualization Indicator" (part199)
1. Further evolution of the "28 Currency Pairs List Indicator" into an indicator
“8CPVisualization Indicator” to draw USDJPYUSDJPY on the chart
The “8CPVisualization Indicator” includesOceania edition,London edition,NewYork edition, AnyCP edition. This time, we used theLondon edition.
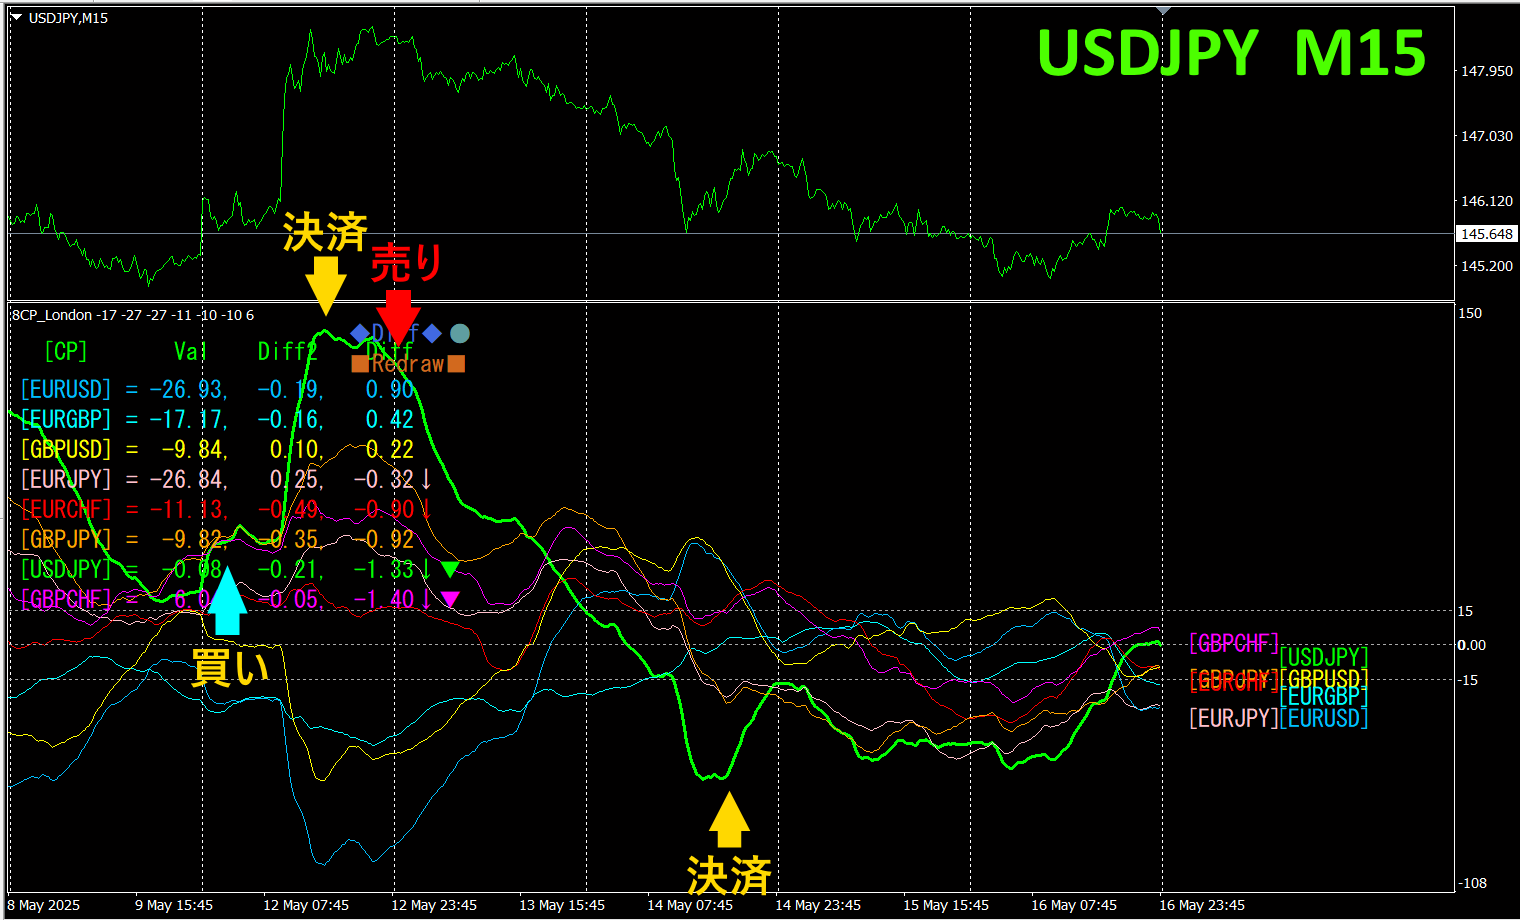
The upper half is a 15-minute chart of USDJPY. The lower half shows the chart based on the “8CPVisualization Indicator”; the green bold line graph corresponds to USDJPY.
On Monday, USDJPY rose above the other chart groups, so we entered a buy position. When the chart reached a peak, we closed the position and entered a sell when it started to reverse downward. Buy yielded about270 pips, while sell yielded about240 pips in profit. By aiming only at the parts that are rising, we consistently realize profits.
If you use “TrendLine-EX”, entry and exit can be automated at diagonal trendline breaks. You can leave it as is for easy trading. “TrendLine-EX” is a semi-automatic EA that can automatically sell on a trendline break below and automatically settle on a trendline break above.
2. Best SelectIndicator trial
The image below shows a screenshot onMay 14, 2025,01:18 (JST).
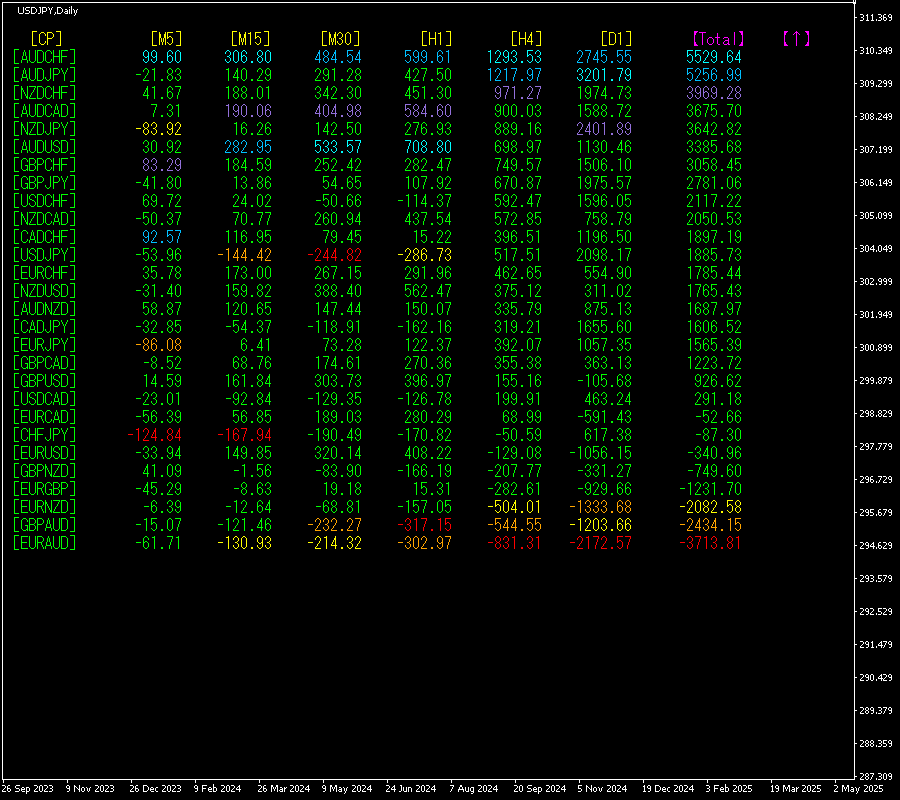
The numbers are arranged in descending order. At the top, AUDCHF is blue across all timeframes.Total value is5529.64, a large positive number. This indicates a strong upward trend for AUDCHF.
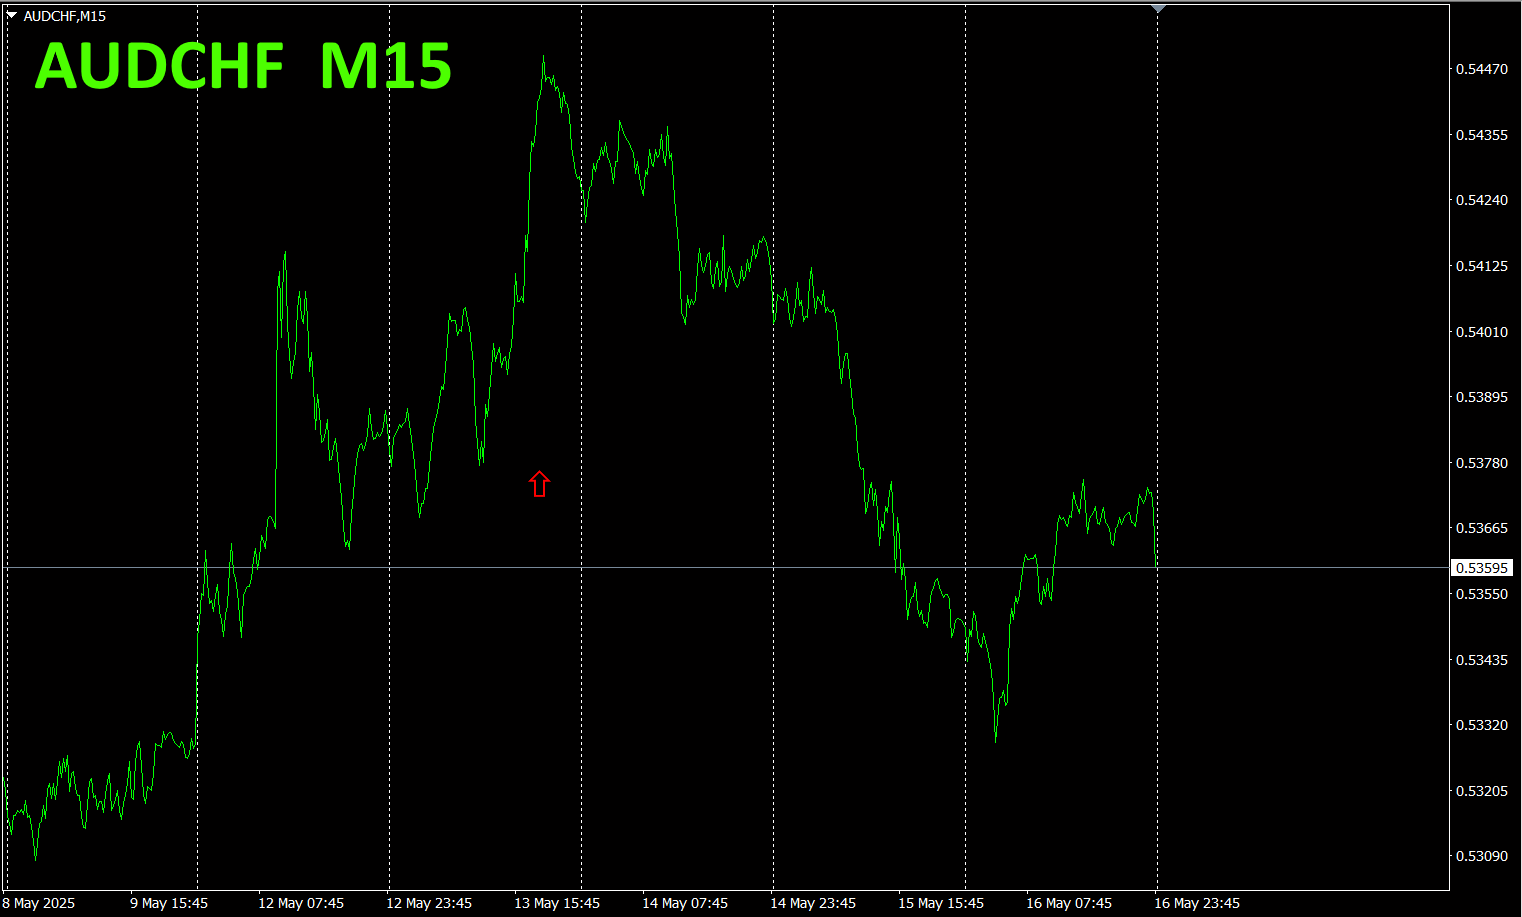
Now, let's look at the AUDCHF chart.
The red arrows indicate the point where the screenshot was taken, capturing a sharp rise during the uptrend.
“28 Currency Pairs Best Select Indicator” enables you to easily identify which currency among the 28 pairs is currently exhibiting the strongest trend. It also indicates whether you should trade now using numbers and colors. It allows you to assess all currency pairs at a glance, making it a superb indicator.
“28 Currency Pairs Best Select

https://www.gogojungle.co.jp/tools/indicators/35128
3. 2021 year5 month to date movement since May
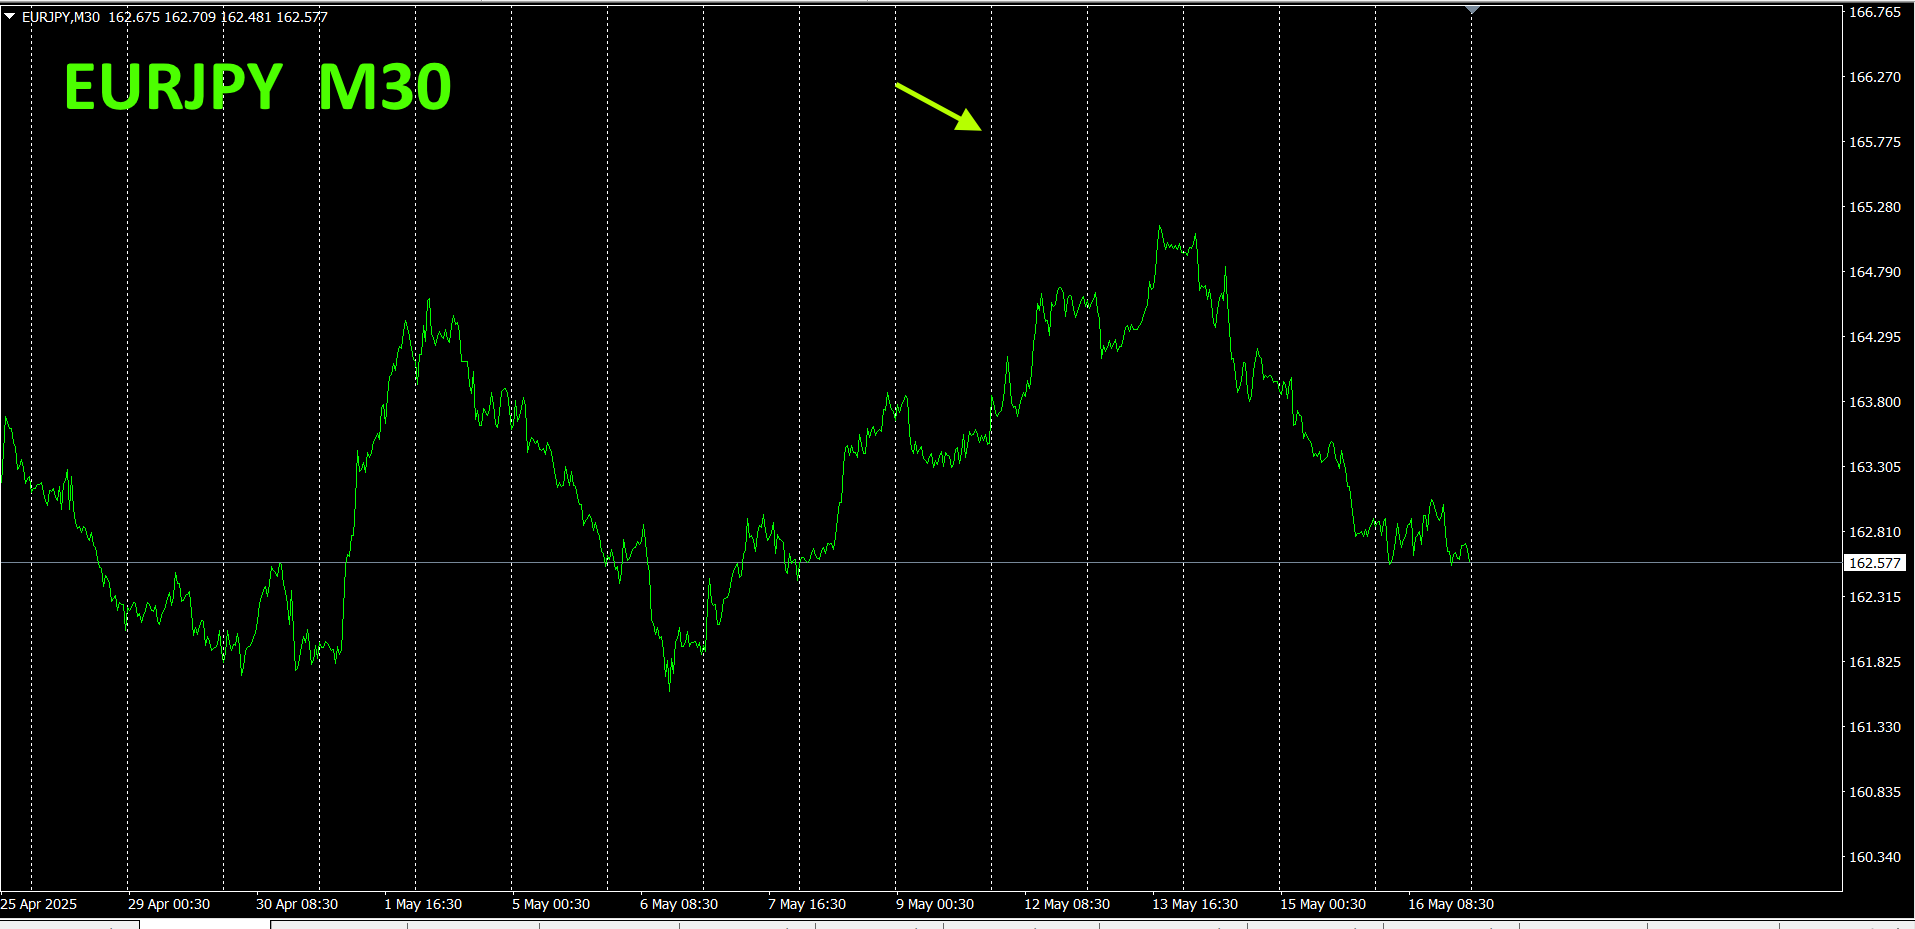
2021 year5 month onward EURJPY movement observed.
To view the overall trend, a30-minute chart covering roughly the last3 weeks is drawn.
Previously, it was described as follows.
Pink indicatesEUR, green indicatesJPY. The currency strength chart showsJPY is slightly rising from a horizontal line, whileEUR is moving downward. Therefore,EURJPY is expected to trend slightly downward.
Indeed, it topped out and moved downward.
30-minute currency strength chart.
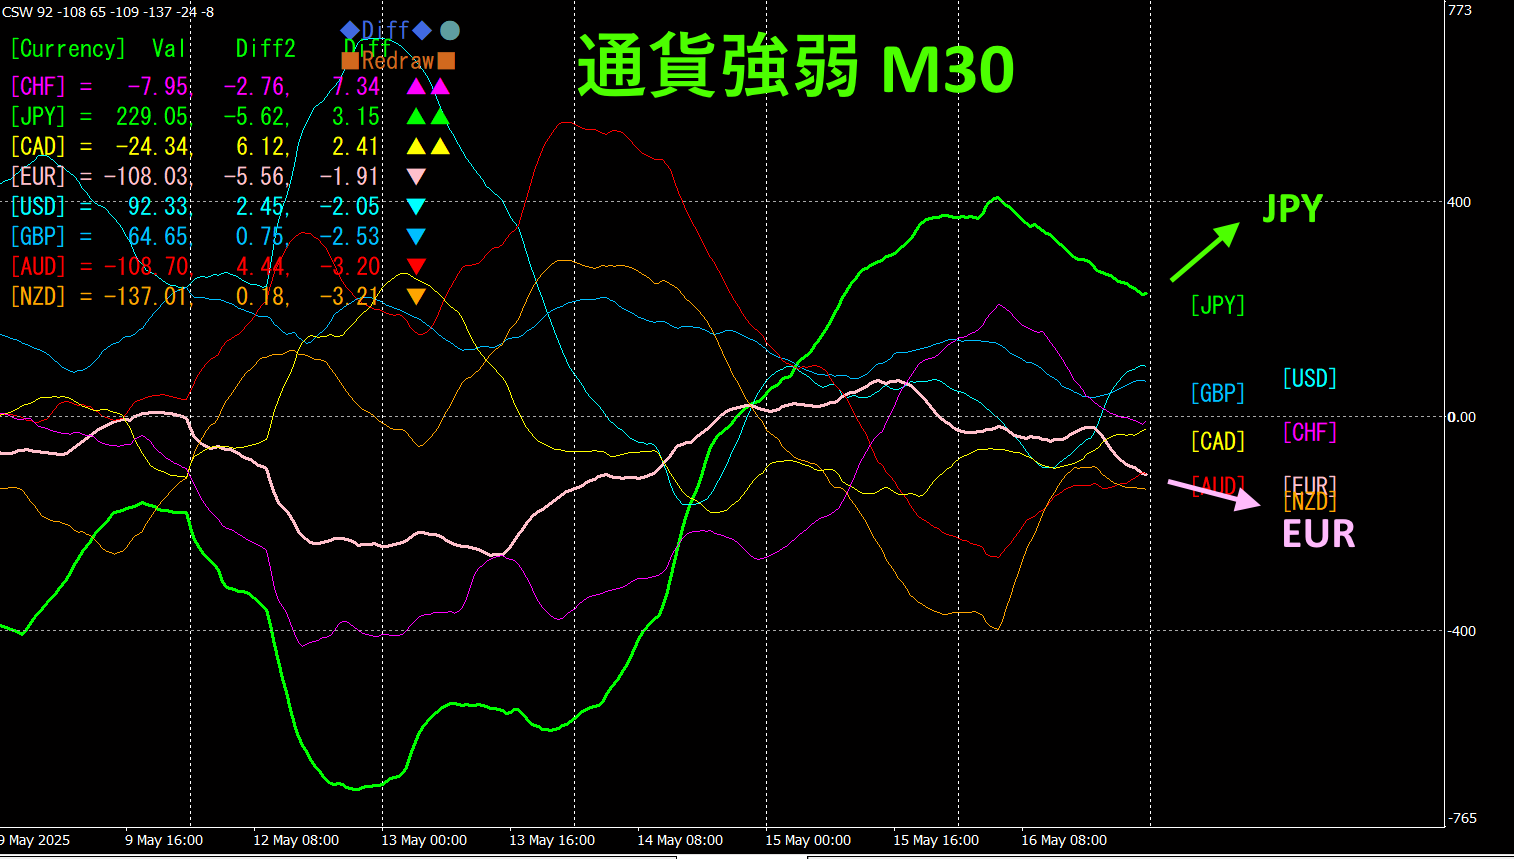
Pink indicatesEUR, green indicatesJPY. The currency strength chart showsJPY moving upward andEUR slightly downward. Therefore,EURJPY is expected to continue downward.
4.
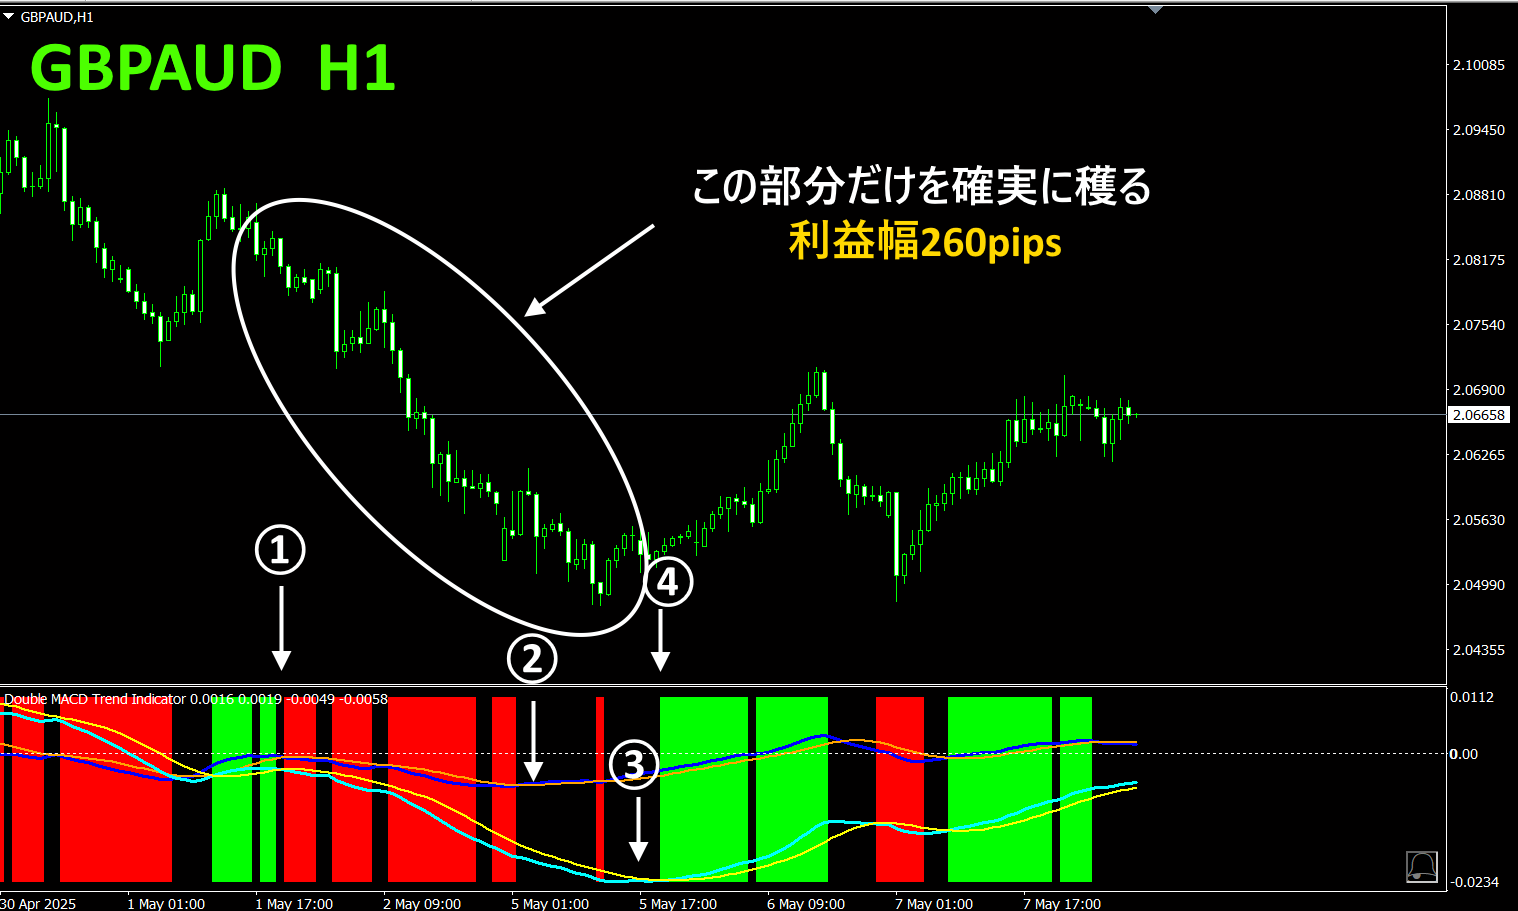
We have released a new indicator “Dual_MACD_Trend_Indicator.”
MT4 version: https://www.gogojungle.co.jp/tools/indicators/62199
MT5 version: https://www.gogojungle.co.jp/tools/indicators/62202
An indicator that clearly shows the direction of the trend with color. When the color bars switch toLime, it indicates a buy; when it switches toRed, it indicates a sell. It is an easy-to-use indicator for beginners.
In the sub-window, the bars and graphs indicate trend status: green bars mean an uptrend, red bars mean a downtrend, and no color means no trend. The color display lets you grasp the trend at a glance.
For more details, please see the product page.
※ Recommended indicators
“Toretore Indicator”
https://www.gogojungle.co.jp/tools/indicators/50115
“TrendLine-EX”
https://www.gogojungle.co.jp/tools/indicators/42257

The “8C Currency Strength Visualization Indicator” can be found on the following page.

MT4 version https://www.gogojungle.co.jp/tools/indicators/39150
MT5 version https://www.gogojungle.co.jp/tools/indicators/39159
【My other listed products】


