
【Secret Report】Effective Use of ZONE_ELLIOTT, Part 6
Zone_Elliott Secret Report (PDF version) is here ↓
https://www.gogojungle.co.jp/finance/navi/articles/89611
The contents of the report are as follows.
Introduction
Part 1 About Elliott Wave Theory
Part 2 About Dow Theory
Part 3 About Fibonacci
Part 4 About Multi-Time Frames
Part 5 Introduction to Zone_Elliott features
Part 6 How to effectively use Zone_Elliott
Part 7 Master Zone_Elliott (Paid)
Part 6: How to Effectively Use Zone_Elliott
This is where the real content begins, not an overstatement.
We have explained at length, and this chapter discusses how to apply Zone_Elliott in the market to win. When you understand the market, tasks that previously seemed unwinnable can suddenly become winnable.
When reviewing your past trades, you’ll find many moments where you think, “Why did I buy here?”
From now on, whether you win or lose, your winning rate will skyrocket as you understand why you won or why you lost. “I won by luck” does not last long.
With that in mind, please look at the following charts.
Developing the Skill to Read the Market with Zone_Elliott Part-1
▼ USDCHF H4
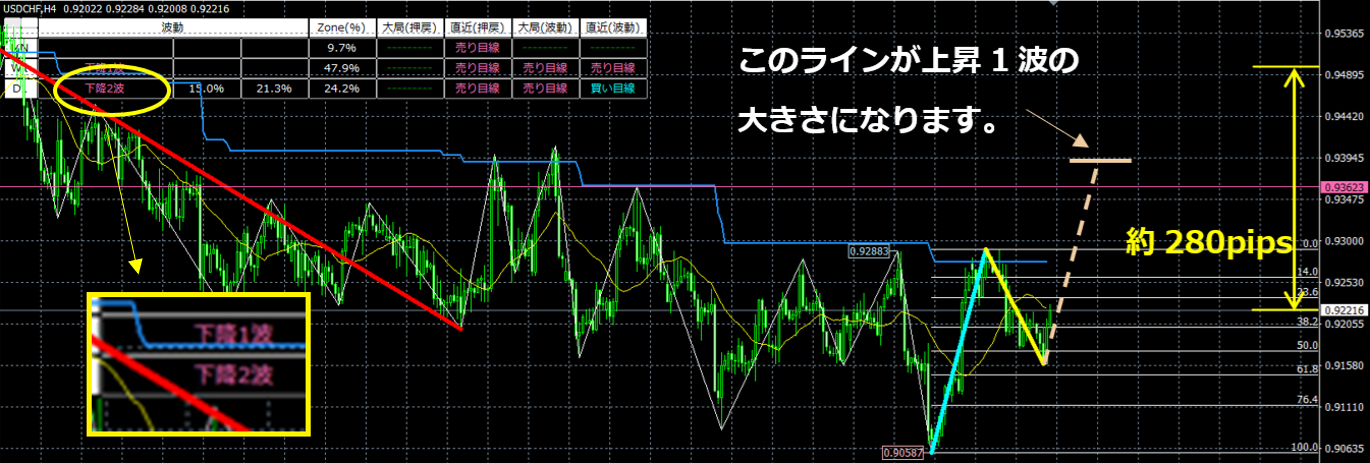
In H4, during the second up-move, price retraces to around 50%–61.8% and then rises a bit.
On the chart, this could rise to form the third up-move, potentially extending to about the size of the first up-move?
The higher timeframe D1 is in a down 2-wave. That means the direction is the same. How should we think about this?
Now, let’s look at the D1 chart.
▼ USDCHF D1
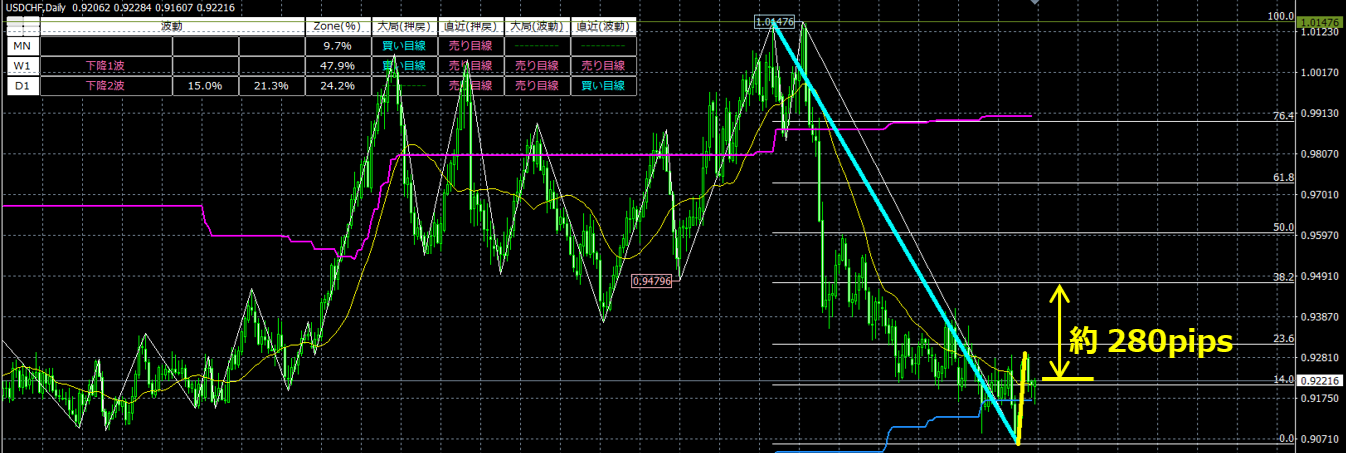
D1 is in a down 2-wave, but how far will the retrace go? Consider this.
For example, if the retrace could go up to 38.2%, that would be about 280 pips.
▼ Back to USDCHF H4 again.
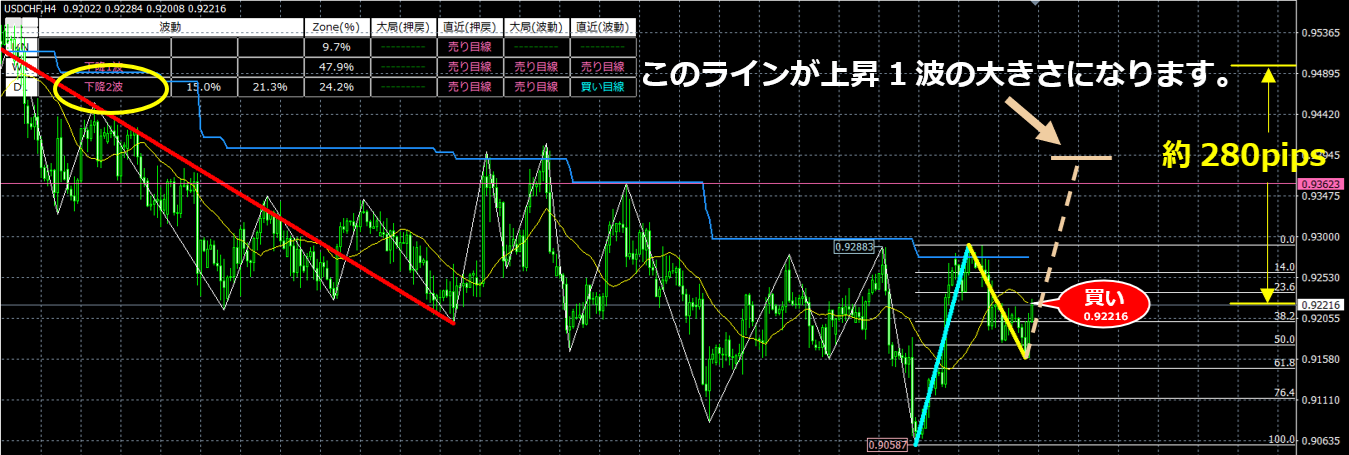
If the D1 down 2-wave retraces to 38.2%, it would retrace to the yellow arrow level. Imagining it, the end point of the H4 up 5th wave might be near that position.
Anyway, I think it is reasonable to buy with the expectation that the D1 down 2-wave retrace reaches around 38.2%, taking profit from the size of the up 1-wave.
▼ Let’s continue with USDCHF H4.
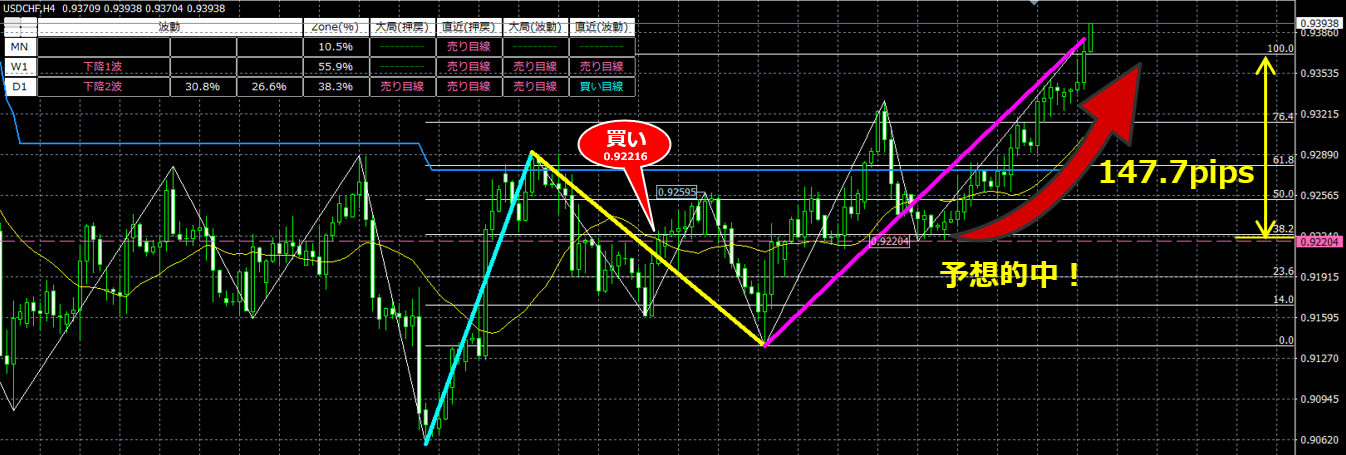
The up 3-waves extended to the size of the up 1-wave!
As expected! This is a trade result based on the relationship with higher timeframes.
What do you think? It’s not anything difficult.
On the 4-hour chart, when the up 2-waves retrace to about 50%–61.8%, and you ask, “Now what?”, checking the higher timeframe shows a down wave, but a down 2-wave means a temporary up move during the decline.
Furthermore, with the down 2-wave having just occurred and retracing to 21.3% while currently at 15.0%,” my expectation was that it would retrace up to about 38.2% at least. Generally, the probability of the second wave not retracing to 38.2% is low, so I predicted at least up to 38.2% would retrace.
Moreover, if it retraces to 38.2%, that would be nearly 280 pips from the current price.
Seen on the 4-hour chart, since this value is larger than the size of up 1-wave, it would still be up to the up 1-wave size even before retracing to 38.2%.
In other words, there is a high likelihood it would extend to the size of up 1-wave, so buying entered and the result matched the forecast, earning 147.7 pips.
In this way, it is important to think about what to do by looking at the higher-timeframe situation.
Zone_Elliott: Developing the Skill to Read the Market Part-2
▼ GBPUSD H4
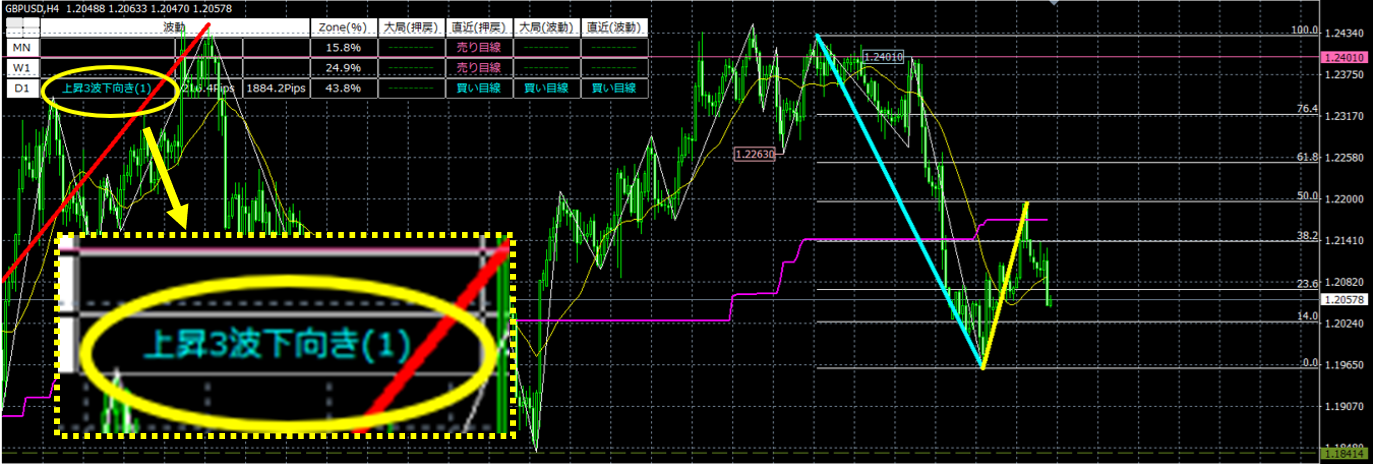
In H4, it is in a down 2-wave, retracing to around 50% and nearly 20%.
From here it could move down to form a down 3-wave and extend about as large as the down 1-wave?
The higher timeframe D1 is in an up 3-waves. That means the direction is opposite. Should we skip this situation?
Now, let’s look at the D1 chart.
▼ GBPUSD D1
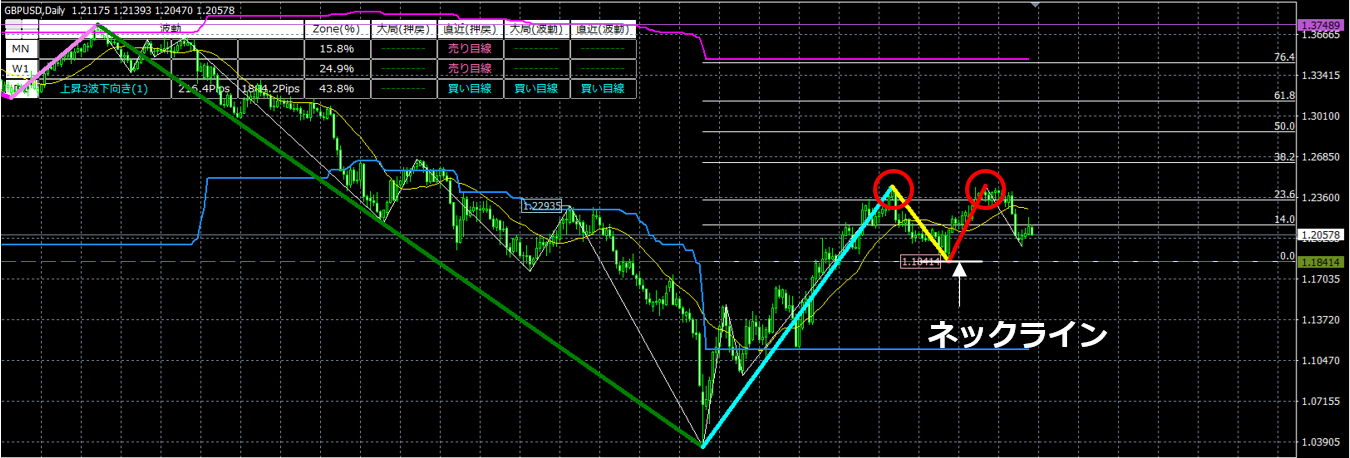
D1 is in an up 3-waves, which is opposite to H4.
However, look carefully at the D1 chart. Even though an up 3-wave occurred, the up move is almost absent, and price has fallen near the start point of the up 3-wave.
It can also look like a W-top (red circle with two points), and it seems like it could break the neckline and decline.
Judging the D1 state at this moment is difficult.
Generally, it is still an up-move since the up 3-wave is in progress.
However, if price breaks below the neckline, the up-wave would end and a decline is possible.
In any case, with no clear direction yet, skipping is the sensible option.
Let’s go back to the H4 and see what happens next.
▼ GBPUSD H4
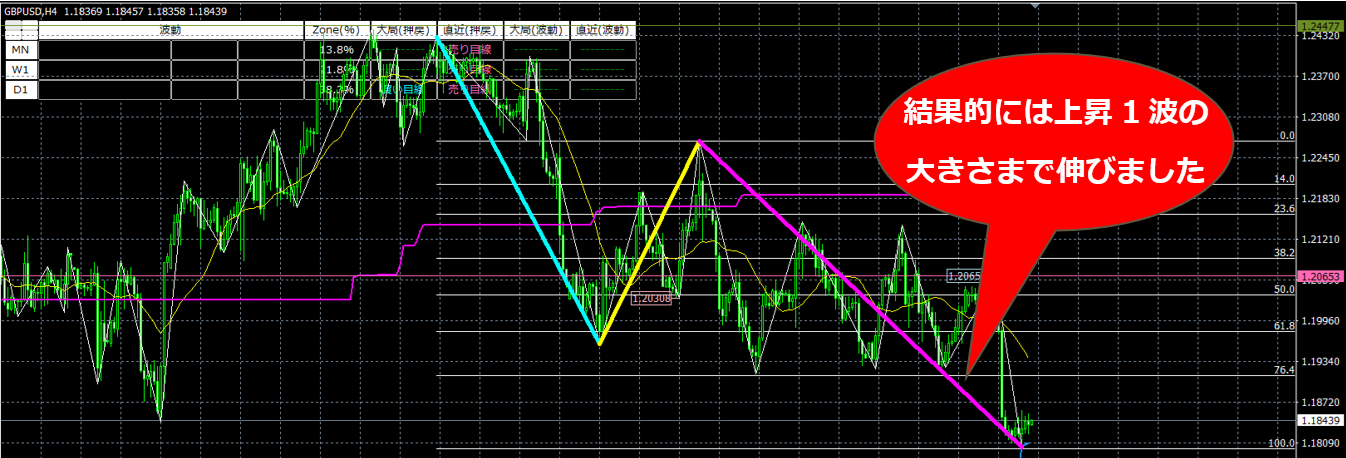
I decided to skip based on the D1 situation, but in hindsight the down 3-waves extended to the size of the down 1-wave, so a short entry would have won.
However, repeating “I won in the end” does not grow your funds. The result is the result; trust your own analysis.
This time, if you had shorted on the H4 after the result, you might have thought “I should have entered,” because price fell to the size of the down 1-wave.
But that would have been a mistake. When checking the higher timeframe D1, the higher timeframe is in an up 3-wave and will generally rise. Yet in a W-top-like situation, there is a possibility of decline.
Both possibilities exist.
Key point: if you think it is a W-top, price must break above the neckline. If it breaks above the neckline (the start point of the up 3-wave), the D1 up movement ends, making a decline more likely.
Therefore, if price breaks above the neckline, you can confidently decide that a W-top has formed and price will fall, so it is fine to short on the H4 as well.
However, in this case, since it is in the middle of an up 3-wave and has not yet broken the neckline, there is no basis to consider a short entry, so it was correct to skip the H4 short entry.
Rather than saying “I should have entered a short position,” it is important to have a clear reason for entering. If there is no clear reason, even in Zone_Elliott, do not believe 100% and skip.
This becomes the ability to read the market, increasing trades only at high-precision points and reducing wasted trades, which is essential for consistently winning in FX.
Zone_Elliott: Developing the Skill to Read the Market Part-3
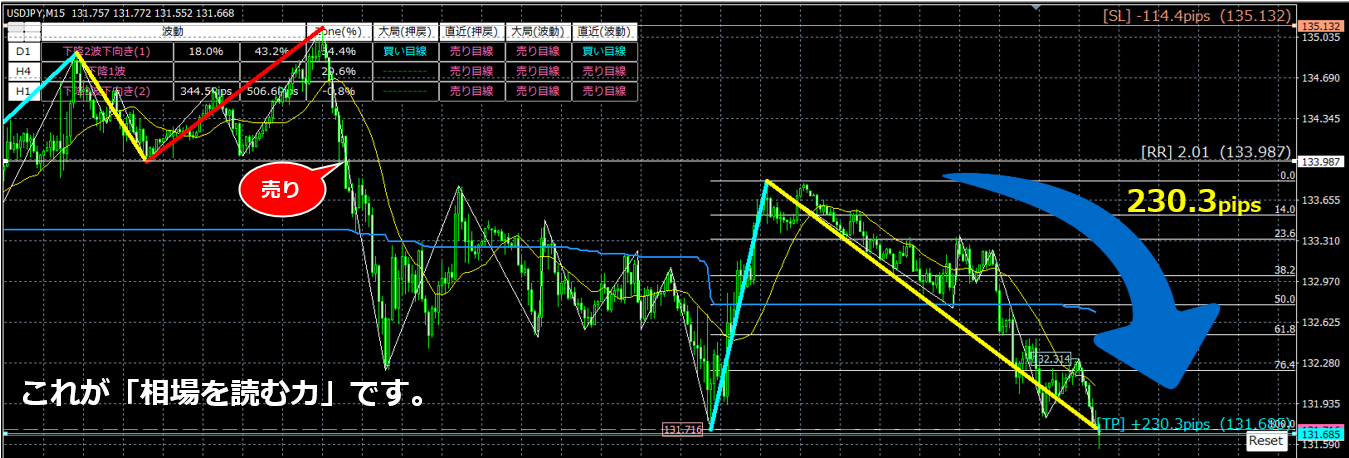
▼ USDJPY M15 Next, let’s examine using a slightly smaller time frame (M15).
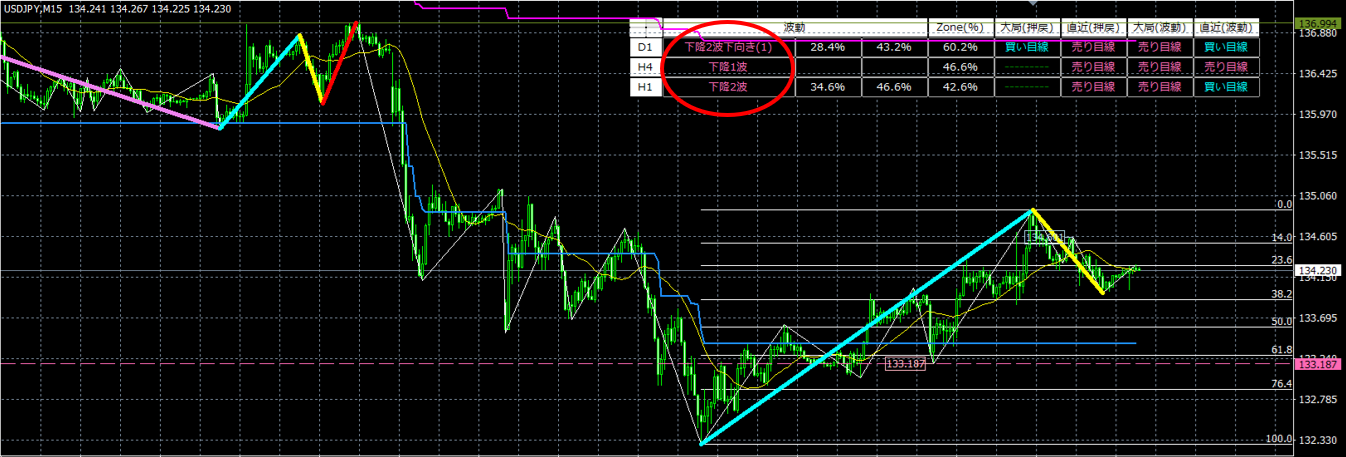
In M15, price is in an up 2-waves retracing to about 38.2% and then rising to near 23.6% again.
From here, it could rise into an up 3-wave and extend to roughly the size of the up 1-wave. Let’s think about it together‼
All higher timeframes are in a downtrend, and in reverse, it looks very risky. Let’s check the higher timeframes.
▼ USDJPY H1
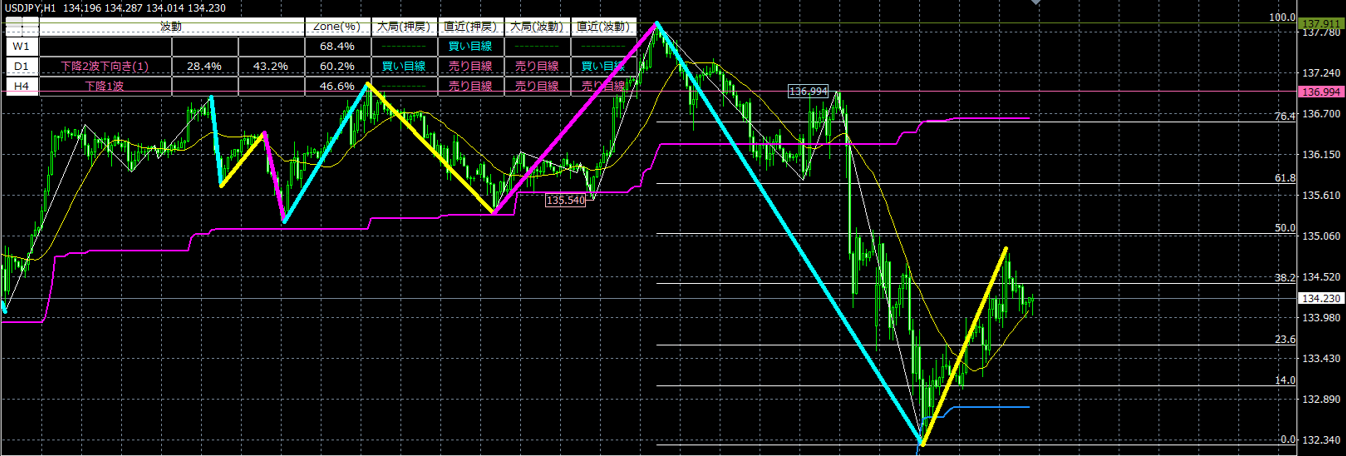
In H1, the direction is opposite to M15, with a down 2-wave. After retracing near 50.0%, it is now declining toward around 35.0%. This is opposite to M15.
Let’s also check the next higher timeframe H4.
▼ USDJPY H4
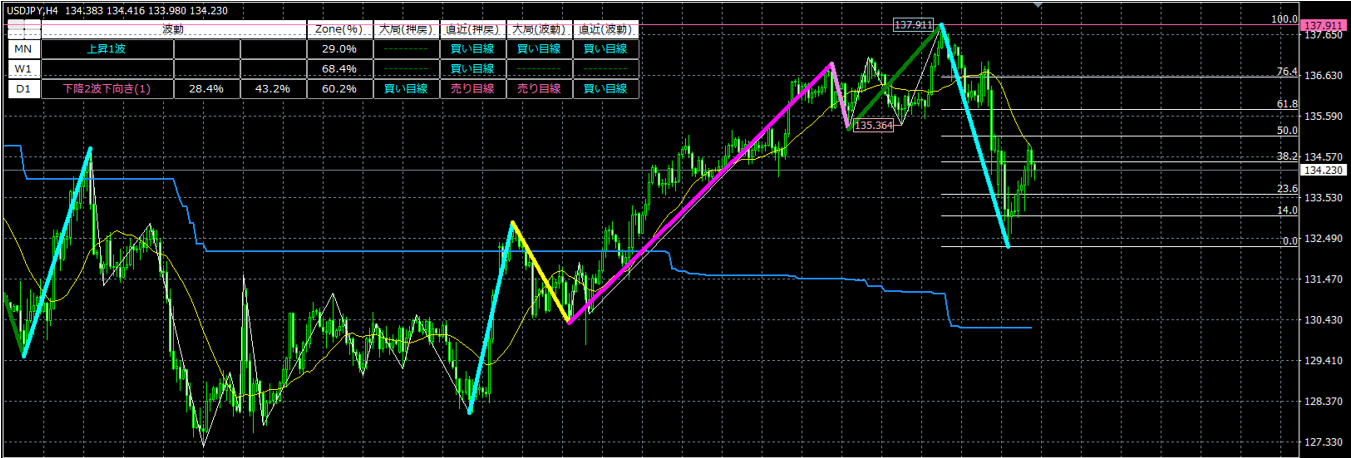
In H4, after the up 5-wave, a down 1-wave is occurring.
Higher timeframes show H4 in a downtrend and H1 also in a downtrend.
M15 is in an up 2-waves, but given the higher-timeframe context, it’s hard to expect a strong up 3-wave on M15 to extend significantly.
Let’s go back to M15 and watch what happens next.
▼ USDJPY M15
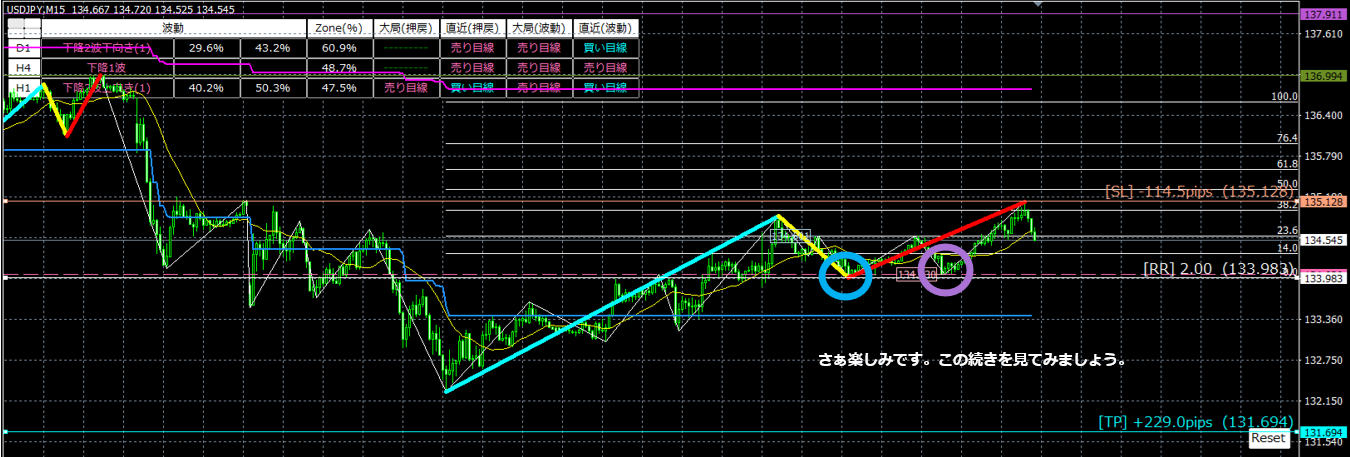
The purple circle marks a support. If price breaks below this, the view shifts to a “sell” bias.
If it breaks below the blue circle, the “uptrend” ends.
Since both H1 and H4 are in downtrends, once price breaks below the purple circle to a sell bias, and then breaks the blue circle to end the uptrend, it would be reasonable to consider selling at that timing.
What about stop loss and take profit?
Use RiskRewardChecker to determine stops and targets.
* RiskRewardChecker is currently free for the first 100 buyers.
Place the stop at the most recent ZigZag high, and since both higher timeframes (H1, H4) are in a downtrend, set the take profit at 2x the stop.
Since the direction aligns with the higher timeframes, I would trade with confidence and expect a 217.8 pips gain. Good luck‼
Now, let’s see what happens next.
▼ USDJPY M15
Through this trade, you should have a clear understanding of how crucial it is to grasp the higher-timeframe context when trading.
I may sound confident, but it’s not about complexity. A little effort can change performance dramatically.
Zone_Elliott allows you to gauge multiple higher-timeframe conditions on a single chart, enabling quick judgments on whether to go or stay. If you need more detail, you can analyze the higher-timeframe situation further to make correct decisions.
Above all, trading with confidence is essential. When confidence is lacking, it is wise to avoid trading rather than forcing it.
... Sorry for the abrupt ending, but the free公開 ends here. For purchasers, future sections remain freely viewable, so there is no need to worry.Purchasers can download for free. A one-time password will be issued, so please download and save.
From here on, we will go into more advanced Zone_Elliott usage and mindset.
In FX, only about 10–20% survive, but what the losers have in common is trading with information that anyone can access on the net.
On the internet, there is both correct and incorrect information about Elliott Wave, multi-timeframe analysis, etc. If you do not discern properly, you may adopt incorrect methods. Whether information is correct is often revealed only after you exit the market.
The development history of Zone_Elliott began with Elliott Wave being a post-hoc theory. We sought a way to draw it automatically, without rewriting, so that it could be drawn correctly in real time.
Upward move 1 occurs after price breaks above the retrace high; downward move 1 occurs after price breaks below the push-low. Once move 1 is confirmed, moves 2 and 3 are drawn. Those of you reading this likely want to know about a third wave that extends beyond move 1. Most information on the net only describes the extended 3rd wave after the fact.
In practice, when price breaks above the retrace high and an up 1-wave forms, the up 3-wave often does not extend much. This is the challenge in automatically drawing Elliott Waves.
Zone_Elliott defines up 1-wave only when price breaks above the high, and down 1-wave only when price breaks below the low from the high region.
This reduces many false moves, but not all.
Therefore, the same chart shows the state of the higher timeframe to help determine whether the Elliott wave drawn by Zone_Elliott is correct.
First, understanding Elliott Wave and Dow Theory helps you understand the market more easily. Many people display indicators like MA, MACD, RSI on charts, but Elliott Wave is essential for understanding market flow and building the “ability to read the market.”
To understand Elliott Wave, you need knowledge of Dow Theory, Fibonacci, swing highs/lows, resistance/support, multi-timeframe, and more. Combining these enhances your ability to read the market significantly.
The following information is not about pinpointing one lucky entry.
Zone_Elliott focuses on clarifying which directions should be avoided and, in the end, stacking wins in a defensive manner to protect and grow capital.
We sincerely hope the paid information in the future will be of great help to you.
Zone_Elliott Secret Report (PDF version) is here ↓