
[Top Secret Report] Vol. 5: Introduction to ZONE_ELLIOTT features
Zone_Elliott Secret Report (PDF version) is here ↓
https://www.gogojungle.co.jp/finance/navi/articles/89611
The contents of the report are as follows.
Introduction
Part 1 About Elliott Wave Principle
Part 2 About Dow Theory
Part 3 About Fibonacci
Part 4 About Multi-Time Frame
Part 5 Introduction to Zone_Elliott features
Part 6 How to effectively use Zone_Elliott
Part 7 Master Zone_Elliott (premium)
Part 5: Introduction to Zone_Elliott Features
Finally, we’ve reached the explanation of Zone_Elliott. Were you able to follow along, everyone?
I’ve quickly explained the items necessary to describe Zone_Elliott, but now the real work begins.
Zone_Elliott places weight on acquiring the ability to read the market, developing the capacity to respond flexibly to various markets, and helping you trade with confidence by understanding why you entered at this position.
Now, we will introduce each function of Zone_Elliott, so please bear with us.
Introduction to Zone_Elliott Functions
1> Automatic ZigZag drawing
The ZigZag that counts “pullback lows/reversal highs” is determined by crossing the MA (reference wave MA period). The last “pullback low/reversal high” is displayed on the chart, and when a new pullback low/reversal high is formed, it updates, and older displays are automatically erased.
2> Automatic Elliott Wave drawing
All Elliott Waves are drawn automatically (see the figure below).
When a high breaks below the pullback low, a Down Wave 1 occurs; when a low breaks above the pullback high, an Up Wave 1 occurs.
Wave 3 reaches 100% of Wave 1’s size (the percentage of Wave 3 relative to Wave 1) and the color changes visually to indicate the target size of Wave 3 has been reached.
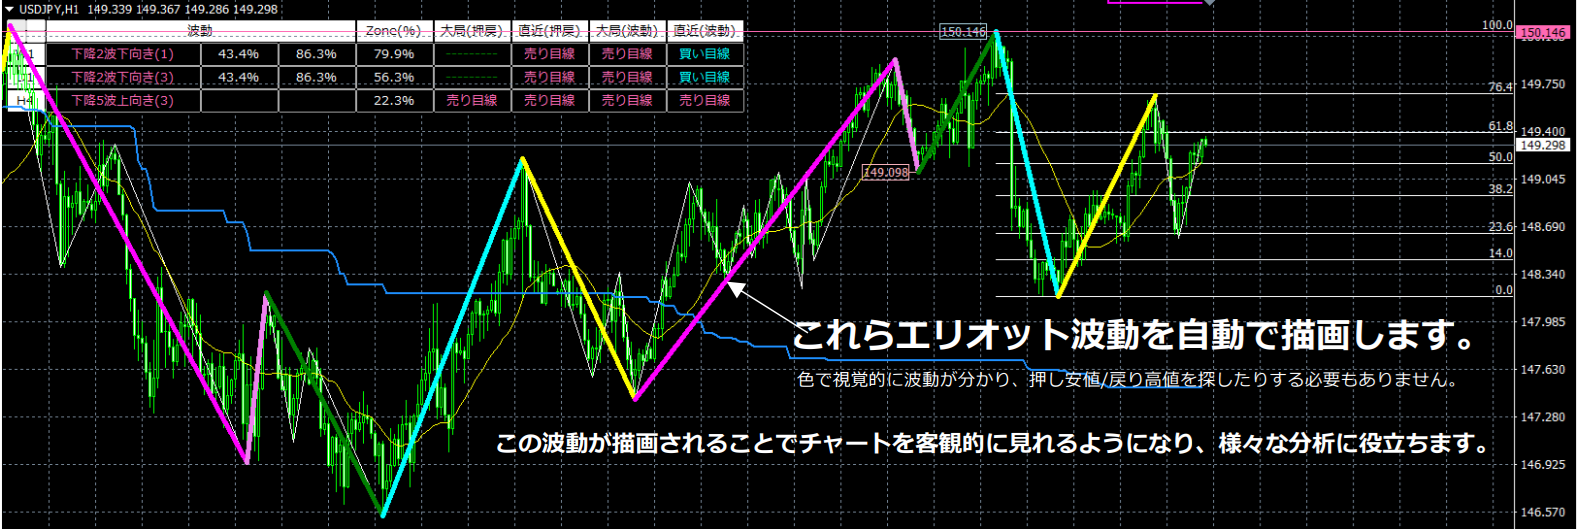
▼ Waves 1 to 5 in Zone_Elliott
*The table below describes rising waves; the same concept applies to falling waves.
*Numbers in parentheses are parameters.
| Rising Wave 1 | The highest high in the last 500 bars (Zone period) is set as 100%, and the lowest low as 0%. If the start of Up Wave 1 is at or below 20% (Zone low zone), and the price breaks above the retrace high, then Up Wave 1 occurs. |
| Rising Wave 2 | After Up Wave 1 occurs, if the body breaks below MA(20), then Up Wave 2 occurs. If the price breaks above the end point of Up Wave 1, Up Wave 3 occurs, and if it breaks below the start point of Up Wave 1, the uptrend ends. After Up Wave 2 occurs, until the price breaks above the end point of Up Wave 1 or below the start point of Up Wave 1, there is no limit to the number of ZigZag peaks and valleys. The notation counts inside the parentheses: after Up Wave 1 occurs, if MA(20) closes below the body, Up Wave 2 occurs; if MA(20) closes above the body, Up Wave 2 Upward (1); if MA(20) closes below the body, Up Wave 2 Downward (1). Thus, if it is Up Wave 2 Downward (3), it means MA(20) has closed below the body three times after Up Wave 2 started. *The counting method inside parentheses applies to all waves, not only Wave 2. |
| Rising Wave 3 | “Up Wave 3” reaches the size of “Up Wave 1” by 100% (the percentage of Wave 3 size relative to Wave 1) and changes color upon completion to visually indicate target achievement. When “Completed Up Wave 3” is reached and the next ZigZag high is confirmed, that point becomes the apex of Completed Up Wave 3, and Up Wave 4 occurs simultaneously. If Wave 3 cannot reach 100% of Wave 1’s size and breaks below the end of Wave 2, the uptrend ends. Wave 3 Completion Condition A=true means that during Up Wave 3, if a higher high is not achieved and a lower low is formed, Up Wave 3 ends at that moment. Zone_Elliott defines Up Wave 1 as occurring when the start point is at or below 20% (Zone low zone) and the retrace high is broken above; Down Wave 1 starts when the start point is at or above 80% (Zone high zone) and the pullback low is broken below. However, a clean reversal after Wave 3 does not consider zones if=true |
| Rising Wave 4 | When Completed Up Wave 3, if MA(20) closes below the body, Up Wave 4 occurs. After Up Wave 4 occurs, if the end point of Completed Up Wave 3 is broken above, Up Wave 5 occurs, and if the end point of Up Wave 1 is broken below, the uptrend ends. A clean reversal after Wave 3 does not consider zones=true means that after Completed Up Wave 3, regardless of zones, a break of the pullback low will trigger Down Wave 1. A clean reversal after Wave 3 does not consider zones=false means that inside zones, a Down Wave 1 starting from the end point of Completed Up Wave 3 will not occur. |
| Rising Wave 5 | After Up Wave 5 occurs, if the end point of Up Wave 4 is broken below, the uptrend ends. A clean reversal after Wave 5 does not consider zones=true means Up Wave 5 occurs regardless of zones when the pullback low is breached. A clean reversal after Wave 5 does not consider zones=false means during Up Wave 5, if the start point of Down Wave 1 is at or above 80% (Zone high zone) and the pullback low is breached, Down Wave 1 occurs. |
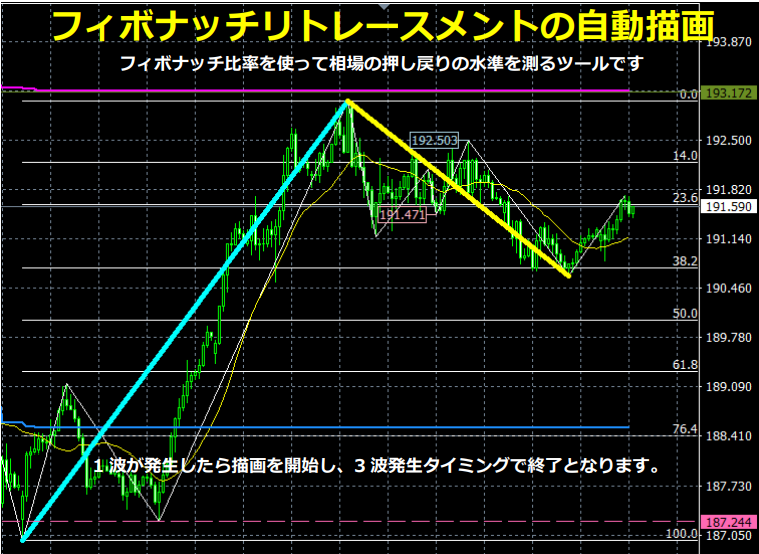
3> Automatic drawing of Fibonacci Retracement / Fibonacci Expansion
The figure below shows an automatic Fibonacci retracement drawing example: when Up Wave 1 occurs, drawing begins and ends at the timing of Up Wave 3.
The next figure shows an automatic Fibonacci expansion drawing example: when Up Wave 3 occurs, drawing begins and ends at the timing of Up Wave 4.
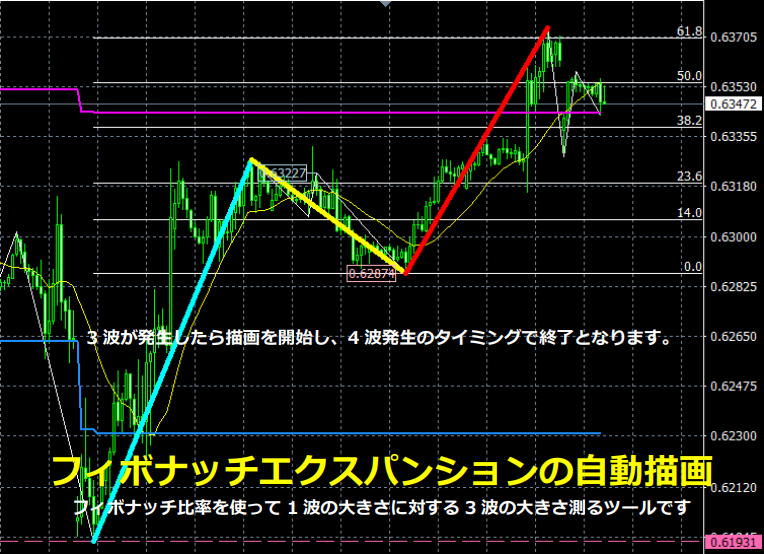
Both are drawn automatically and are erased automatically.
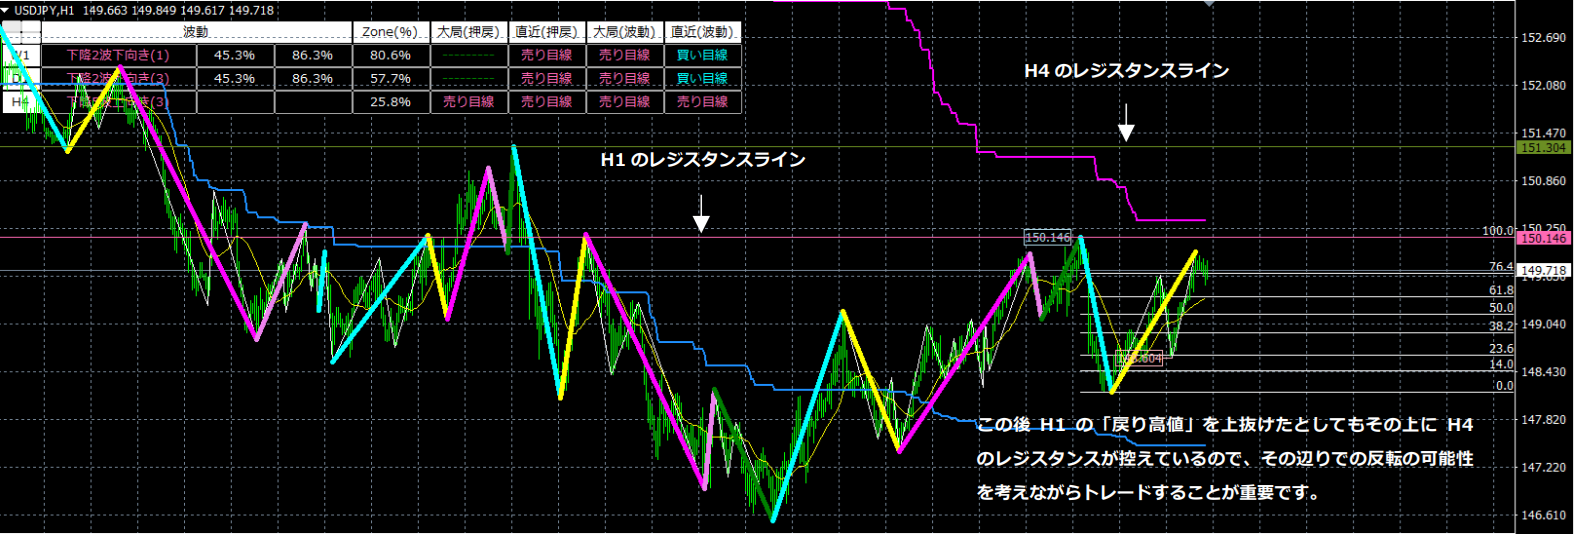
4> Automatic drawing of resistance/support lines
Zone_Elliot automatically draws across the chart, including the chart’s price bar, MTF-1, MTF-2, and MTF-3 timeframes’ major “pullback lows/retrace highs.” The retrace high lines act as resistance, and the pullback low lines act as support. Since it is multi-timeframe, you can confirm higher-timeframe resistance and support lines on the same chart, which is very convenient.
Each timeframe is color-coded and can be changed by parameters.
Pullback lows are drawn as dashed lines; retrace highs are drawn as solid lines.
The “pullback low line” functions as support, and the “retrace high line” functions as resistance, making them crucial for profit-taking points and trading decisions, so please don’t overlook them.
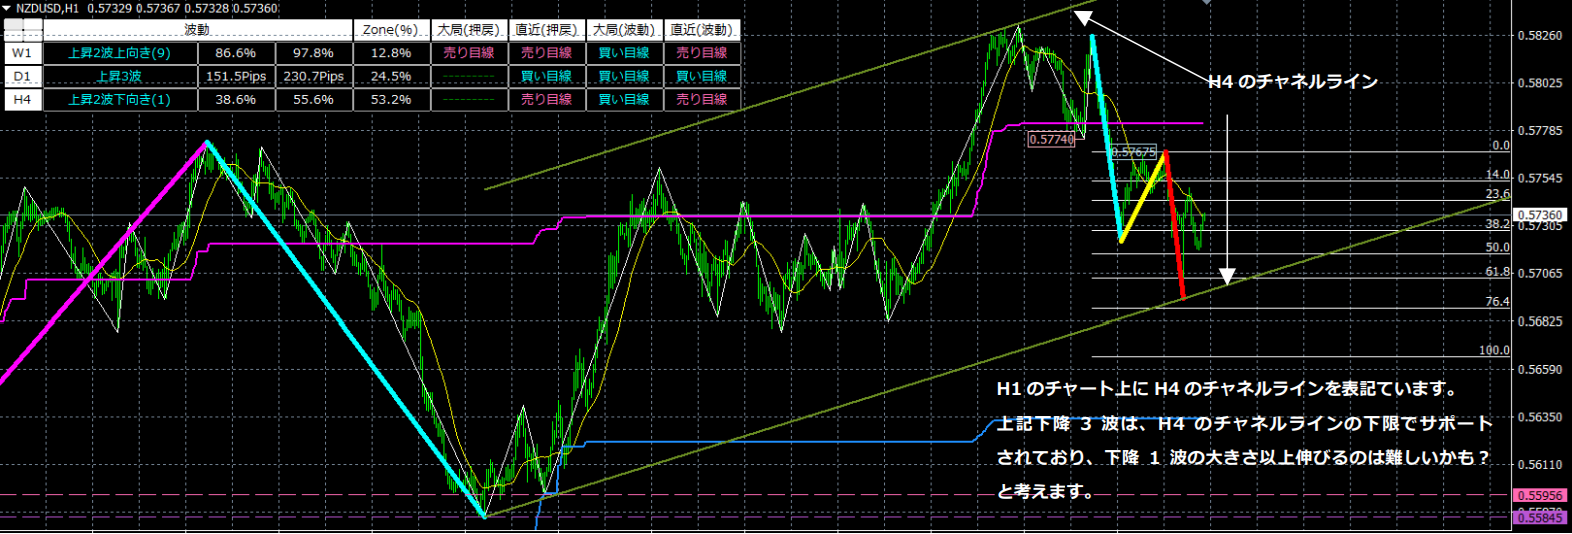
5> Automatic drawing of channel lines
Channel lines are also multi-timeframe capable, so multiple channel lines can be displayed on the chart. Moreover, the color of channel lines can be changed by the time frame’s parameters.
6> Upper-timeframe (multi-timeframe) display
Now, I will explain the upper-timeframe notation individually.
● Waves
Waves describe the state of the trend Elliott waves. If blank, no trend Elliott Wave is present.
For waves, numbers are shown on the side for waves 2, 3, and 4; for other waves, the numbers are blank.
In the figure above, Up Wave 2 Upward (2) 23.8% 49.3% are shown. The left 23.8% (b) is the current value, and the right is the maximum retracement rate (a). In short, relative to Up Wave 1, it can retrace up to 49.3% (a), and it is currently retracing to 23.8% (b).
For Wave 4, the same interpretation as Wave 2 applies, so I’ll skip the explanation.
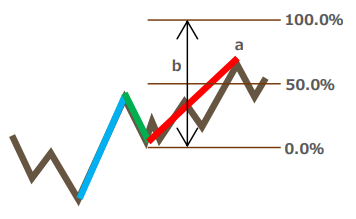
If the size of Wave 1 on the left (b) is 200.0 pips,
Up Wave 3 Upward (1) | 122.8 pips | 200.0 pips
is shown.
The left side is the maximum value of Up Wave 3 (a), and the right side is the size of Up Wave 1 (b). In other words, by monitoring the value on the left (a), you can anticipate how far it may extend.
*3 waves length as a percentage of Wave 1=Explanation assuming it is set to 100%.
● Zone
The highest value in the last 500 bars is set to 100%, and the lowest value is 0%, and the current position is expressed as a percentage. This helps determine whether you are in a low-price zone or a high-price zone.
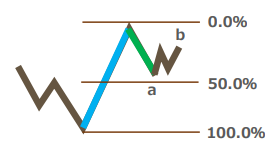
● Large-scale retrace, recent retrace
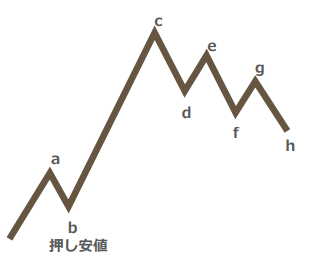
Zone_Elliott uses the concepts of large-scale retrace and recent retrace for pullback lows/retrace highs.
From the above figure, when the value a breaks above, b becomes the pullback low, and until b is breached, you are in a buy bias. However, in the recent context, there is a lower high and lower low, indicating a downtrend. In such a market, the term “buy bias” does not accurately describe the current situation, so the concept of “recent” is introduced.
In Zone_Elliott, when d is breached, e becomes the “most recent retrace high,” and when f is breached, it updates, with g becoming the “most recent retrace high.”
● Large-scale (waves), recent (waves)
| Large-scale (waves) | Recent (waves) | |
| Buy bias | Up Wave 1, Up Wave 2, Up Wave 3, Up Wave 4, Up Wave 5 ※ Up waves | Up Wave 1, Up Wave 3, Up Wave 5, Down Wave 2, Down Wave 4 ※ Upward odd waves and downward even waves |
| Sell bias | Down Wave 1, Down Wave 2, Down Wave 3, Down Wave 4, Down Wave 5 ※ Down waves | Down Wave 1, Down Wave 3, Down Wave 5, Up Wave 2, Up Wave 4 ※ Downward odd waves and upward even waves |
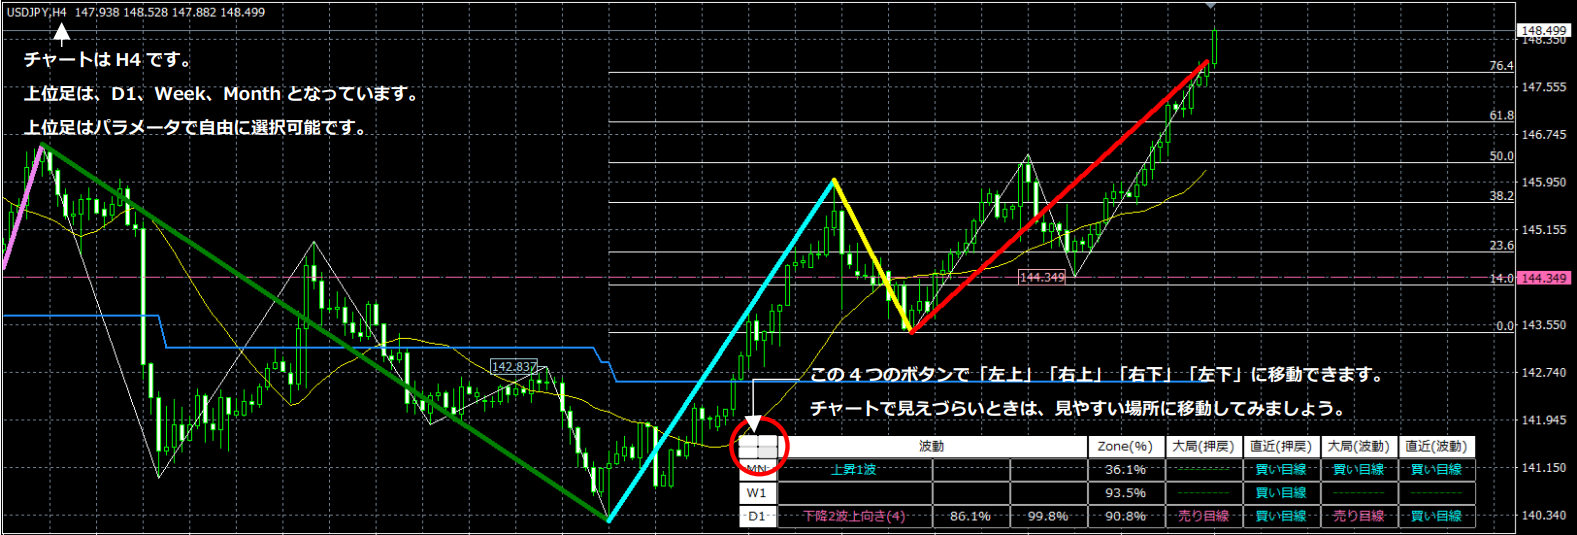
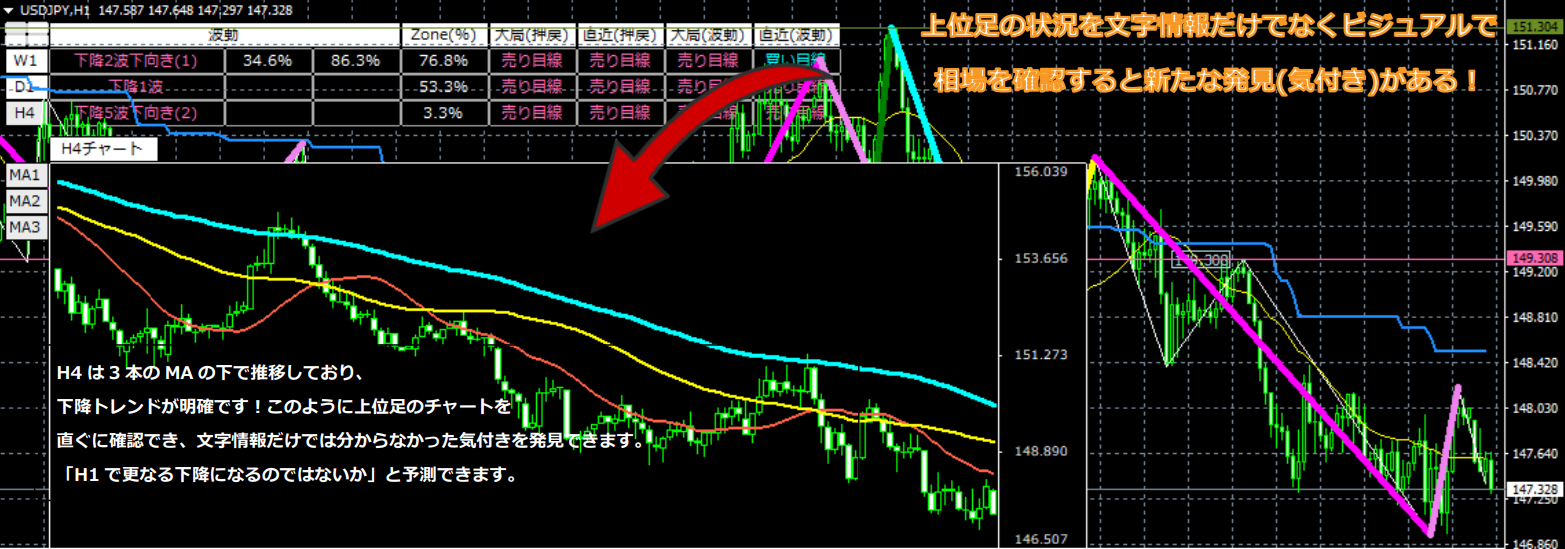
7> Upper-timeframe mini-chart display
By clicking the “Timeframe” button for the higher timeframes, you can display a mini-chart for that timeframe. You can see past price movements, the trend direction, and momentum using three moving averages on the mini-chart. Clicking the “Timeframe” button also smoothly switches the mini-chart’s timeframe.
You can view roughly two years on the weekly chart, about half a year on the daily chart, and about one month on the 4-hour chart.
This concludes the introduction to Zone_Elliott’s features. I hope you’ve gained a general understanding of what it can do. If there are parts you don’t understand, please read again to deepen your understanding before proceeding to the next chapter.
Additionally, there is something we want everyone to clearly understand about Elliott Wave.
There are many explanations of Elliott Wave scattered across the internet and videos. Almost all explanations of Elliott Wave are post hoc, implying “anyone can count later.”
Zone_Elliott we developed is not post hoc; it is a tool that automatically draws Elliott Waves in real time.
One of the definitions of “Elliott Wave” is that “Wave 3 grows large.” However, there are voices wanting to know only that moment.
That is, you want to know the Wave 3 that grows larger than Wave 1.
Finding a large Wave 3 means looking for a Wave 1 that will grow large.
Basically, when the retrace high is breached, Up Wave 1 occurs, and when the pullback low is breached, Down Wave 1 occurs.
However, if you simply count that Up Wave 1 occurs as soon as the retrace high is breached, you will miss many opportunities for a large Up Wave 3.
So Zone_Elliott uses the zone concept to recognize that a breakout of the retrace high from the low zone becomes Up Wave 1, and a breakout of the pullback low from the high zone becomes Down Wave 1.
This increases the proportion of cases that become a large Wave 3, but it is not 100%. Therefore, we united features to determine which Wave 3 is more likely to grow larger on a single chart, making Zone_Elliott a tool for correct judgment.
We are not gods, so perfect, 100% accurate automatic drawing is impossible. However, Zone_Elliott, with multi-timeframe and various tools, can help eliminate incorrect Elliott Wave drawings.
At the same time, understanding what follows will greatly improve your market-reading ability.
Not just trading by using tool features, but analyzing the market to understand it and trade with confidence—let’s all strive for that.
In the next sections, we will explain how to use Zone_Elliott in practice.