

【Secret Report】Issue 4 About Multi-Time Frame
Zone_Elliott Confidential Report (PDF version) is here↓
https://www.gogojungle.co.jp/finance/navi/articles/89611
The contents of the report are as follows.
Introduction
Part 1: About Elliott Wave
Part 2: About Dow Theory
Part 3: About Fibonacci
Part 4: About Multi-Time Frame
Part 5: Introduction to Zone_Elliott features
Part 6: Effective ways to use Zone_Elliott
Part 7: Master Zone_Elliott (paid)
Part 4: About Multi-Time Frame (MTF)
What is Multi-Time Frame (MTF) Analysis
This analysis method takes a comprehensive view of multiple time-frame charts to form environmental awareness.
Why are higher time frames important? Because movements on lower frames are always influenced by higher frames.
Institutional investors, who move the markets, manage large sums of money over long periods. In chart terms, this corresponds to monthly or weekly timeframes. And the order sizes are enormous.
Therefore, movements on longer time frames are critical.
Four key points in Multi-Time Frame (MTF) Analysis
1> Identify whether the market is trending or ranging
The market only has three states: going up, going down, or ranging. Determine the current state.
2> Perspective
This is the boundary that determines the relative strength of buying versus selling.
3> Support/Resistance elements
Refers to highs/lows and channel lines.
4> Wave
Refers to Elliott waves.
Approach using Multi-Time Frame (MTF)
Let's look at an actual chart.
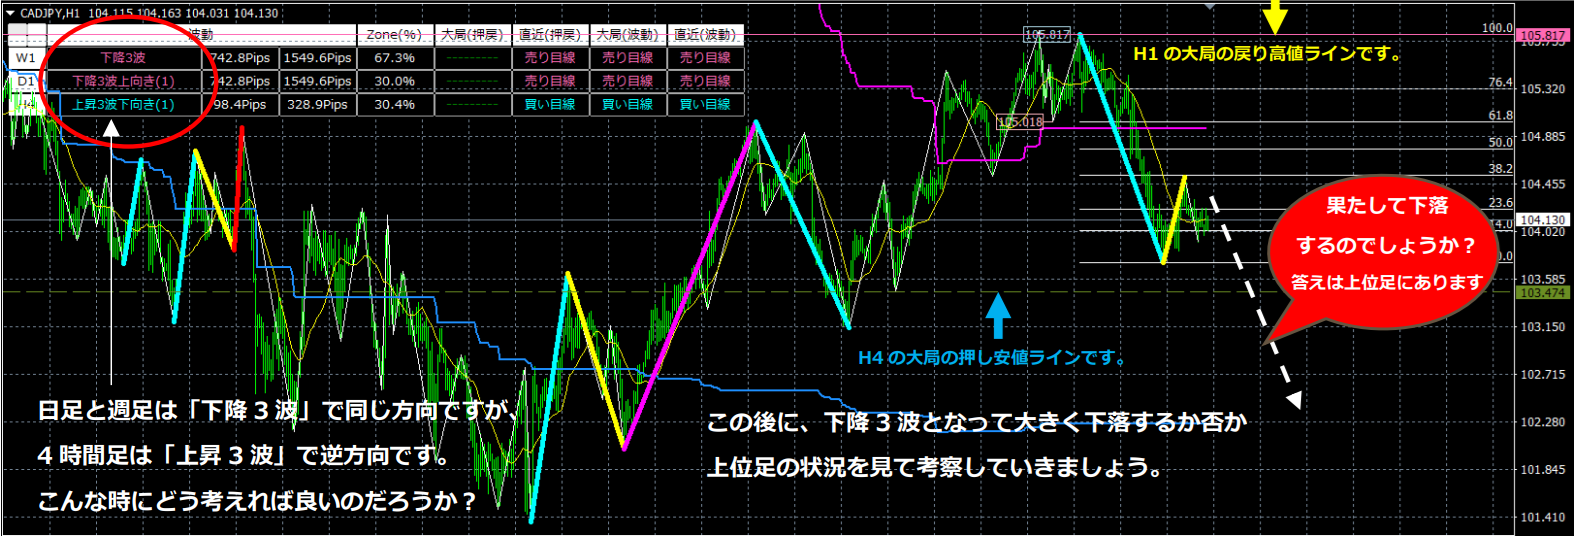
In the CADJPY H1 chart, a second-wave decline is occurring.
Daily and Weekly are in a “descending 3-wave” direction, but the 4-hour chart is in an opposite direction with an “ascending 3-wave.” How should we think about this?
Next, we will examine higher-time-frame conditions to determine whether a larger drop will occur following a descending 3-wave.
▼ First, start with the Weekly
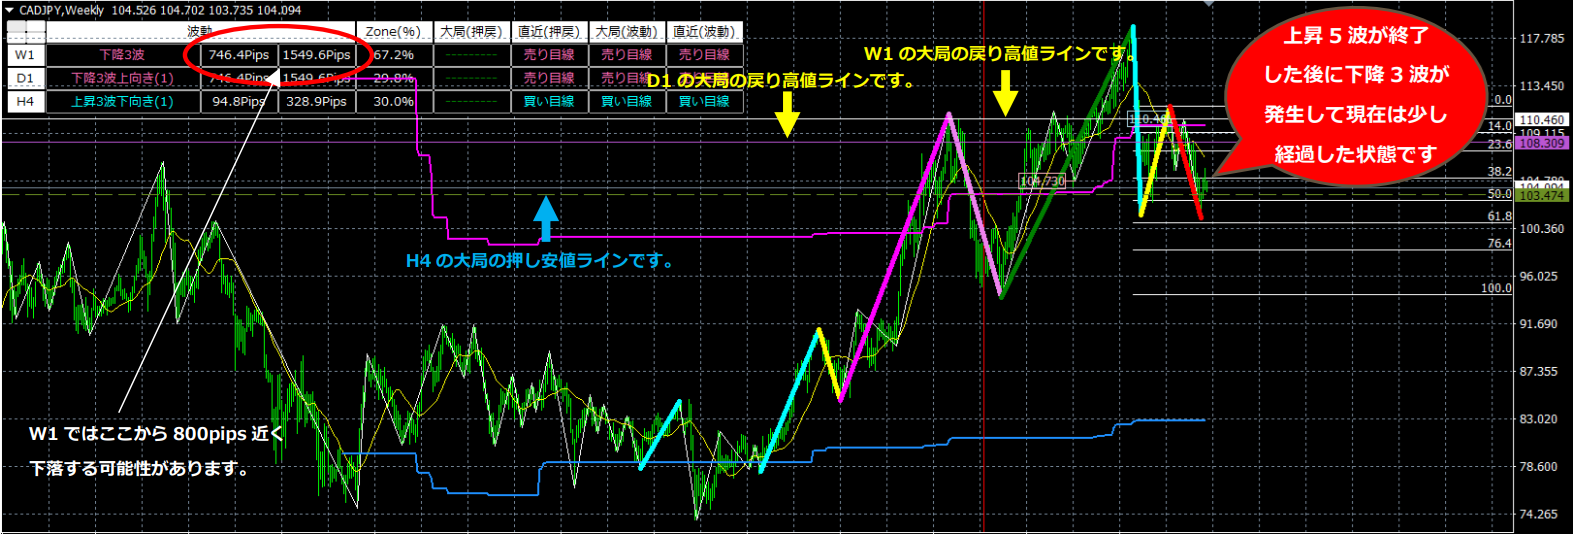
After the 5-wave rise ends, a 3-wave decline occurs and we are now in a slightly progressed state.
W1 suggests a potential drop of nearly 800 pips from here. (Calculated from the size of Wave 1)
▼ Next, look at the Daily
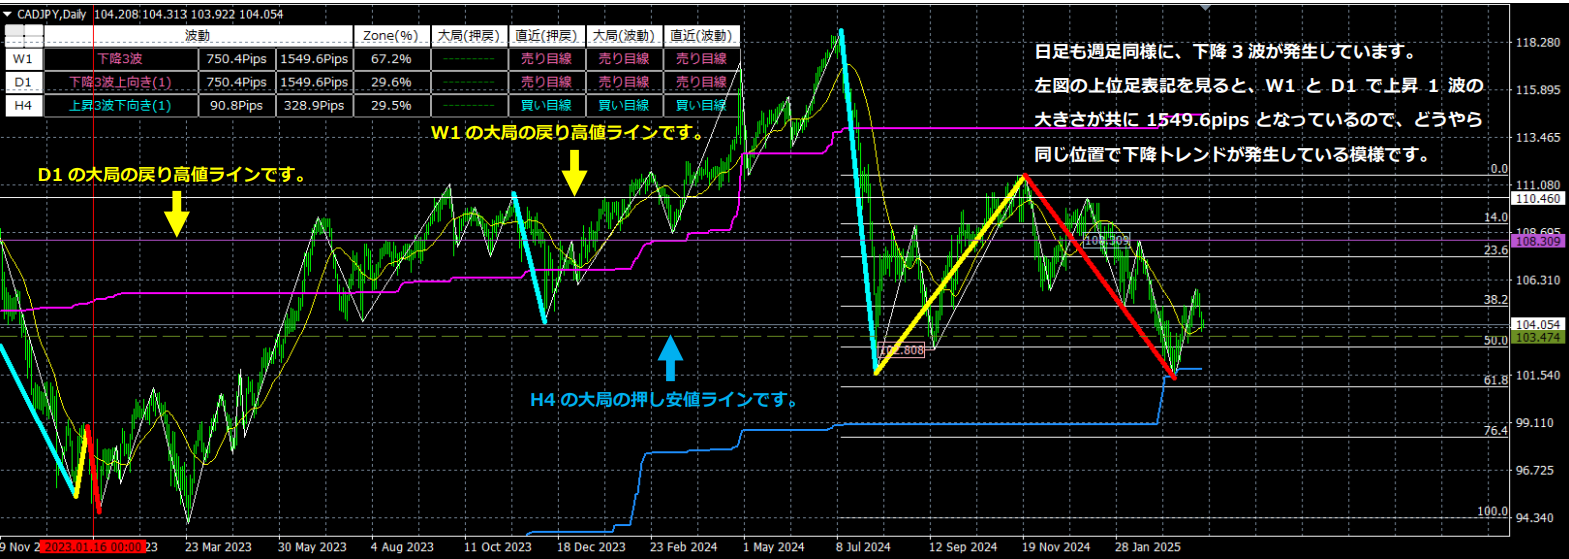
The Daily, like the Weekly, shows a descending 3-wave movement.
Looking at the higher-time-frame notation on the left, both W1 and D1 show the size of the rise in Wave 1 as 1549.6 pips, suggesting that the same position is experiencing a descending trend.
▼ Finally, look at the 4-hour chart
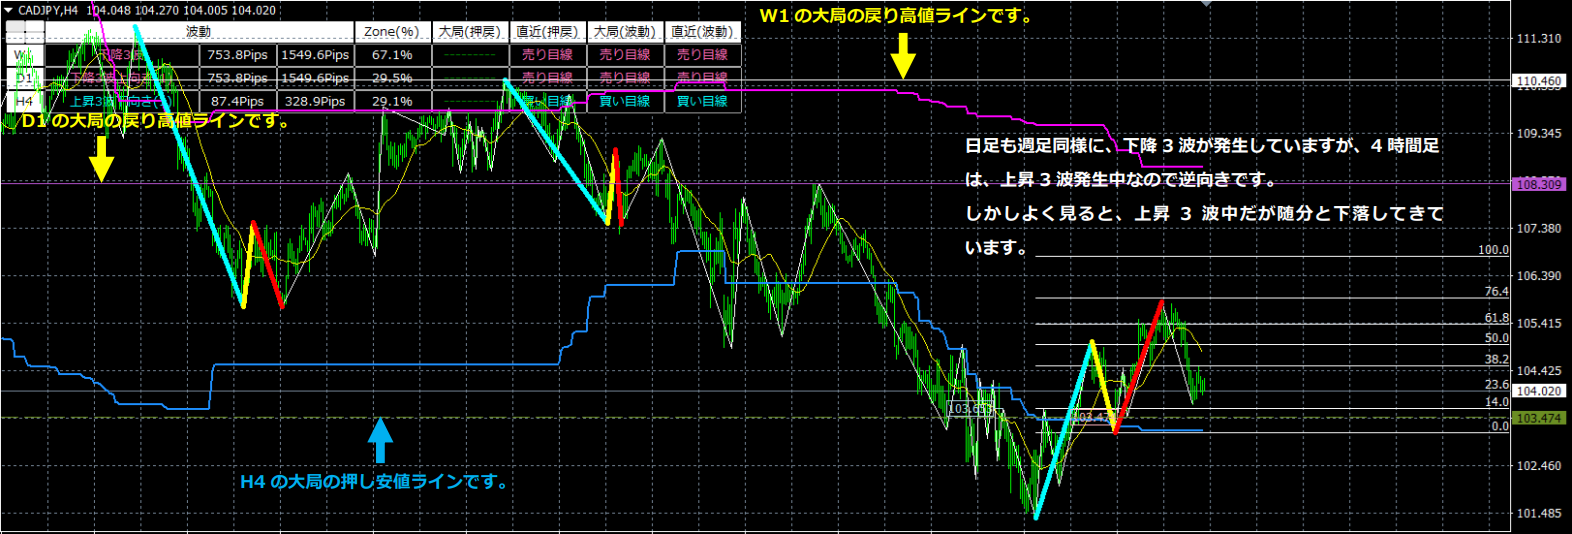
The Daily and Weekly similarly show a descending 3-wave, but the 4-hour chart is in an ascending 3-wave, thus opposite in direction.
However, if you look closely, the ascending 3-wave has already fallen quite a bit.
▼ Let's reconsider on the 1-hour chart again.
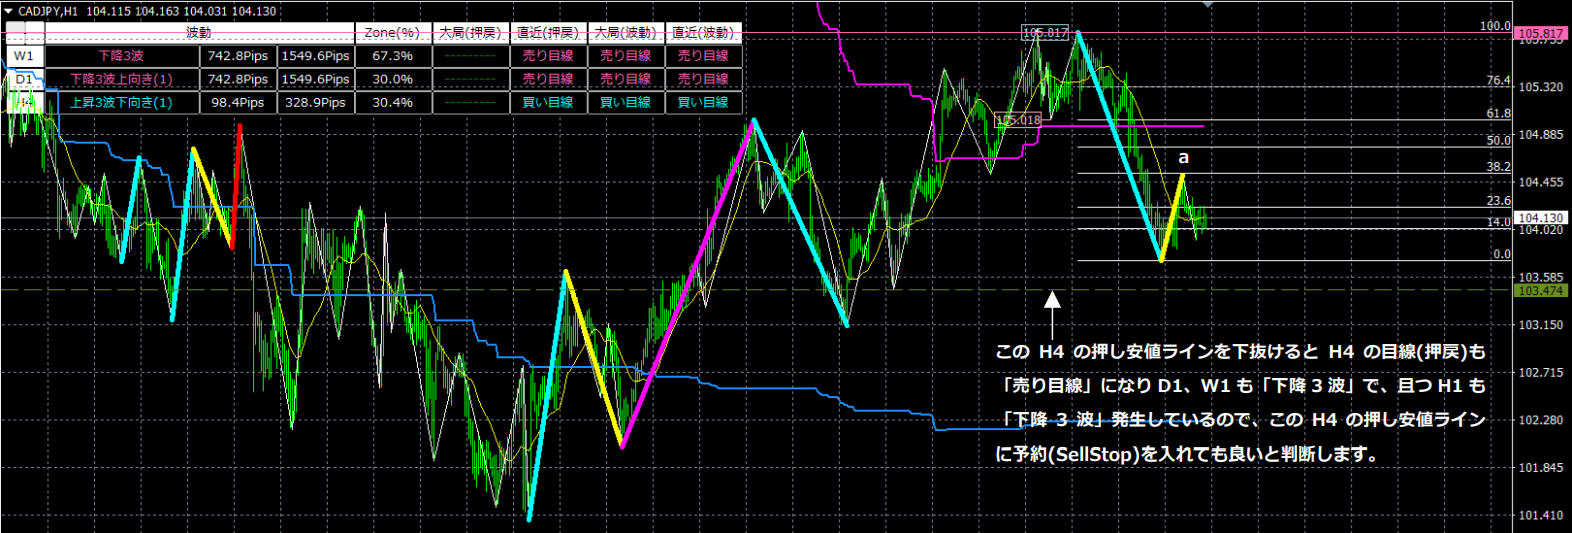
If the H4 support line is broken below, the H4 perspective (recoil) also becomes a “Sell” perspective, and D1 and W1 would also show a “descending 3-wave,” with H1 also showing a “descending 3-wave.” Thus, it is reasonable to place a Sell Stop just below this H4 support line.
In this way, MT F analysis allows you to understand the market flow and determine trade direction and timing by analyzing from long-term to mid-term to short-term time frames.
If I were trading, I would place Sell Stop on the H4 support line in the above diagram, with SL set at the end of the descending 2-wave (a) plus 5 pips, and leave it as is.
The main consideration is the take-profit level. If the D1/W1 descending 3-wave extends to the end of the first wave, it could extend nearly 800 pips from this point. If successful, it would maximize profit while minimizing loss.
Also, using the RiskRewardChecker currently offered to purchasers, you could monitor risk-reward and gradually accumulate profits on H1 in line with the trend.
In any case, in this scenario, the ascending Elliott wave on H4 would prove to be a wrong expectation as the ascending 3-wave does not significantly extend.
Zone_Elliott renders everything automatically, but not everything is drawn perfectly (if everything were perfect, it would be divine). It is important to judge whether the waves are drawn correctly using various information including MT F.