
[Top Secret Report] About Fibonacci, Part 3
Zone_Elliott Secret Report (PDF version) is here↓
https://www.gogojungle.co.jp/finance/navi/articles/89611
The contents of the report are as follows.
Introduction
Part 1: About the Elliott Wave
Part 2: About Dow Theory
Part 3: About Fibonacci
Part 4: About Multi-Time Frame
Part 5: Introduction of Zone_Elliott's features
Part 6: Effective ways to use Zone_Elliott
Part 7: Master Zone_Elliott (paid)
Part 3: About Fibonacci
What is Fibonacci
The Fibonacci sequence is a series formed by adding the two previous numbers, as shown below.
1, 1, 2, 3, 5, 8, 13, 21, 34, 55, 89, 144, ...
This sequence has a mysterious property that appears in various natural phenomena.
For example, in the number of petals in flowers, the way branches split on trees, the spiral of snails, and the arrangement of sunflower seeds.
The ratio of neighboring numbers in the Fibonacci sequence gradually approaches about 1.618, known as the golden ratio. This ratio is considered beautiful in fields such as art and architecture.
Fibonacci sequences and ratios are applied in various fields.
● Technical analysis of financial markets: predicting stock prices and exchange rate movements
● Computer science: algorithm design
● Architecture and design: creating beautiful structures and designs
Fibonacci Retracement
A tool that uses Fibonacci ratios to measure potential pullback levels in a market = Fibonacci retracement.
Commonly viewed at ratios of 23.6%, 38.2%, 50.0%, 61.8%, and 78.6%.
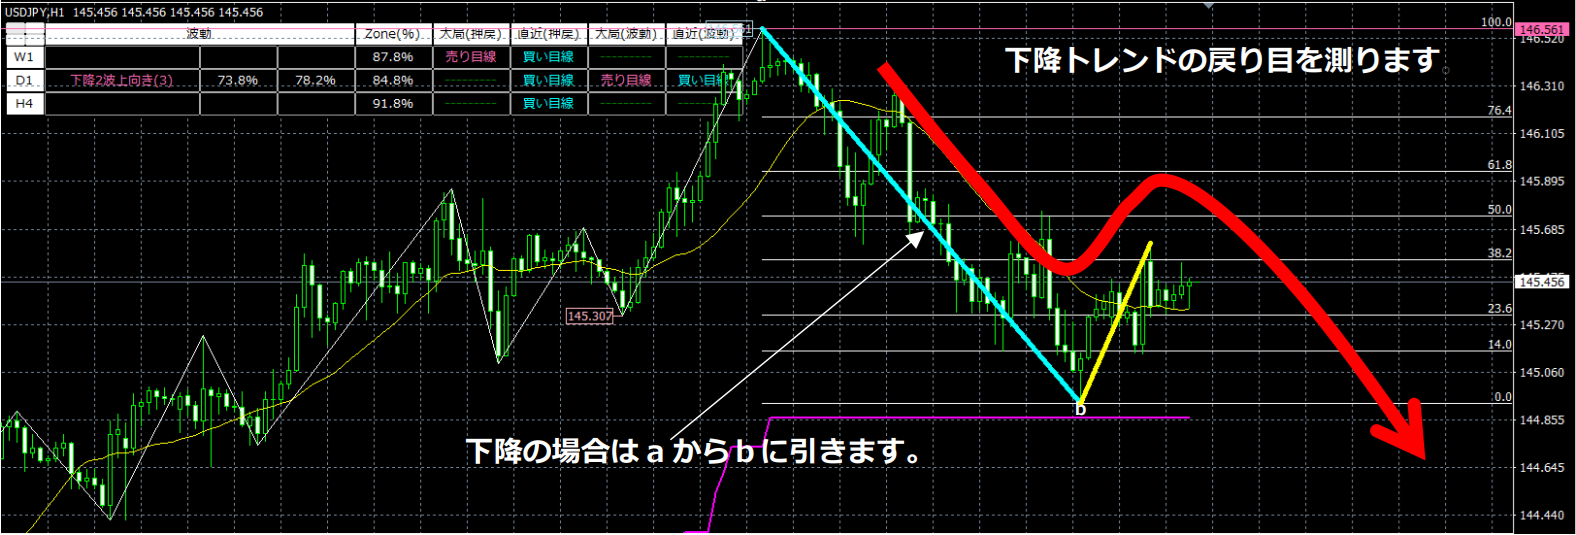
When a down impulse occurs, we examine how far it retraces before continuing downward. If the retrace is within the 38.2%–61.8% range, it is said to often lead to a larger wave 3.
In a down move, draw from the high to the low; in an up move, draw from the low to the high.
Identifying Pullbacks/Dullbacks
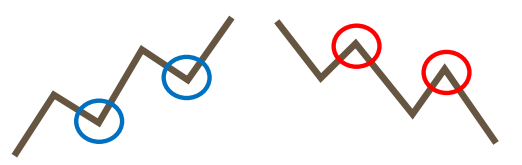
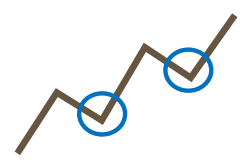
As shown above, a temporary decline in an uptrend (blue circle) is called a pullback, and a temporary rise in a downtrend (red circle) is called a retracement.
The reason Fibonacci ratios are effective for identifying these pullbacks/retracements is that traders worldwide are watching these levels, so attention is concentrated there.
However,we cannot know which ratio will cause a rebound. The levels at which rebounds occur vary every time.
We know Fibonacci is watched in the market, but how can we use it to identify pullbacks/retracements? The important concept here is price action.
Price action, in short, is how the highs and lows move.
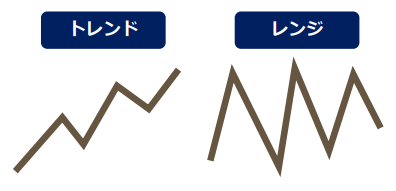
There are two types of markets: trending and ranging.
What distinguishes them is how the highs and lows move.
In an uptrend, highs and lows are progressively higher; in a range, highs and lows do not get updated.
Therefore, we should watch the price action when it reaches the pullback/retracement candidate zones (blue circle/red circle). Typically, many pullbacks/retracements settle in the Fibonacci 38.2%–61.8% zone, so we need to observe the price action in this area carefully.
So how should we view it? The following explains a method for identifying pullbacks.\u3000
A pullback formation is a temporary downtrend that occurs between uptrends.
To buy on pullbacks along the trend, you only need to determine when the temporary downtrend has ended. As described above, markets have only trends and ranges, so when a downtrend turns into a range, or a downtrend shifts to an uptrend, you know that is a pullback. Therefore, monitoring this is sufficient. The charts below illustrate this.
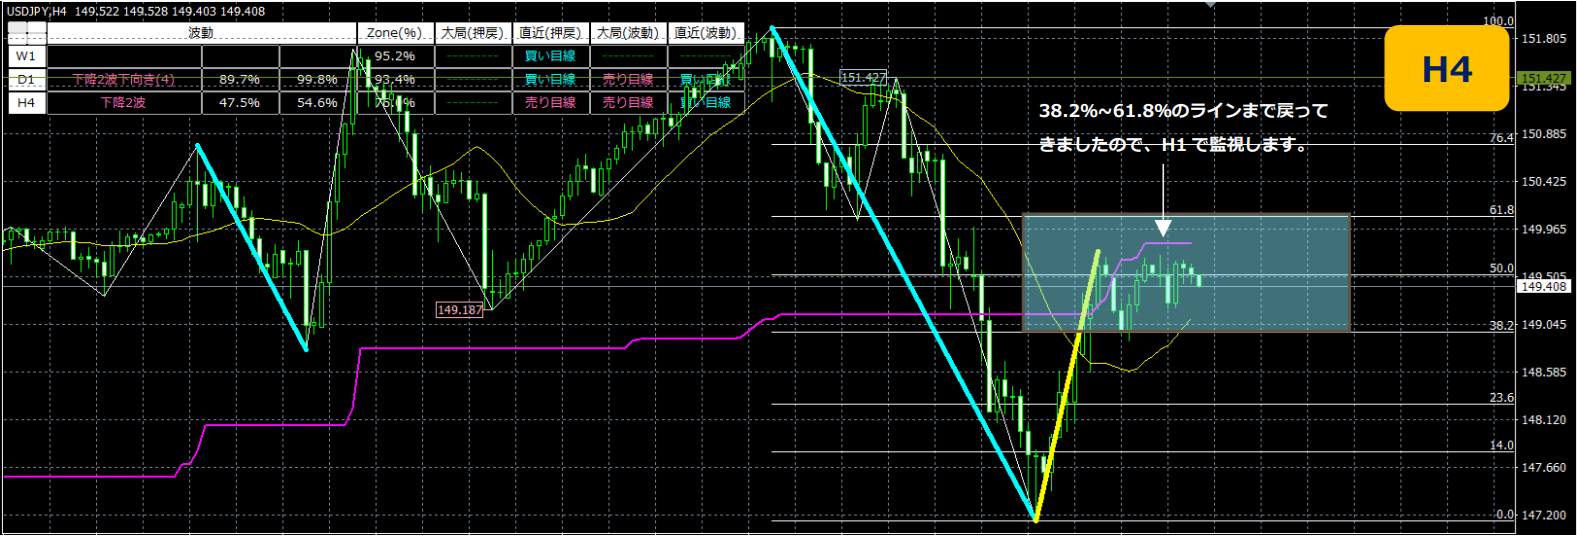
On the H4 chart, it has retraced to the 38.2%–61.8% line, so we monitor on H1.
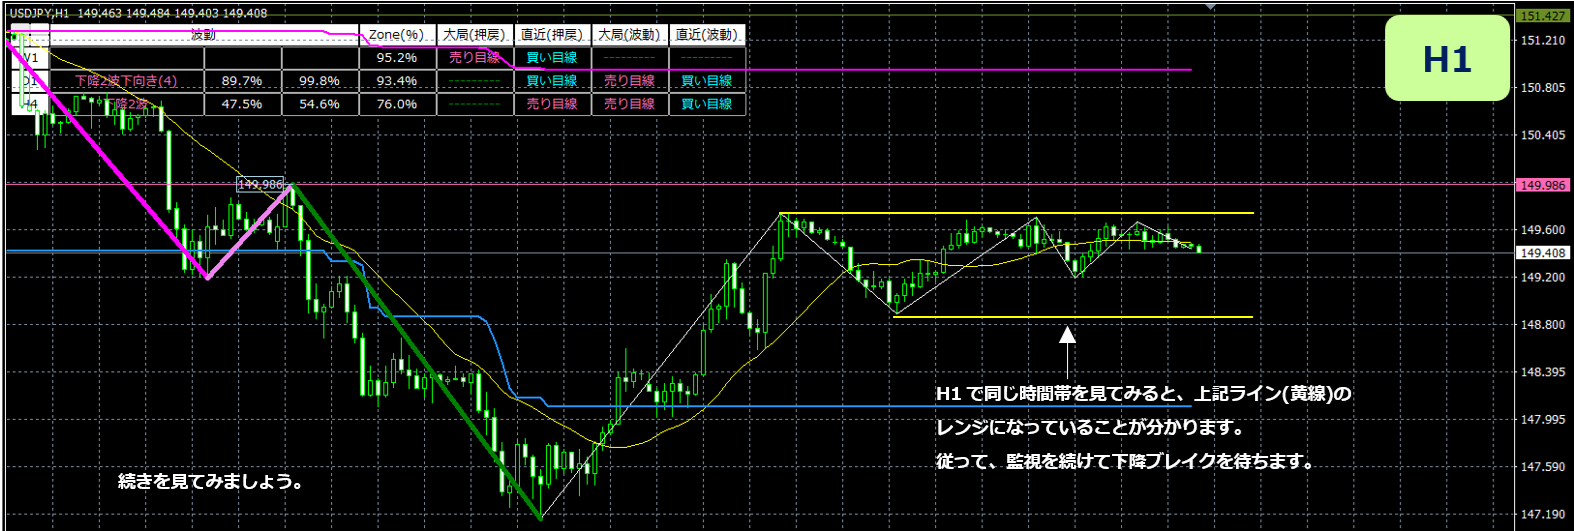
When looking at the same time frame on H1, the line above (yellow line) is within a range, indicating a range-bound market.
Therefore, continue watching and wait for a downward breakout.
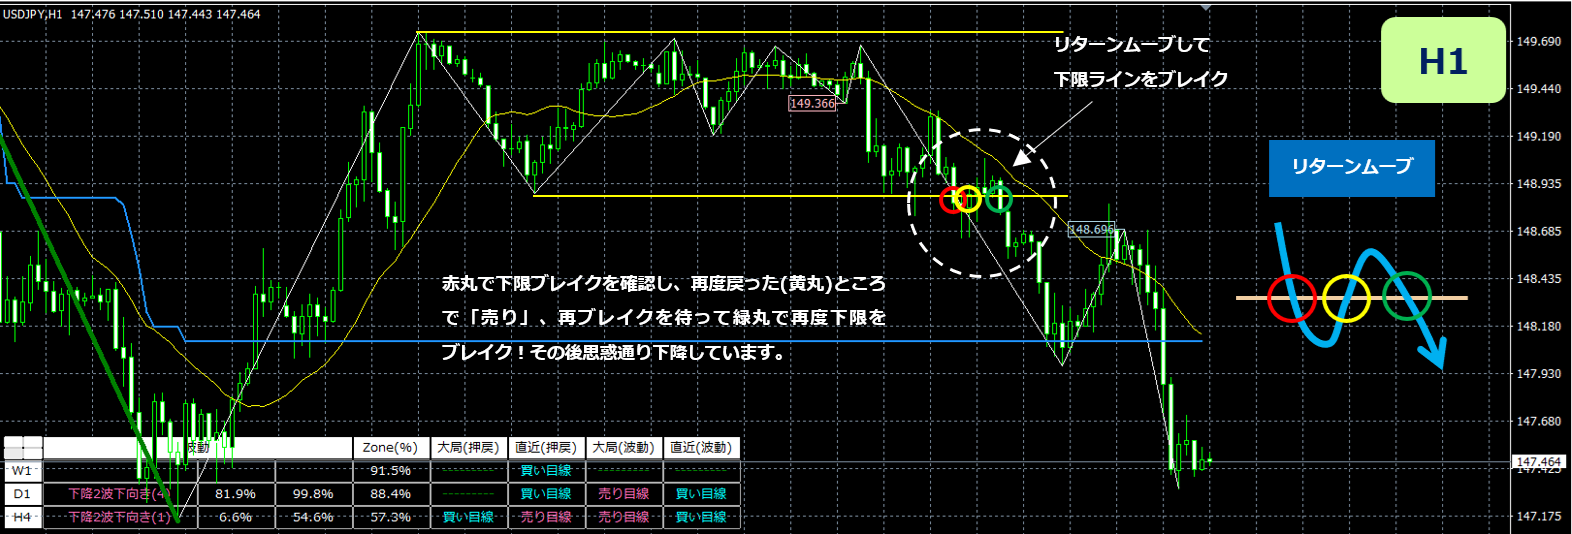
Confirm the lower bound breakout with a red circle, then wait for another pullback to the yellow circle and enter selling there; when it breaks the lower bound again (green circle), it falls as expected.
Thus, adding price action as a spice to Fibonacci retracement makes it easier to identify pullbacks/retracements.
What is a Return Move
A return move is a phenomenon that can be confirmed using technical analysis with lines such as horizontal lines, moving averages, and range highs/lows.
For example, after a chart breaks a horizontal line, instead of continuing in the break direction, it often moves back to retest the horizontal line. This return move then leads the chart to move again in the break direction, allowing entries near the horizontal line even after a breakout.
Using return moves helps clarify judgments at chart reversals, making it easier to limit losses.
By utilizing return moves, you not only minimize losses but also, even if the market moves against your expectation, you understand that a rebound is possible if you control the return move, potentially turning losses into profits. It also clarifies stop-loss points, making it valuable for risk management.
Difference Between Return Move and Roll Reversal
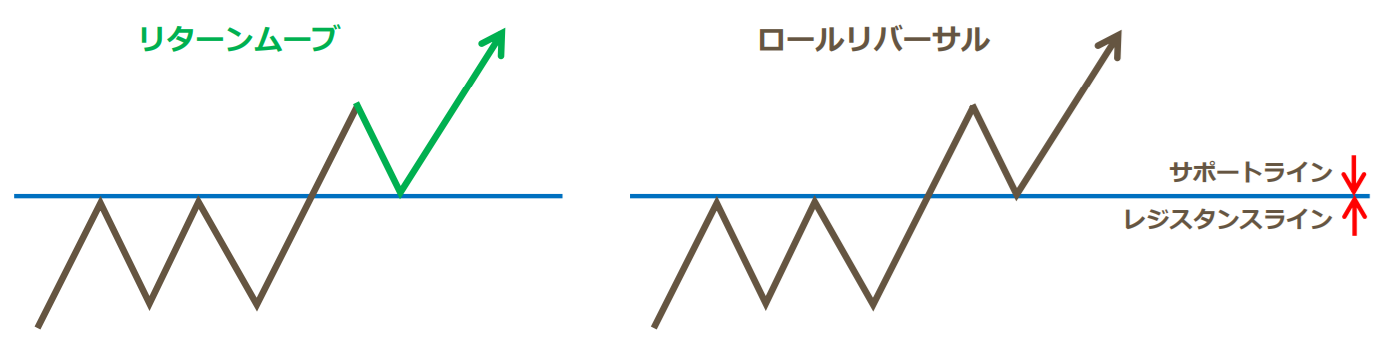
A similar term is Roll Reversal.
Roll reversal refers to a phenomenon where the function of a line changes after a line breakout in technical analysis that uses lines like horizontal lines or trendlines.
For example, a horizontal line that once acted as resistance may function as support after a breakout.
Both return move and roll reversal analyze line breaks, so they are similar in that sense.
Return move focuses on the chart movement after the line break, while roll reversal focuses on the function of the line after the break.
Since both involve line-based technical analysis, learning return moves together with roll reversals is an efficient way to master FX techniques.
Return Move in this Report
Generally, return move explanations state that after the line is broken, the price moves back to touch the line and then rises again. In reality, it is not only touching the line but also breaking below it after returning, then rising again.
In a range breakout example, traders who trade within the range sell at the upper boundary and buy at the lower boundary; those who sold at the upper boundary have losses, and those who bought at the lower boundary also have losses.
When the upper boundary is broken, traders who were short within the range incur further losses, so upon a pullback, sellers tend to cover, leading to a rebound.
Regarding the pullback after breaking the range upper boundary, there are varying opinions: “the wick touching the upper bound means a pullback,” “the close inside the range upper bound means a pullback,” or “approaching the upper bound means a pullback,” etc. There are many judgments.
In this report, it is explained as “a pullback when the close enters inside the range,” but this is not the definitive method; it depends on individual approach and testing.
For example, if you decide that a pullback occurs when the close stays inside the range, there may be cases where you cannot enter simply because the wick touched the line. Rather than getting emotional, if you did not enter because it didn’t fit your criteria, you should not change your parameters on the fly.
Fibonacci Expansion
Fibonacci expansion, as the term suggests, is a tool to estimate how far the price will move in a trend, primarily used in trending markets.
After pullbacks or retracements, it helps assess how far the price might extend.
→ Zone_Elliott automatically draws Fibonacci expansion when wave 3 occurs.
Details are explained in the features introduction of Zone_Elliott.