
【Secret Report】Second installment on Dow Theory
Zone_Elliott Secret Report (PDF version) is here ↓
https://www.gogojungle.co.jp/finance/navi/articles/89611
The contents of the report are as follows.
Introduction
Part 1: About Elliott Wave Theory
Part 2: About Dow Theory
Part 3: About Fibonacci
Part 4: About multi-time frame
Part 5: Introduction to Zone_Elliott features
Part 6: How to use Zone_Elliott effectively
Part 7: Master Zone_Elliott (paid)
Part 2: About Dow Theory
What is Dow Theory
The Dow Theory report for Part 2 begins.
Dow Theory may seem quite extensive, but by reading this report you should be able to understand from basics to application, so let's learn together.
Dow Theory is a framework that systemizes market behavior incorporating investor psychology, and serves as the foundation for viewing charts objectively. Without understanding this, you cannot grasp important market movements like the formation, continuation, and reversal of trends.
Dow Theory was developed in the early 20th century by Charles H. Dow.
Charles H. Dow was a journalist, founder of The Wall Street Journal, and founder of Dow Jones. He also conceived the Dow Jones Industrial Average, the US stock index.
Six elements that compose Dow Theory
1> The market discounts all information
Dow Theory is based on price, but it can be adapted to commodities, FX, and other financial instruments. The idea is that prices reflect all available information. For example, potential earnings, management quality, earnings announcements, and economic indicators—even if market participants do not know these details, the market prices in the risk and expectations. For instance, when US economic data is strong, US Treasury yields may rise and the dollar may strengthen in anticipation of possible future rate hikes, even if it is not certain that hikes will occur.
2> Three types of trends
This is the idea that markets have primary, secondary, and minor trends.
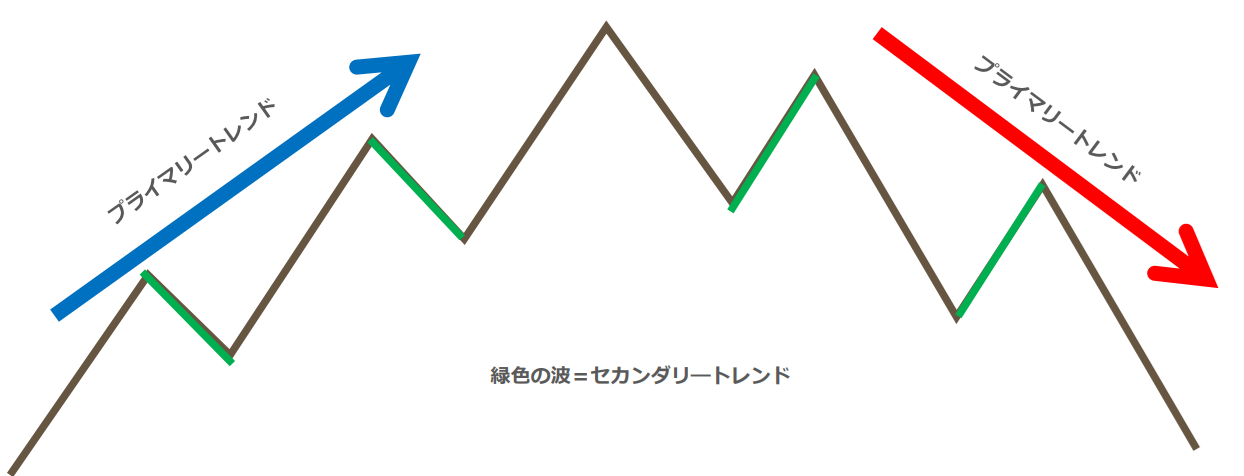
In an uptrend, the main directional flow is the primary trend (blue arrow); in a downtrend, the main directional flow is the primary trend (red arrow).
The primary trend is defined as lasting one year or longer.
Trends are not perfectly linear. The pullbacks in uptrends (green waves) and retracements in downtrends (green waves) are called secondary trends.
Secondary trends are thought to last from weeks to months.
Minor trends refer to the day-to-day movements that make up the primary or secondary trends.
Minor trends are thought to last from days to weeks.
You don't need to memorize these names; just understand that there are major trends and corresponding corrections.
3> Three phases of trends
The five-wave advance and three-wave correction of the Elliott Wave Theory are similar (almost the same). Dow Theory defines three phases. The following diagram shows uptrends and downtrends separately; since there isn't a major difference between uptrends and downtrends, we will explain with an uptrend.
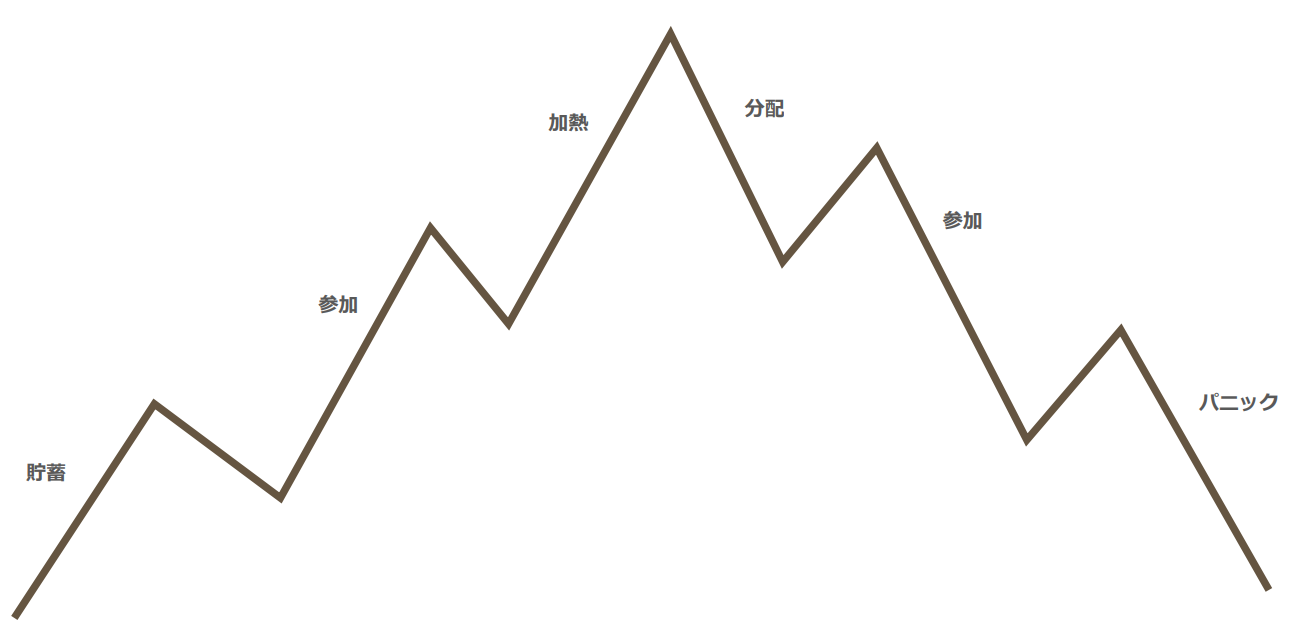
● Accumulation
A few farsighted investors begin buying. Institutions start gradually building positions even before a clear uptrend has formed.
● Participation
Investors and technicians who sense the uptrend has begun enter the market.
● Heating up
General investors and less experienced participants join in, while early movers start taking profits.
By understanding how those who joined early think, you can view charts more objectively and markedly improve your market-reading ability.
4> Indices must confirm each other
For example, when a broad index like the Dow Jones Industrial Average is rising, the Dow Transport Average should also be rising for a new trend to be considered underway; otherwise, it may not be a new overall trend.
The Dow Jones averages are composed of many sectors; when these rise, it suggests that the overall economy is improving and will positively impact transportation stocks.
For another example, when the S&P 500 is in an uptrend but the Nasdaq is down, this may indicate that the overall US stock market trend is not strong. In Japan, if major banking stocks like Mitsubishi UFJ Financial Group, Mizuho, and Sumitomo Mitsui Financial Group are all in uptrends, the overall Japanese banking sector is in an uptrend.
If Mitsubishi UFJ alone rises, it may be due to a specific stock factor rather than a broader trend.
In forex, if USDJPY, EURUSD, AUDUSD, NZDUSD, and USDCHF are all moving against the USD, you can interpret it as a rising dollar trend. (Note: here it means relative strength in USD across currencies.)
By observing trends across asset classes, industries, and currency pairs, you can gauge the reliability of a trend.
5> Trends must be supported by volume
Prices rising should be accompanied by increasing trading volume.
In an uptrend,
● Price rises should be accompanied by rising volume
● Price falls should be accompanied by declining volume
In a downtrend,
● Price falls should be accompanied by rising volume
● Price rises should be accompanied by declining volume
When price moves up or down with the volume supporting it, the signal is considered more reliable.
6> A trend continues until a clear signal appears
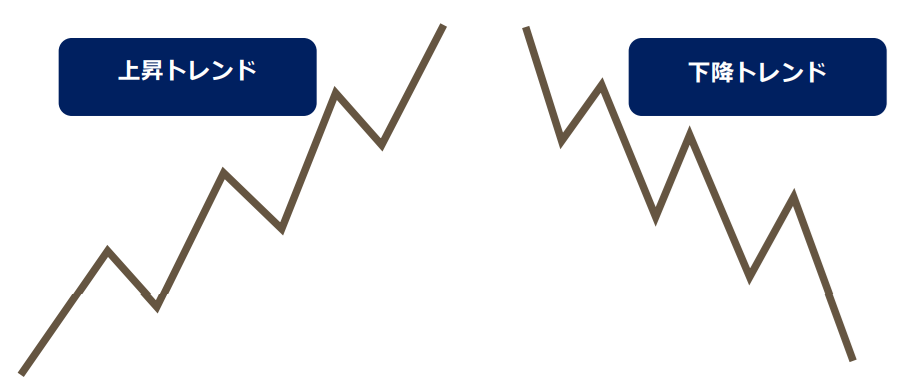
An uptrend is defined by higher lows and higher highs; a downtrend is defined by lower highs and lower lows.
So when does a trend end?
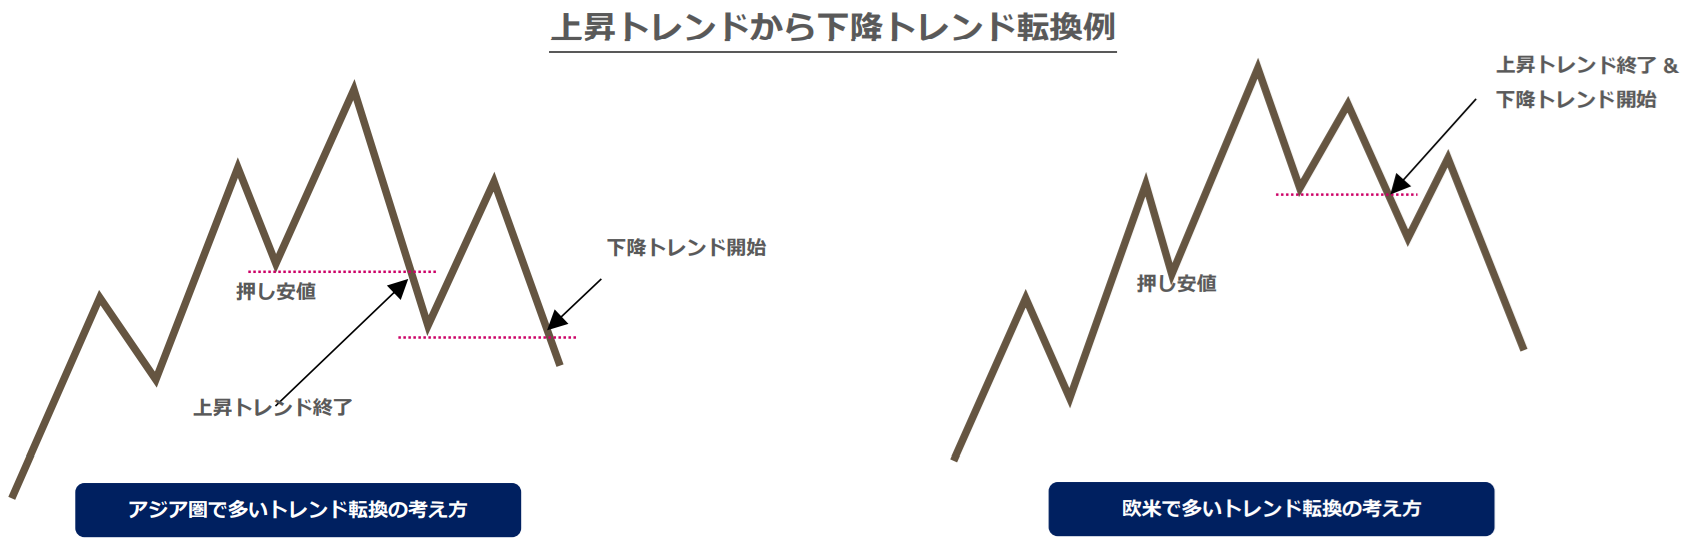
The left diagram shows the uptrend ending when the pullback low is breached, and the downtrend starting at the point of lower highs and lower lows.
The right diagram shows the uptrend ending at the point of lower highs and lower lows, regardless of a break below the pullback low, and the downtrend starting.
These two scenarios are not about which is correct; it’s important to understand that some market participants see the chart one way and others see it differently.
Sorry for the long discussion, but this concludes the Dow Theory report. It covers the minimum essentials to properly and effectively use Zone_Elliott, so please reread if anything is unclear.
Part 3 will cover Fibonacci. Fibonacci is closely related to Elliott Wave Theory, and proper understanding will certainly improve your market-reading ability, so let’s study together.