

Secret Report: Issue 1 About the Elliott Wave
Zone_Elliott Top Secret Report (PDF version) is here↓
https://www.gogojungle.co.jp/finance/navi/articles/89611
The contents of the report are as follows.
Introduction
Part 1 About Elliott Wave Theory
Part 2 About Dow Theory
Part 3 About Fibonacci
Part 4 About Multi-Time Frame
Part 5 Function Introduction of Zone_Elliott
Part 6 Practical Use of Zone_Elliott
Part 7 Mastering Zone_Elliott (Paid)
Part 1 About Elliott Wave Theory
Basics of Elliott Wave
If you want to study Elliott Wave but don’t know where to start, or if you know a little about Elliott Wave but want to relearn the basics, this content should be helpful.
Elliott Wave Theory is a chart theory discovered by American stock analyst Ralph Nelson Elliott in 1938.
The market follows certain cycles and moves by repeating those cycles.
Mr. Elliott originally was an accountant who fell ill and could not work, but he became deeply involved in stock market studies and was greatly influenced by Dow Theory, aiming to find the regularities of price movement using Fibonacci ratios. The fact that he used these numbers makes the theory particularly compatible with Dow Theory and Fibonacci.
Although it originated from the stock market, it is considered applicable to commodities, forex, and cryptocurrencies.
Because Elliott Wave Theory has this background, it is worthwhile for those interested in Dow Theory and Fibonacci to study it.
The core idea is that prices move in a 5-wave impulse followed by a 3-wave correction.
In Elliott Theory, the market progresses in five moves and then corrects in three moves. The five waves moving in the trend direction are called impulse waves, and the three waves in opposition are called corrective waves. The next important point is that these impulse 5 waves and corrective 3 waves are layered across multiple timeframes, overlapping in many scales.
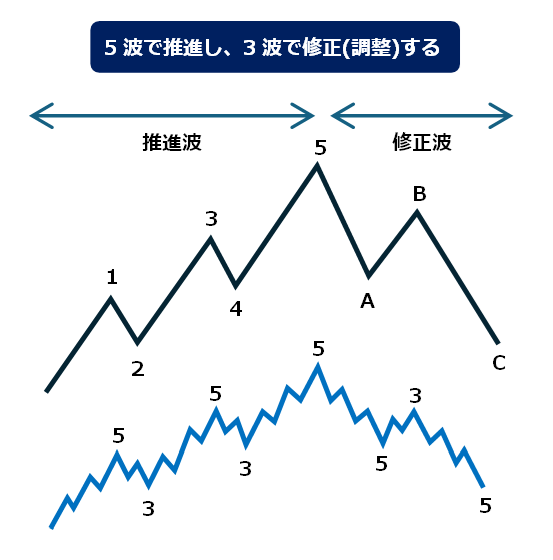
Elliott Wave is fractal in structure; as shown above, within rising waves 1 and 2, on different time scales, the structure is 5-wave impulse and 3-wave correction. Therefore, distinguishing impulse 5 waves and corrective 3 waves is extremely important.
* In the remainder of this document, instead of labeling corrective waves as A, B, C, we will use 1, 2, 3 for the waves.
Basic Principles of Elliott Wave
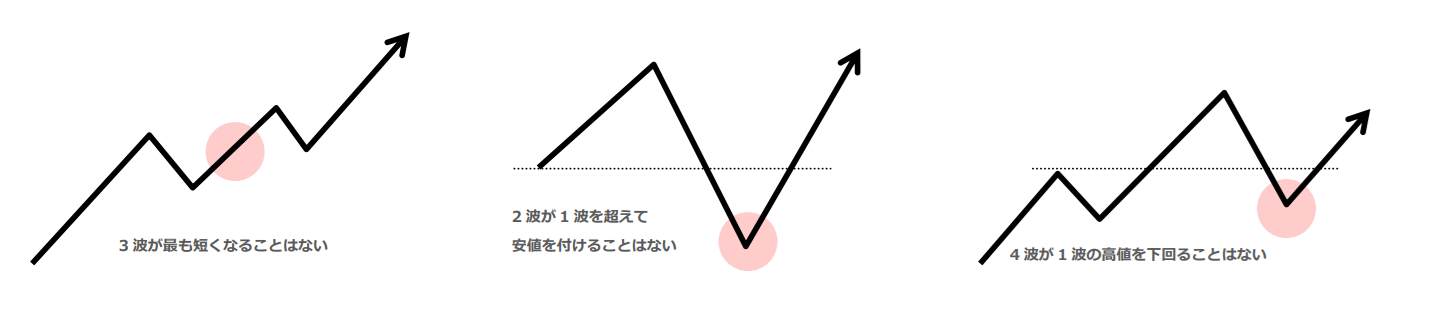
◇ The basic principles of Elliott Wave are mainly three:
1> In impulse waves, the 3rd wave is never the shortest among waves 1-5.
2> The 2nd wave of the impulse should not move below the starting price of wave 1.
3> The 4th wave of the impulse should not pierce the high of wave 1.
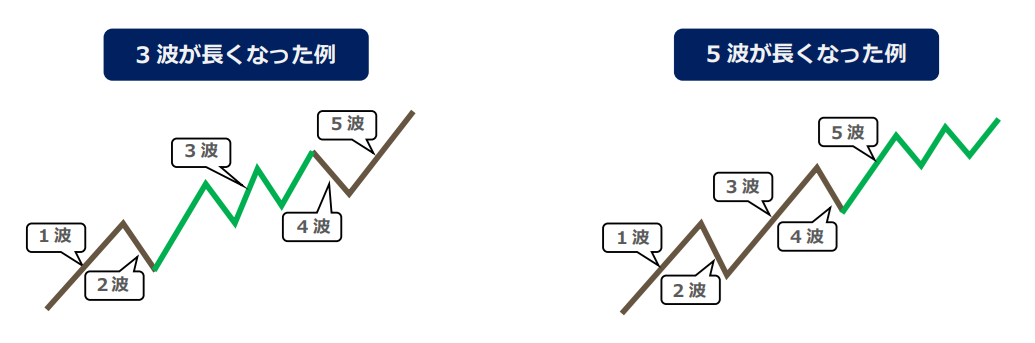
Elliott Wave Extensions
When you look at charts, you may see structures close to Elliott Waves, but with patterns broken or different numbers of waves. These are deformations called “extensions.” A common extension is that waves 3 or 5 become longer.
Each wave of the rising 5 waves has the following characteristics:
● Wave 1 = a gradual move that gradually clarifies direction.
● Wave 2 = a strong move in the opposite direction that almost cancels Wave 1. Volume declines as it converges.
● Wave 3 = usually the strongest and longest move, often covering the largest price range among the five waves.
● Wave 4 = a complex movement with high volatility, often near consolidation. It tends to be flat or form a triangle/range.
● Wave 5 = a bubble-like surge with strong speed and momentum, often reaching new highs.
What are the “pullback low” and “retracement high” important for identifying Wave 1?
● Pullback low
The low that becomes the origin of the price move that first breaks above the most recent high. Also, if you break above the retracement high, the origin price moves up and is called the pullback low.
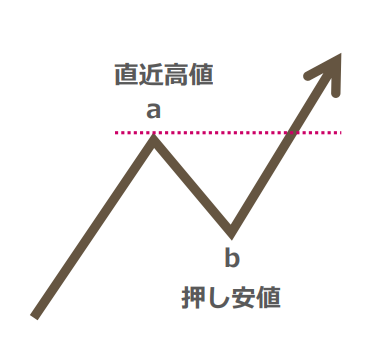
When the line of the most recent high (a) is broken to the upside, the ZigZag low (b) at that origin becomes the pullback low.
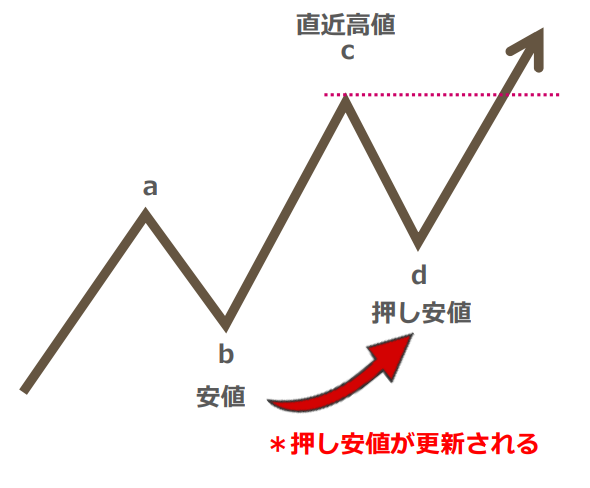
When the price rises further and breaks again above the most recent high (c), ZigZag low (d) becomes the new pullback low, and b becomes the new low.
● Retracement high
The high that becomes the origin of the price move that just broke below the most recent low. Also, if you break below the pullback low, the origin price becomes the retracement high.
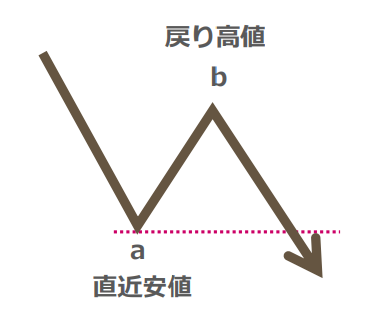
When the line of the most recent low (a) is broken down, the ZigZag high (b) at that origin becomes the retracement high.
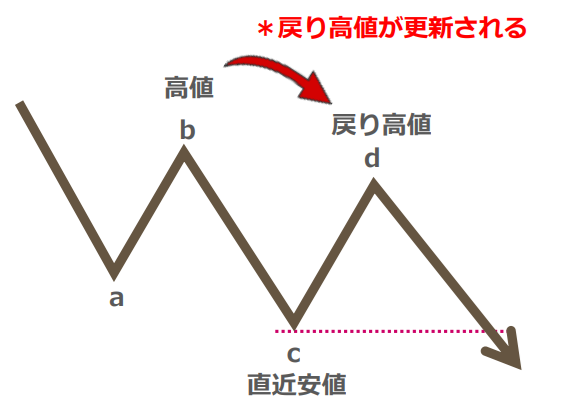
If the price moves lower and breaks the most recent low (c) again, the ZigZag high (d) becomes the new retracement high and b becomes the high.
How to identify Wave 1
To identify Elliott Waves, you first need to locate Wave 1, so we will start with how to find Wave 1.
● Definition of Wave 1
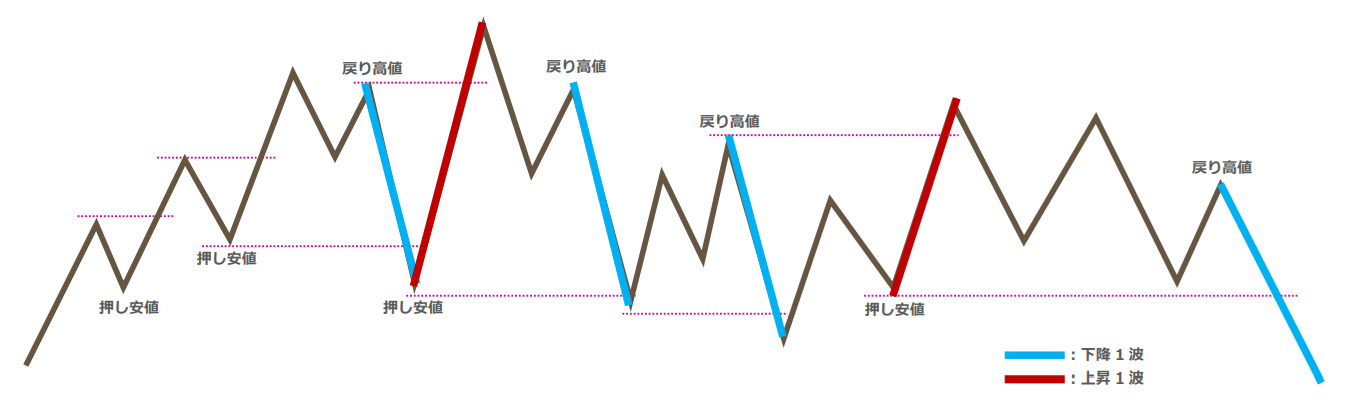
If the retracement high is broken to the upside, this is Wave 1 of an up move; if the pullback low is broken to the downside, this is Wave 1 of a down move.
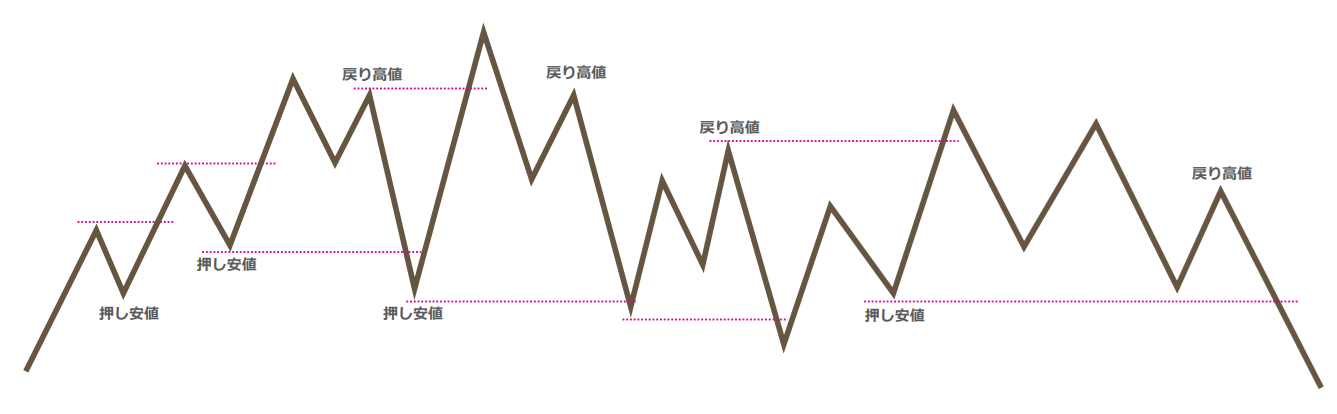
Did you correctly understand pullback lows and retracement highs?
The diagram above shows pullback low/retracement high according to the rules. Breaking below the pullback low triggers a “Downward Wave 1,” and breaking above the retracement high triggers an “Upward Wave 1.” However, in range-bound markets like the above, the Wave 3 that is supposed to extend after Wave 1 does not occur, so Elliott Wave theory is not functioning at all in this context.
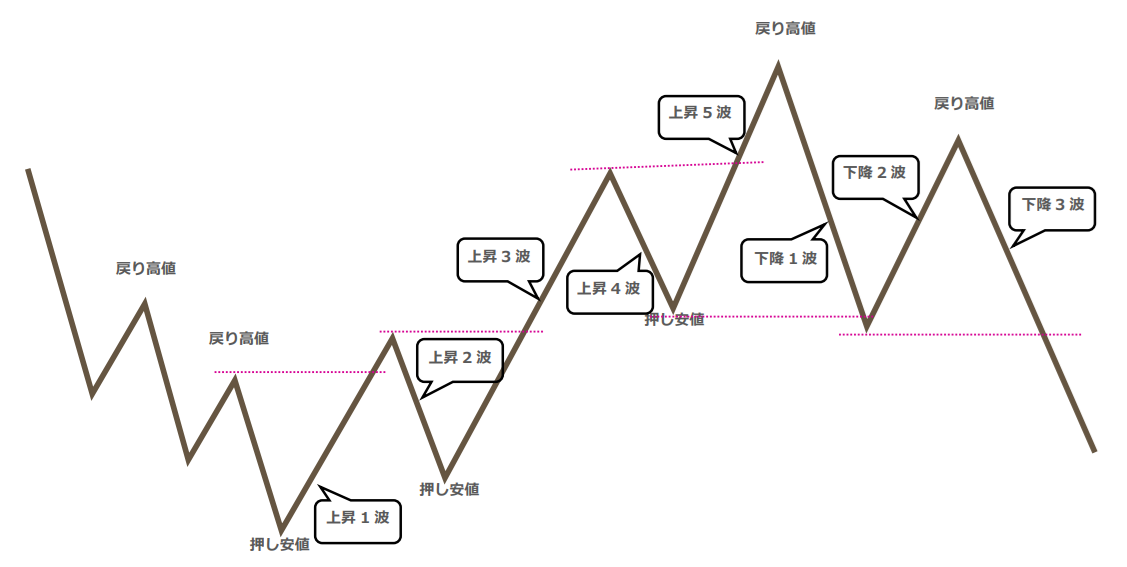
If you draw Elliott Wave on the market in the previous page, the figure above shows that Wave 1 moves up after breaking above the retracement high, but Wave 2 collapses and Wave 3 does not occur; likewise, breaking below the pullback low triggers Wave 1 downward, but Wave 2 collapses and Wave 3 downward does not occur. In markets like this, higher timeframes are likely in a range.
Details are explained on Zone_Elliott’s detailed explanation page, but indeed, if you break below all pullback lows, Wave 1 downward occurs; if you break above all retracement highs, Wave 1 upward occurs. This yields many false signals and Elliott Wave theory does not function properly, so Zone_Elliott uses the concept of zones to determine Wave 1 downward/upward and excludes waves that may be false signals.
So, in what situations is Wave 1 desirable? Let’s think together. For each wave, what conditions and movements are more likely? Consider the characteristics of each wave.
From the perspective of investor psychology, it becomes easier to capture the characteristics of each wave.
| Wave Up 1 | Before Wave 1 appears, the downtrend is assumed to be continuing. This is a rebound movement within a mainly downtrend, considered a temporary counter-move by most investors who believe the downtrend will continue. |
| Wave Up 2 | Since Wave 1 moved in a downtrend, the upward move is vulnerable to selling pressure as a retracement in a downtrend, making Wave 2 a deeper retracement. |
| Wave Up 3 | Typically the strongest and longest; often the widest in volume. Wave Up 3 confirms rising prices with higher highs and higher lows, creating a phase where downward-trend sellers take profits and new buyers enter. |
| Wave Up 4 | Wave 4 tends to be complex and long-lasting. Profit-taking selling and dip buying become balanced, leading to complexity and duration. Wave 4 often forms flats or triangles = ranges. |
| Wave Up 5 | Wave 5 is a clear uptrend with bullish sentiment, but the price is near highs and the upward speed slows; early participants take profits as the trend begins. |
| Wave Down 1 | Most market participants perceive the uptrend to be continuing. Early participants begin to take profits as the trend starts to consolidate. |
| Wave Down 2 | A wave likely to be a trap in the ongoing uptrend; in reality, it is a temporary rise that leads to the next downtrend. |
| Wave Down 3 | A large drop. Profit-taking in the preceding uptrend, new selling pressure, and stop-loss of Wave 2 cause a substantial fall. |
This concludes the Elliott Wave report. It covers the essential content for correctly utilizing Zone_Elliott, so please read repeatedly if you have questions.
The second part will cover Dow Theory. Dow Theory is closely related to Elliott Wave Theory, so understanding it correctly will certainly improve your ability to read the market. Let’s study together with effort.