

Utilization of "Visualization Indicator" (Part 198)
Utilization of the "Visualization Indicator" (its198)
1. Evolving the "28 Currency Pairs List Indicator" into a more advanced indicator
"8CPVisualization Indicator"to drawUSDJPY.
The "8CPVisualization Indicator" hasOceania版,London版,NewYork版,AnyCPAnyCP版. This time we used theLondon版.
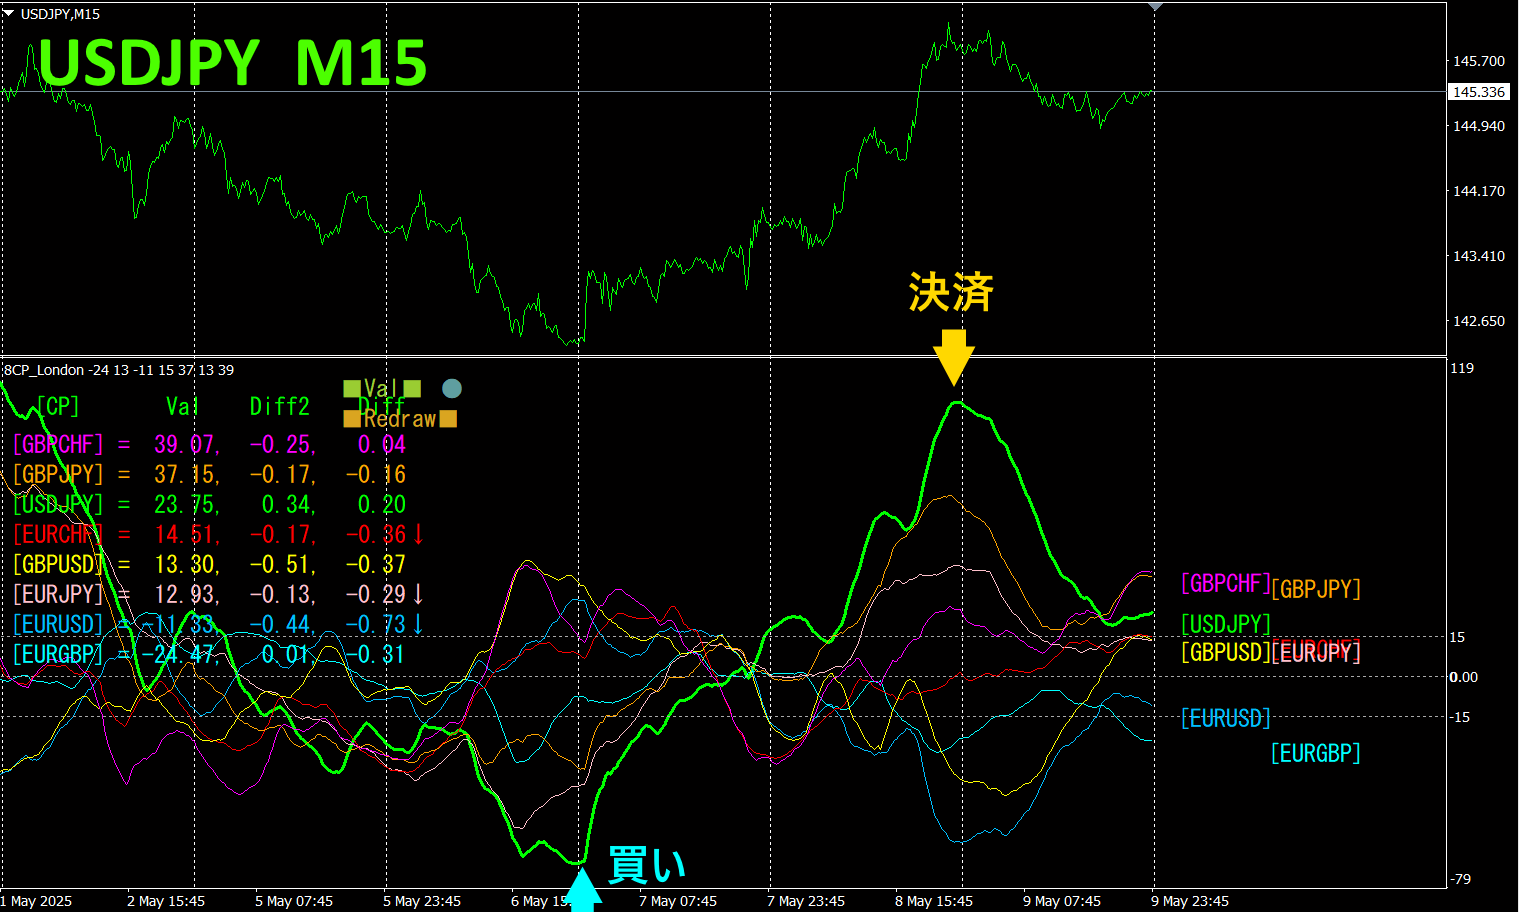
The upper half is theUSDJPY 15-minute chart. The lower half is from the “8CP Visualization Indicator, where the green thick line graph corresponds toUSDJPY.
On Wednesday, USDJPY reversed from a bottom and began to rise, so we entered a buy. On Friday, the graph reached a peak, so we closed the position. About360pips of profit was earned. By aiming only for the movement’s "rising part," we secured solid profits.
If you use the "TrendLine-EX," you can automate entries and exits by crossing diagonal trend lines. You can leave it as is for easy trading. The "TrendLine-EX is a semi-automatic EA that can short automatically when the trend line is broken downward and automatically close positions when it’s broken upward.
2. Best SelectTry the indicator
The figure below is a screenshot taken on2025 year59 day01:17JST
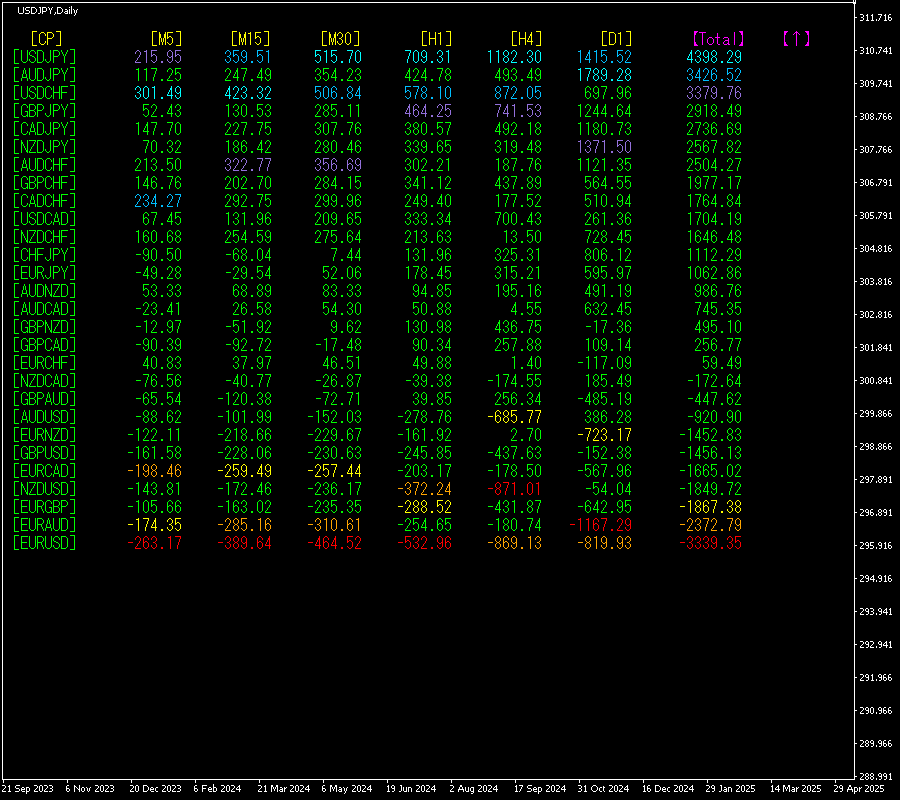
[Total]Values are ordered in descending order. The USDJPY at the top is displayed in blue across all timeframes.Total value is4398.29, indicating a large positive figure.USDJPY shows a significant uptrend.
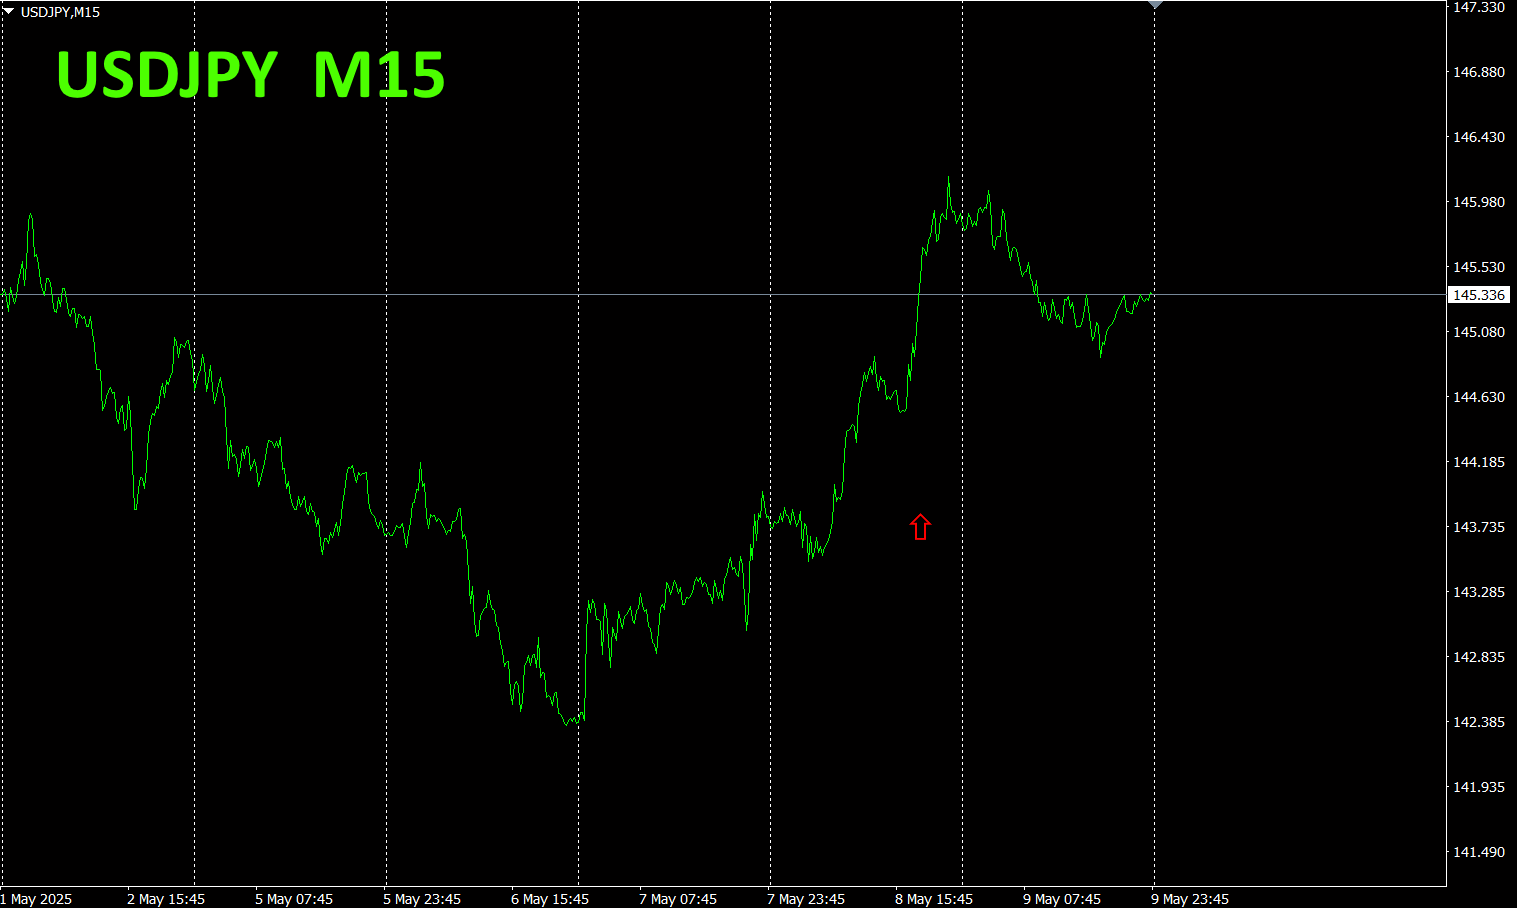
Now, let’s look at the USDJPY chart.
The red arrows mark the screenshot point, capturing a mid-uptrend surge.
The “28 currency pairsBest Select indicator allows you to easily identify which currency among the 28 pairs is currently showing the strongest trend. It also indicates, with numbers and colors, whether you should trade now. It’s an excellent indicator for quickly assessing all currency pairs’ movements.
The “28 currency pairsBest Select indicator”

https://www.gogojungle.co.jp/tools/indicators/35128
3. 2021 year5 monthから trackingEURJPY's movement since
2021年5月からEURJPYの動きを追っています。
To view the overall trend, a30分足 chart shows roughly3 weeks of data.
Previously, I wrote the following.
Pink isEUR, green isJPYJPY is level and slightly upward,EUR is downward. Therefore,EURJPY is expected to trend slightly downward.
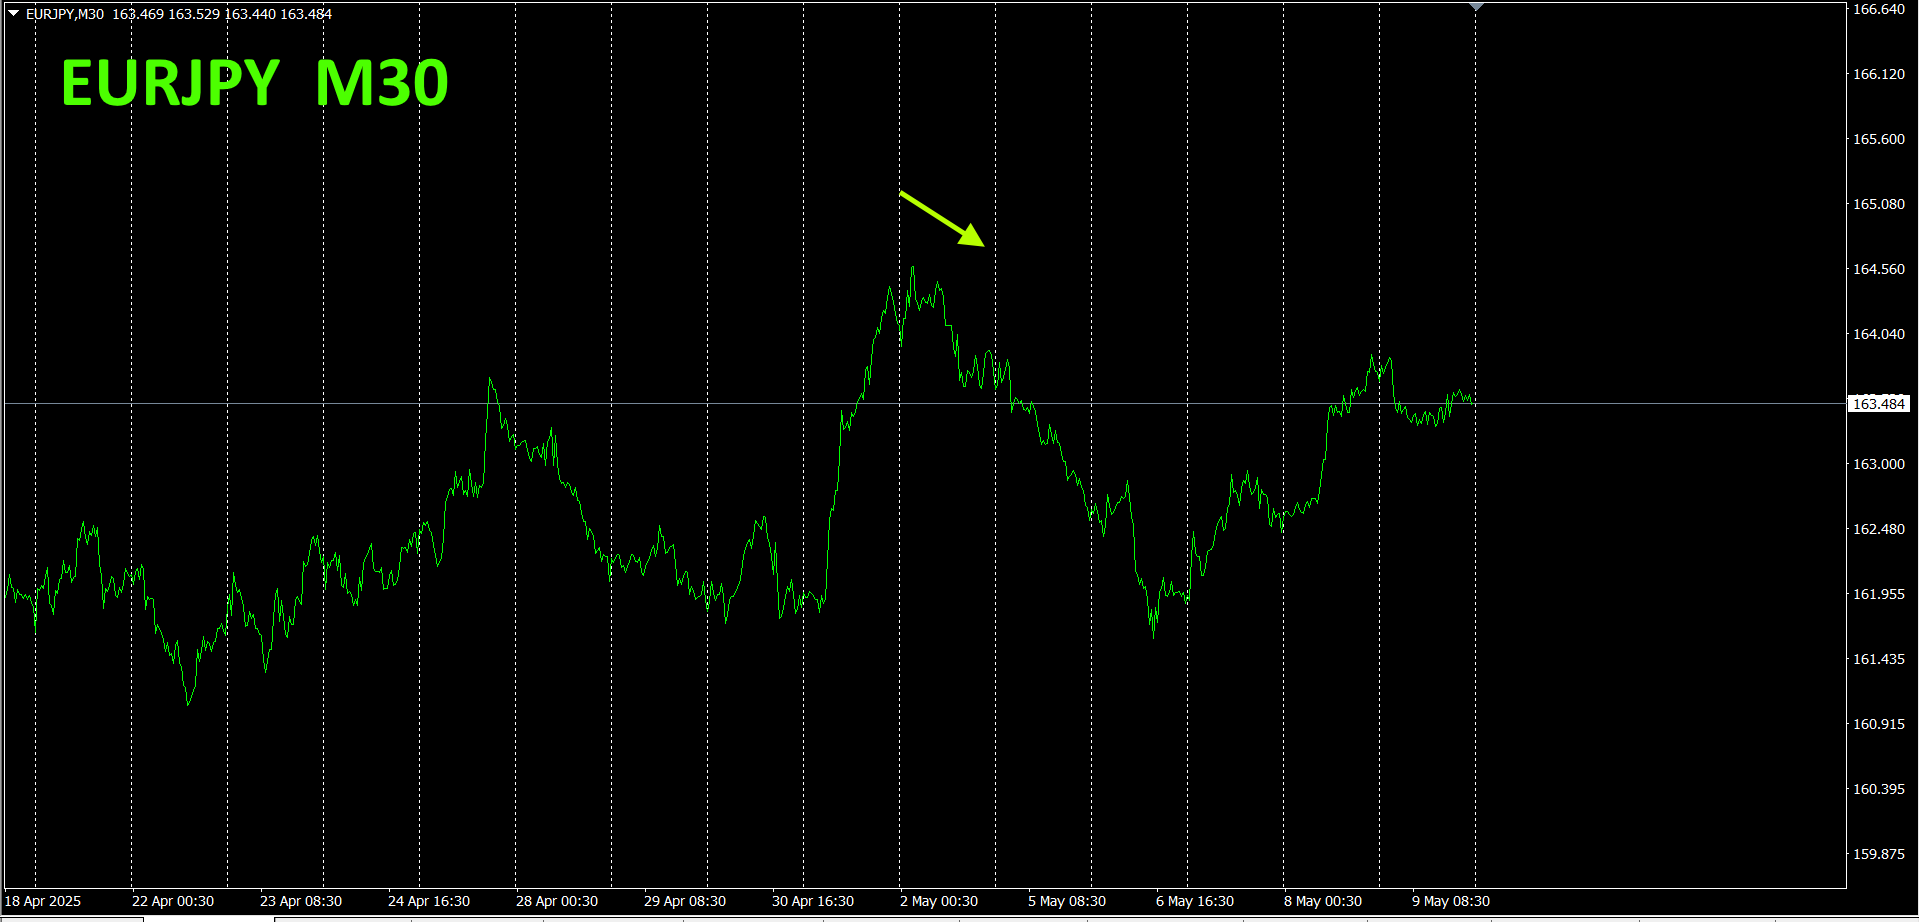
As expected, it moved slightly downward. It fell in the first half of the week and then turned upward.
30 分足の通貨強弱チャートです。
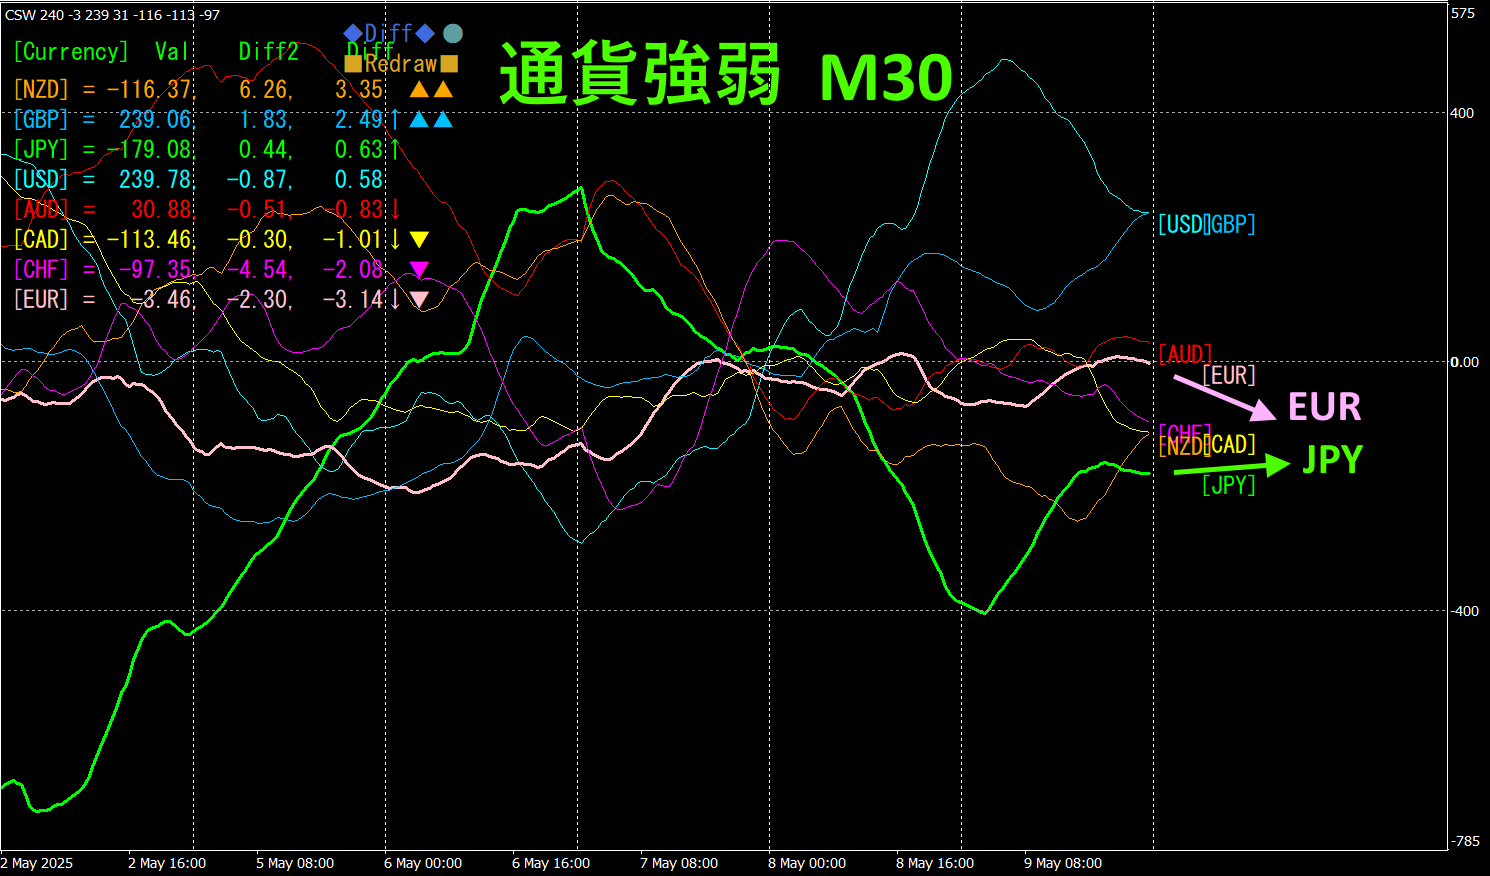
Pink isEUR, green isJPY. The currency strength chart showsJPY is slightly upward from the horizontal, downward. Therefore,EURJPY
4. Using the Visualization Indicator on the daily chart
The figure below shows the “8CP Visualization Indicator Oceania version displayed on a daily chart.
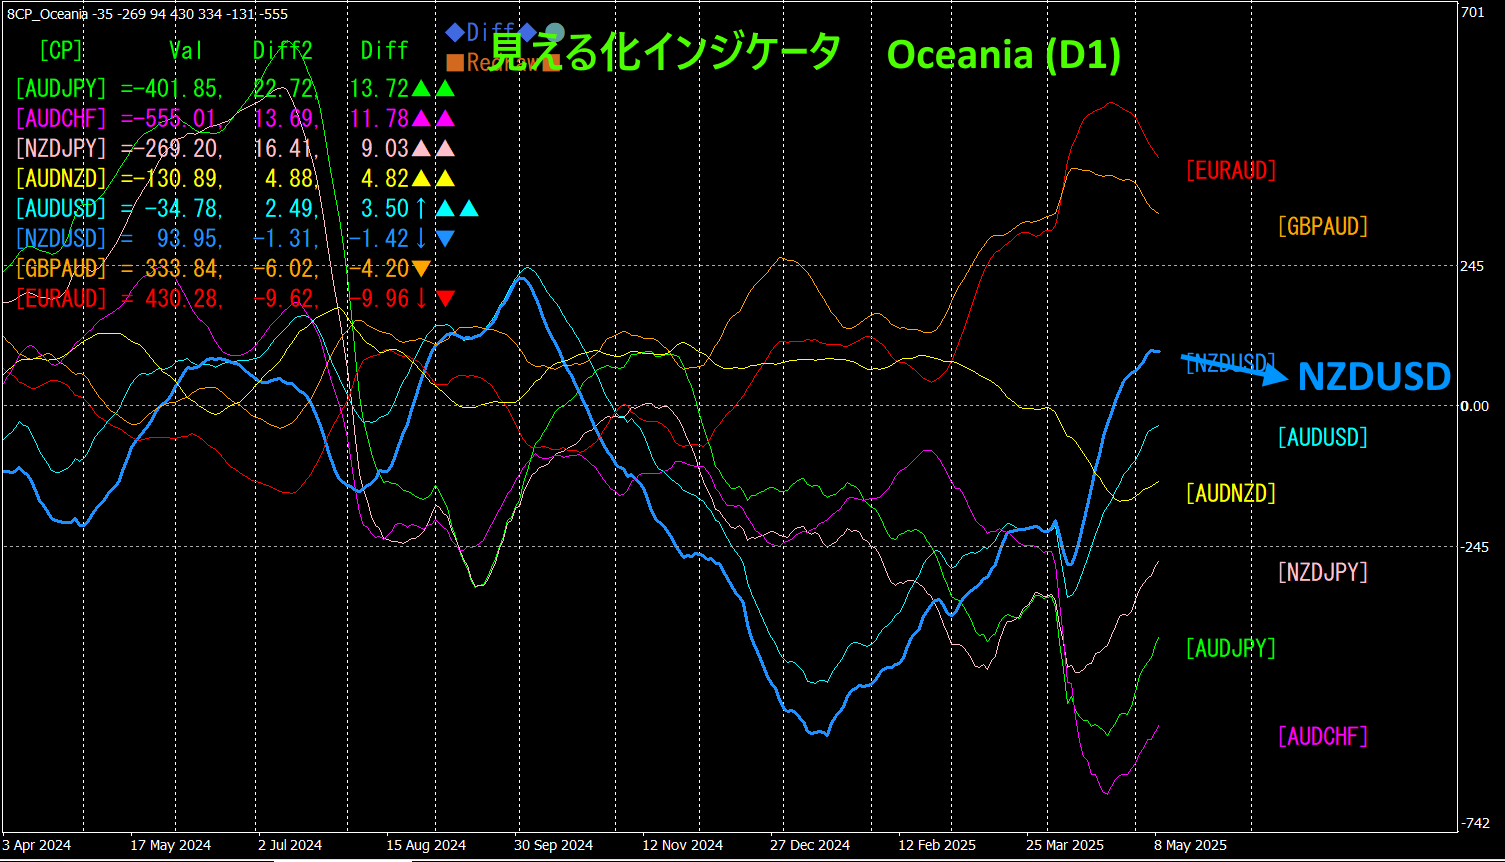
NZDUSD last week’s momentum slowed, but this week it finally plateaued and started moving downward. With the daily vector pointing downward, you should close buy positions.
Recommended indicators
“Tore Tore Indicator”
https://www.gogojungle.co.jp/tools/indicators/50115
“TrendLine-EX”
https://www.gogojungle.co.jp/tools/indicators/42257

“8C Currency Strength Visualization Indicator” please refer to the following page.

MT4 version https://www.gogojungle.co.jp/tools/indicators/39150
MT5 version https://www.gogojungle.co.jp/tools/indicators/39159
【Products I have listed】


