

Use of the "Visualization Indicator" (Part 197)
The use of the "Visualization Indicator" (its197)
1. Advance and develop the "28 Currency Pair List Indicator" into an indicator
“8CPVisualization Indicator”to drawAUDJPY.
“8CPVisualization Indicator” includesOceania版,London版,NewYork版,AnyCP版. This time, I used theOceania版.
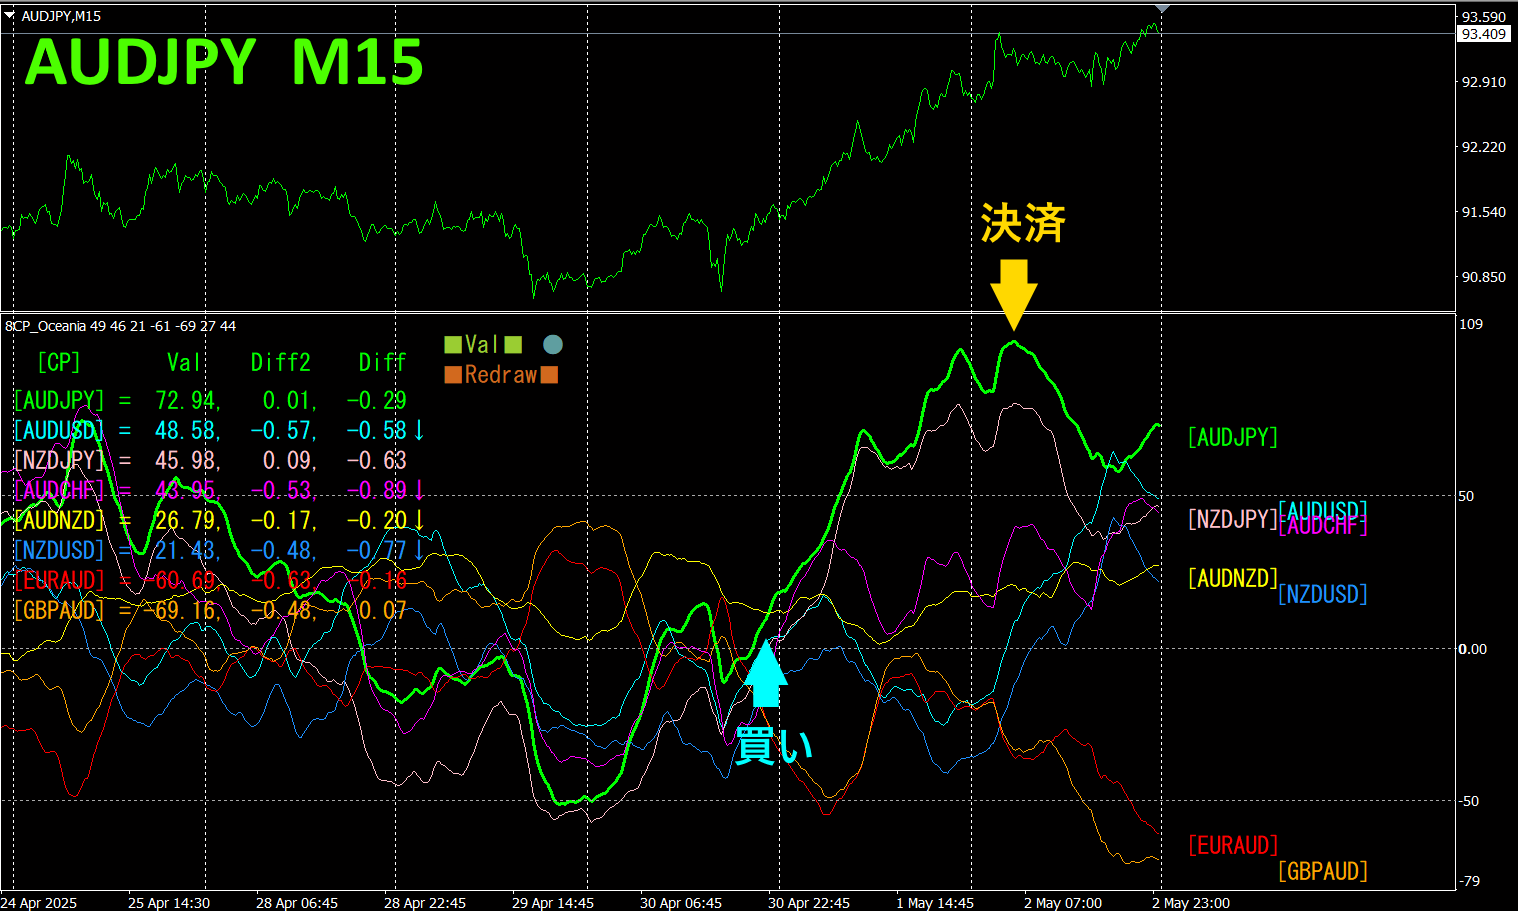
The top half is an AUDJPY15-minute chart. The bottom half is from the “8CP8Visualization Indicator,” and the graph in green bold line corresponds toAUDJPY.
On Wednesday, AUDJPY rose above the other chart groups, so I entered a buy. On Friday, the chart reached a peak and I closed the position. About180pips of profit was obtained. “Targeting only the parts that stand out from other chart groups” is effective.
If you use “TrendLine-EX,” you can automate entry and exit at diagonal trendline breaks. You can just leave it as is, enabling easy trading. “TrendLine-EX is a semi-automatic EA that can auto-sell on a break below a trendline and auto-close on a break above a trendline.
2. Best SelectTry the indicator
The diagram below is a screenshot taken onMay,2025,2,09:54(JST) .
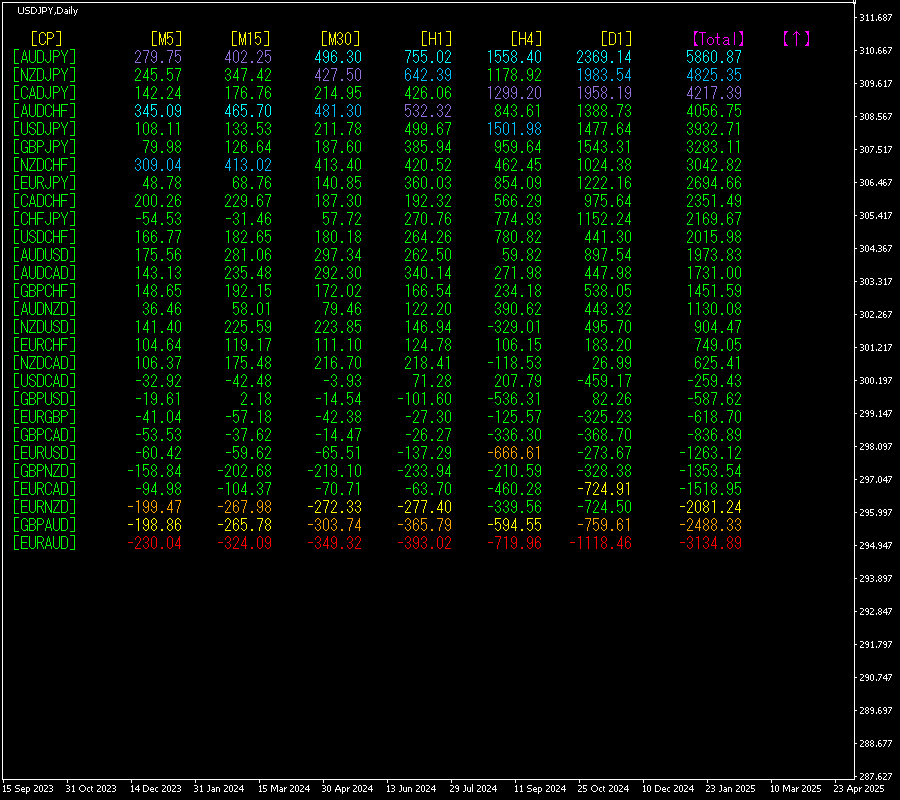
[Total]Numbers are arranged in descending order. At the top,AUDJPY shows blue in all timeframes.Total value is5860.87, a large positive number. This indicates a strong upward trend forAUDJPY.
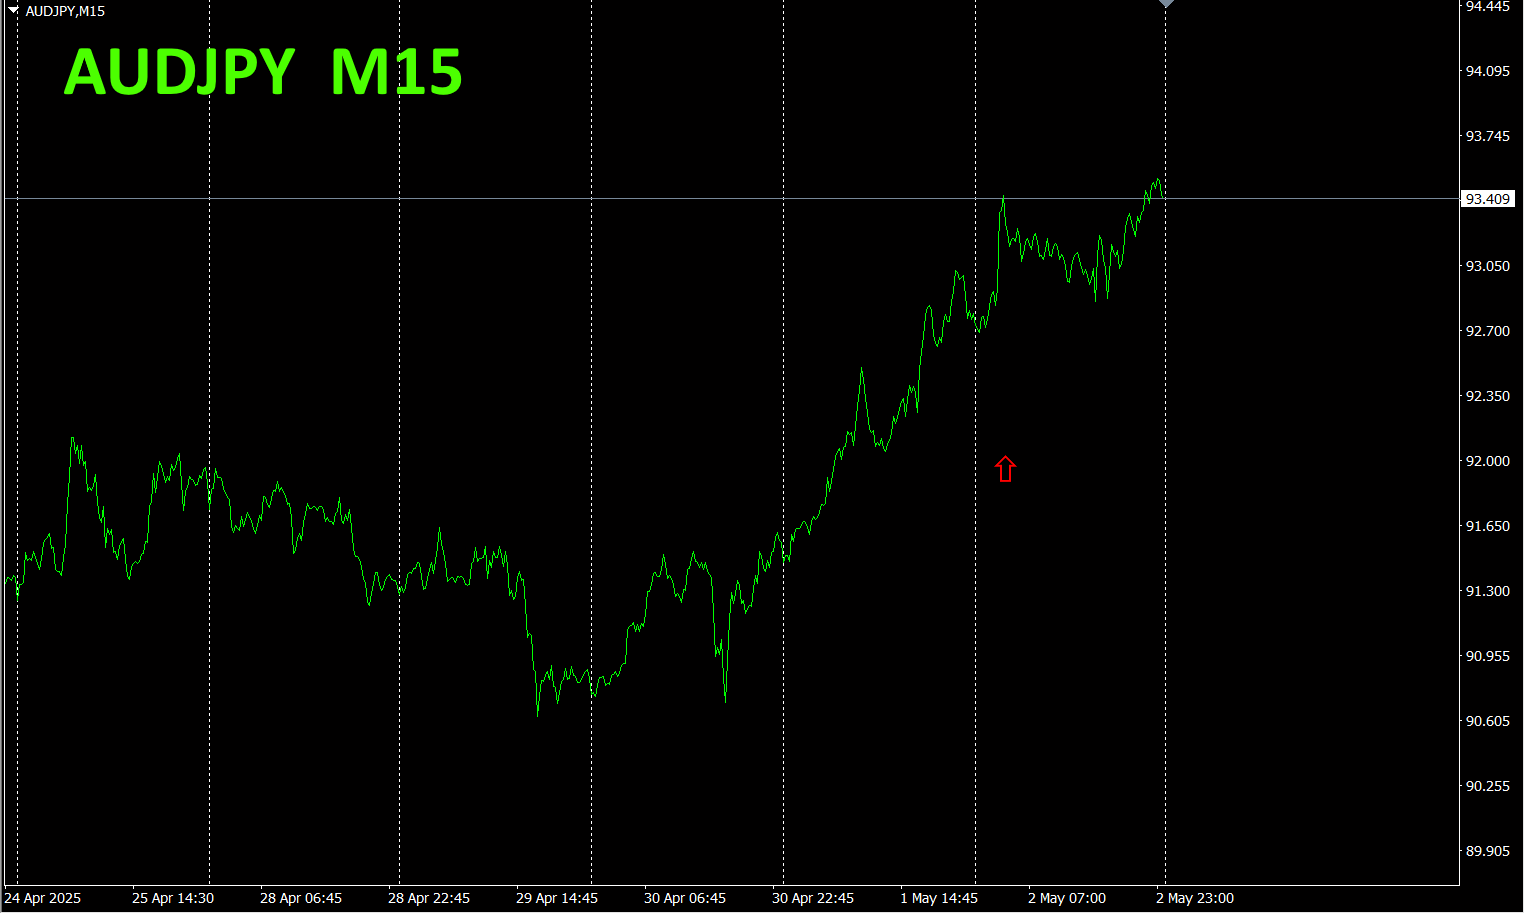
Now, let’s look at the AUDJPY chart.
The red arrows indicate where the screenshot was taken. It captures the rapid rise in the middle of an uptrend.
“28 Currency Pairs Best Select Indicator” allows you to easily identify which currency among 28 pairs is currently showing the strongest trend. It also tells you, by numbers and colors, whether you should trade now. It’s a superb indicator for judging all currency pairs at a glance.
“28 Currency Pairs Best Select Indicator”
https://www.gogojungle.co.jp/tools/indicators/35128

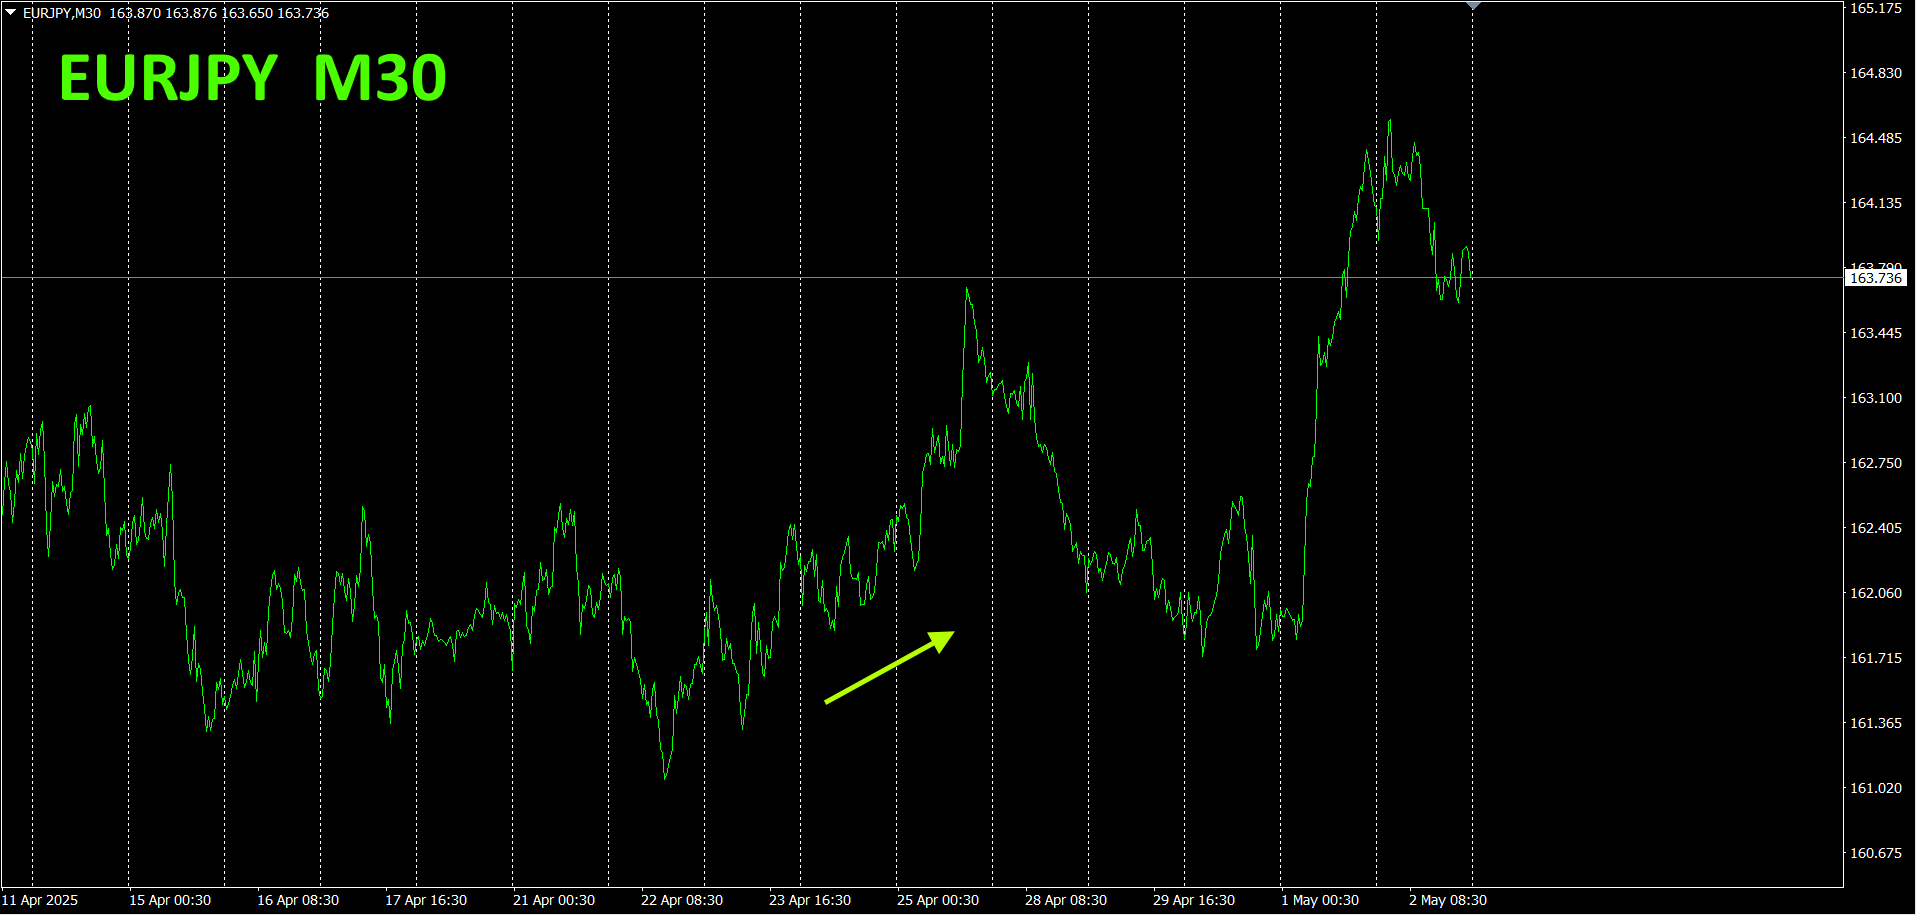
3. 2021 May,EURJPY
2021 May,EURJPY movement was tracked.
To view the overall trend, a 30-minute chart showing roughly the last3 weeks is drawn.
Previously I wrote the following.
Pink isEUR, green isJPY. In the currency strength chart, the recent direction showsJPY is horizontal,EUR trending downward, but from a long-term perspective,JPY seems to head downward andEUR upward. (Large dashed arrow)
EURJPY is expected to rise slightly in the future.
As expected, the overall direction appears to be upward. It depends on currency strength, butEUR>JPY means it will rise overall.
30-minute currency strength chart.
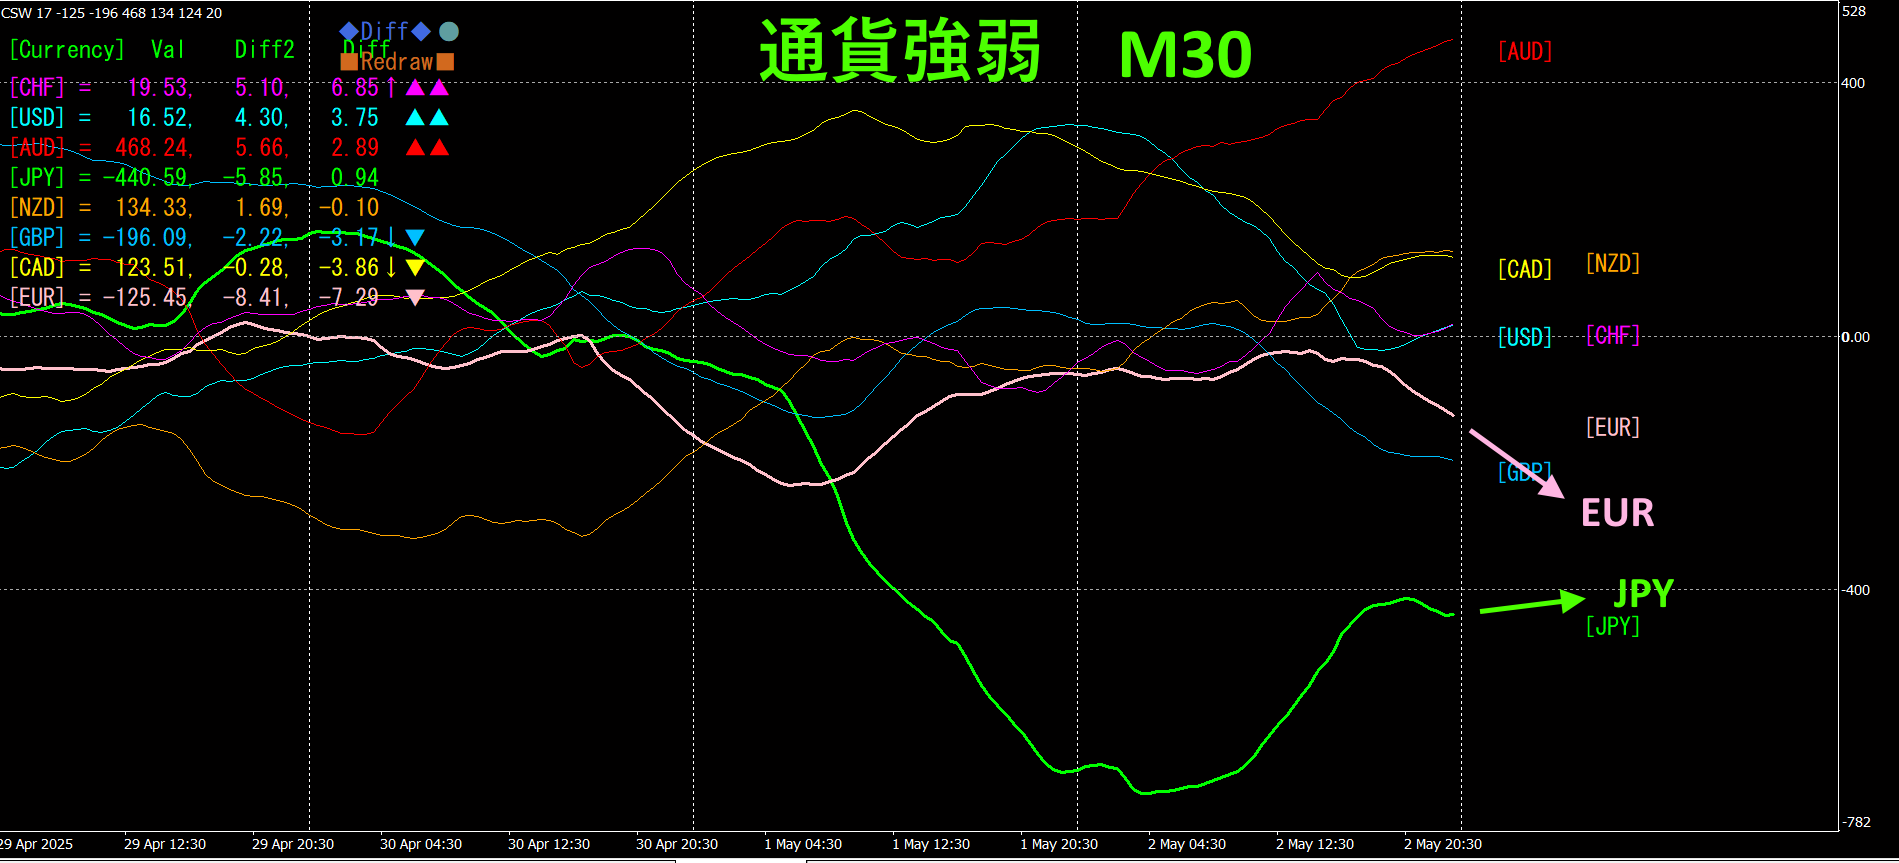
Pink isEUR, green isJPY. In the currency strength chart, the recent direction showsJPY is horizontal to slightly up, downward. Therefore, is expected to trend slightly downward.EURJPY
4. Using the Visualization Indicator on the daily chart
The diagram below shows the “8CP Visualization Indicator” Oceania version on the daily chart.
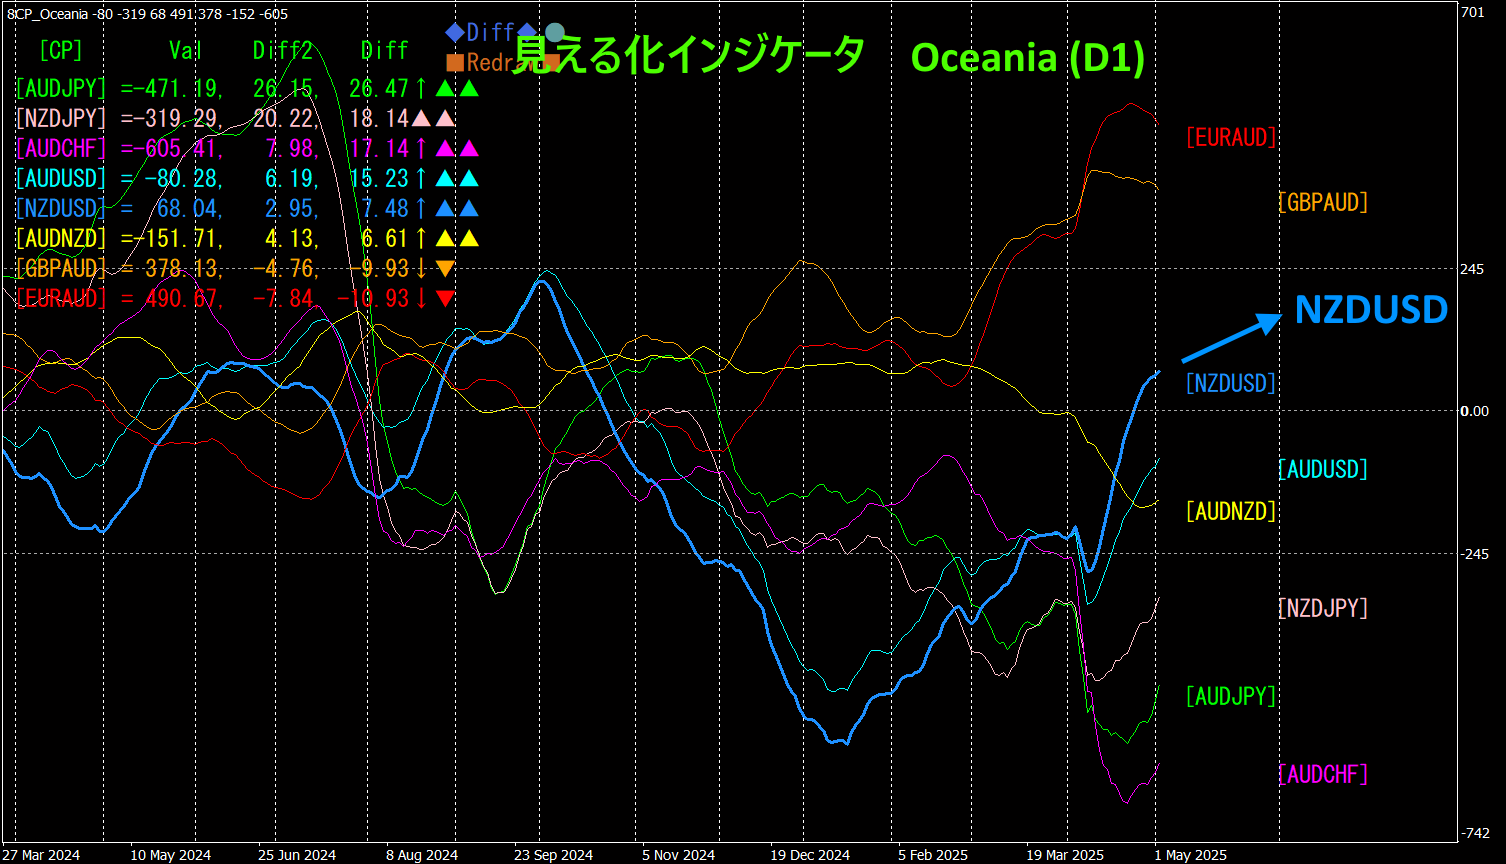
NZDUSD had been rising at a steep angle, but the speed seems to have slowed. Since it also broke above the zero line, it may be time to consider exiting.
Recommended indicators
“Toretore Indicator”
https://www.gogojungle.co.jp/tools/indicators/50115
“TrendLine-EX”
https://www.gogojungle.co.jp/tools/indicators/42257

“8C Currency Strength Visualization Indicator” please refer to the following page.

MT4 version https://www.gogojungle.co.jp/tools/indicators/39150
MT5 version https://www.gogojungle.co.jp/tools/indicators/39159
【Items I have for sale】


