

【GOLD Deep Dive】※Repost of past article: Delving into GOLD's Buying Climax
Hello, I’m Trader Tengen.
The Trump tariff market seems to have accelerated in a direction different from initial expectations.
It’s a “triple drop for US sellers.”
Many are watching what will happen to the US dollar, but even the safe-haven GOLD has seemed to surge too sharply in one direction.
From a long-term perspective, GOLD still looks like it can rise further, which is why a “correction” is needed.
It’s not just a temporary GOLD bubble; there are multiple fundamental factors suggesting GOLD will stay strong in the future as well.
That’s why this is not a single option of “just buy aggressively.” Let’s thoroughly load up in GOLD with the aim of building wealth from GOLD, and go deep.
So, this time the theme of the deep-dive is “Is GOLD overbought?”
Now, let’s analyze right away!
◉ Current GOLD Chart Analysis
Point of Interest ①: The Correction
GOLD was rising while forming a pullback that could be seen as a correction.
We will check the peak formed since 2009 and the approaching sense of a top to see whether a correction is warranted from the condition side.
〇 What I want to focus on is the condition of a topping in the monthly chart.
1. RSI overbought territory
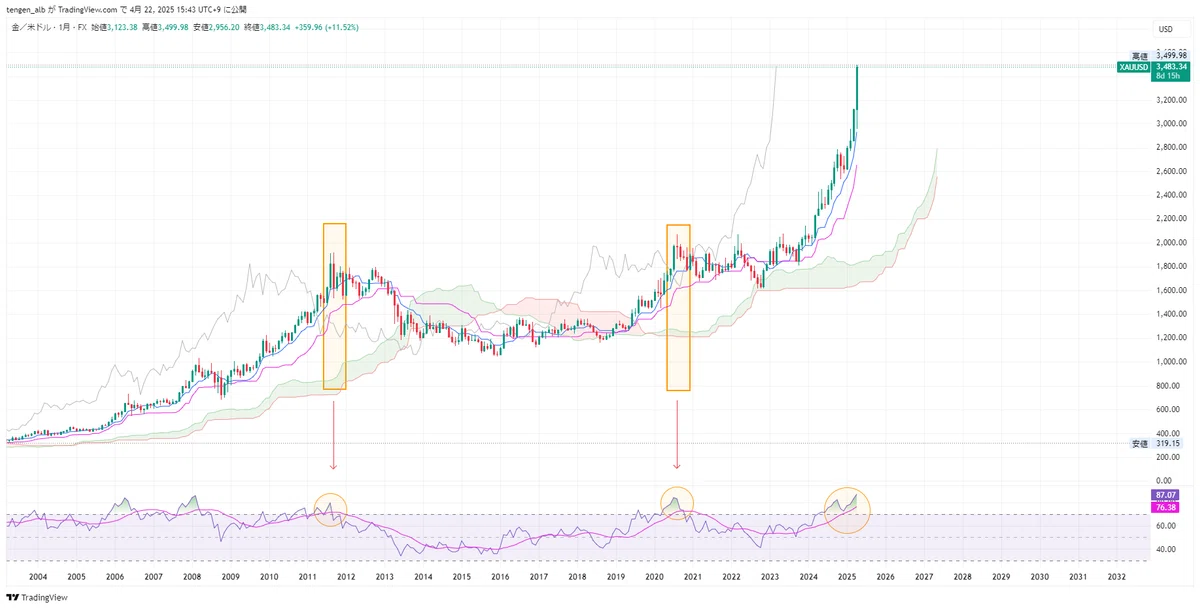
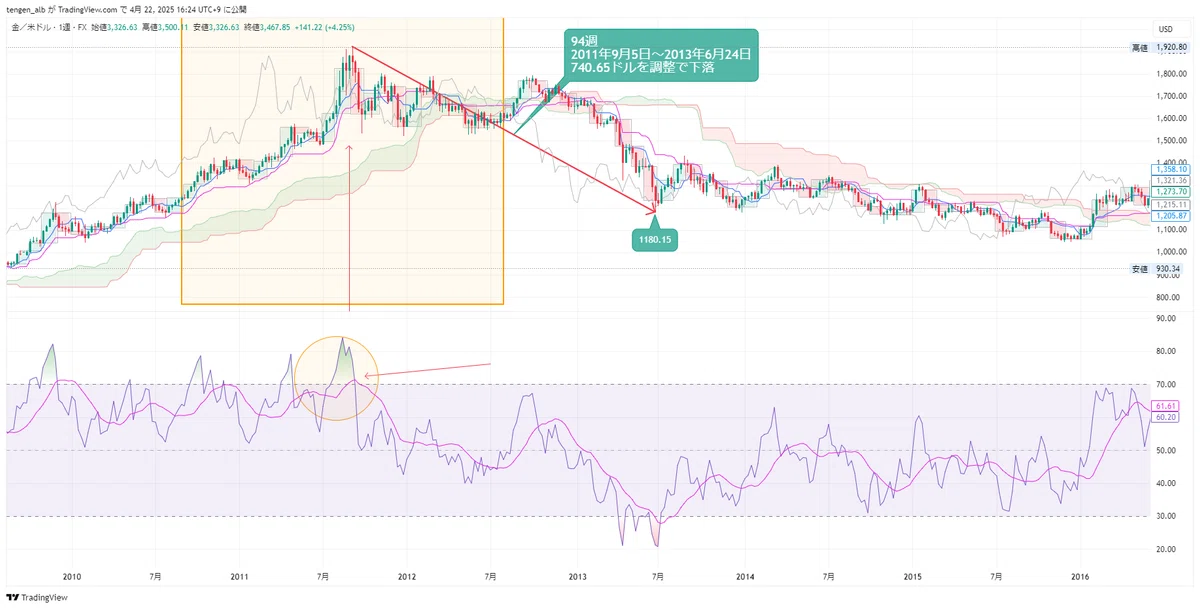
Monthly
Indeed GOLD has been rising in an uptrend, but…Both in 2011 and 2020 it showed a peak in August
RSI on the monthly chart exceeds 80, indicating overheating
2. RSI moving average exceeding 80 marks the peak

Since 2009, the RSI moving average has exceeded 80 three times, including this sharp rise.
In the past two times, both formed a top.
If merely RSI exceeding 80 is considered, it has occurred 8 times, reducing reliability for declaring a top.
However, if we add the condition that the RSI moving average also exceeds 80, the criteria for identifying a top become more accurate.
3. Price action when a Dead Cross occurs between RSI and the moving average?
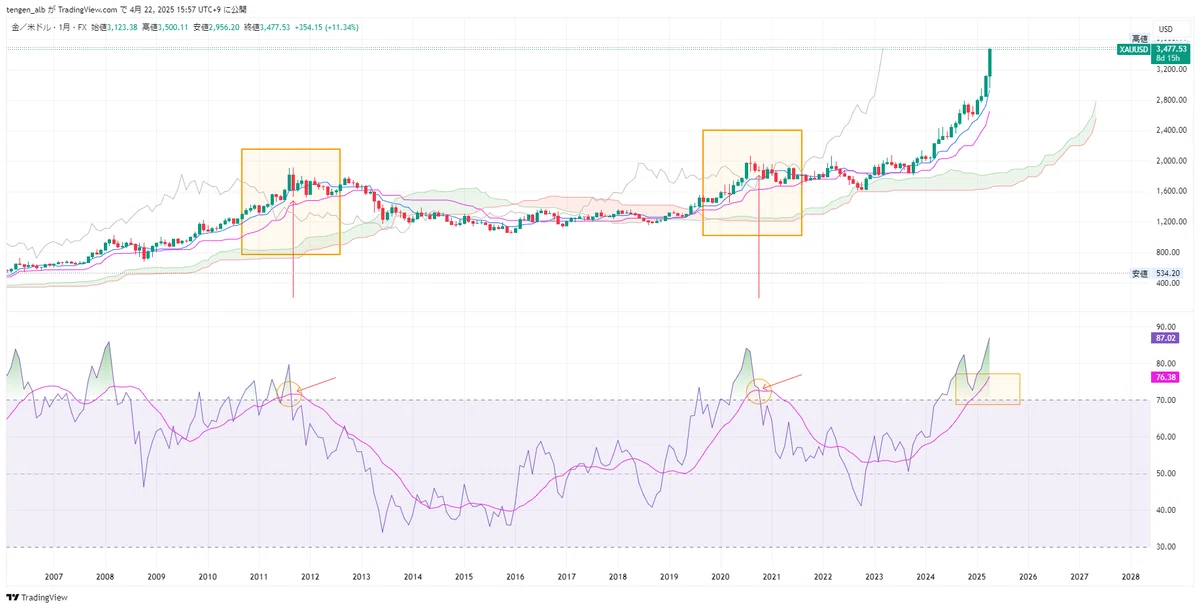
Expanded RSI
First, a big bearish candle (September 2011)
Second, a long upper shadow with a small body (October 2020)
Both are price actions that deny further upside.
Let’s check the daily chart at that time.
〇 September 2011
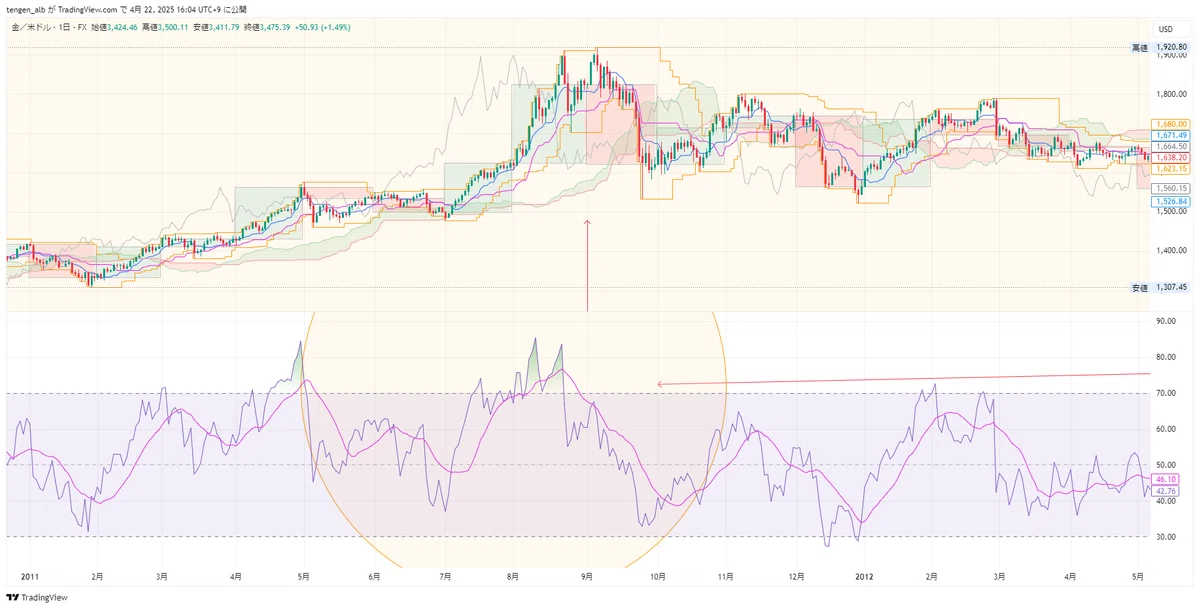
I intentionally changed the analysis chart from monthly to daily.
On the daily chart, a double top is formed and the 10-day low was broken.
While overlaid with the monthly chart, the August bullish candle led to a high in September and then a low in the outside bar
The lagging line shows the strength of price movement and its deceleration.
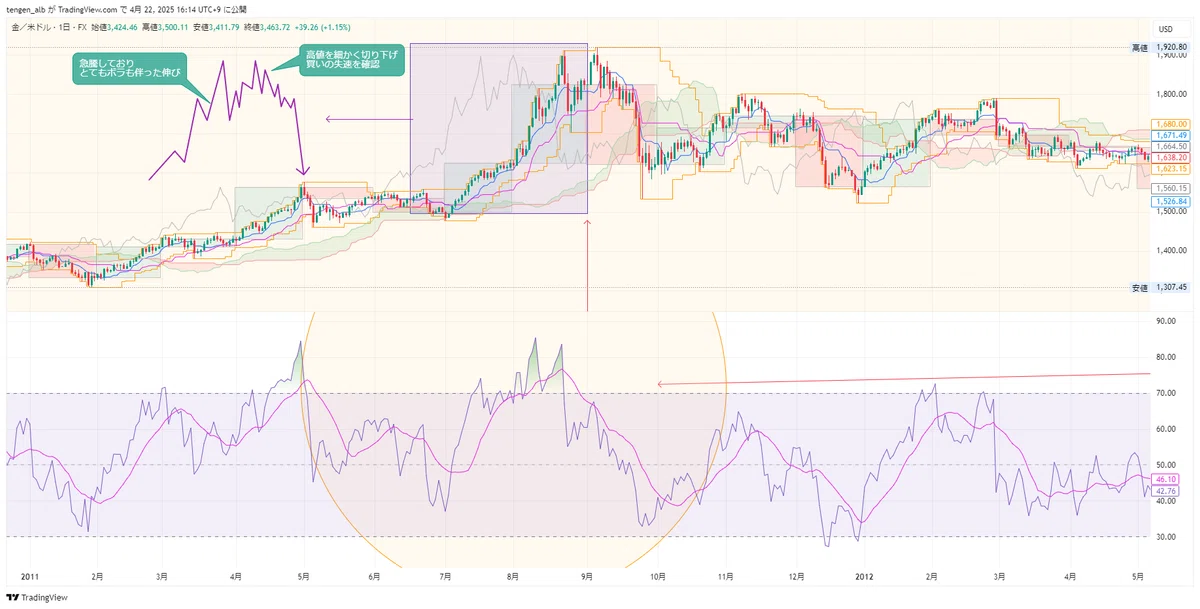
I annotated the chart, but when the lagging line and the candle form a Dead Cross, I copied the lagging line to the left. The left peak shows a sharp rise, but
after the pullback broken, the upside became heavy and stalled (the lagging line is based on closing price, so wicks are not shown)
Correction magnitude and duration after the top
Displayed on a weekly basis
〇 November 2020
We’ll also check this on a daily chart.
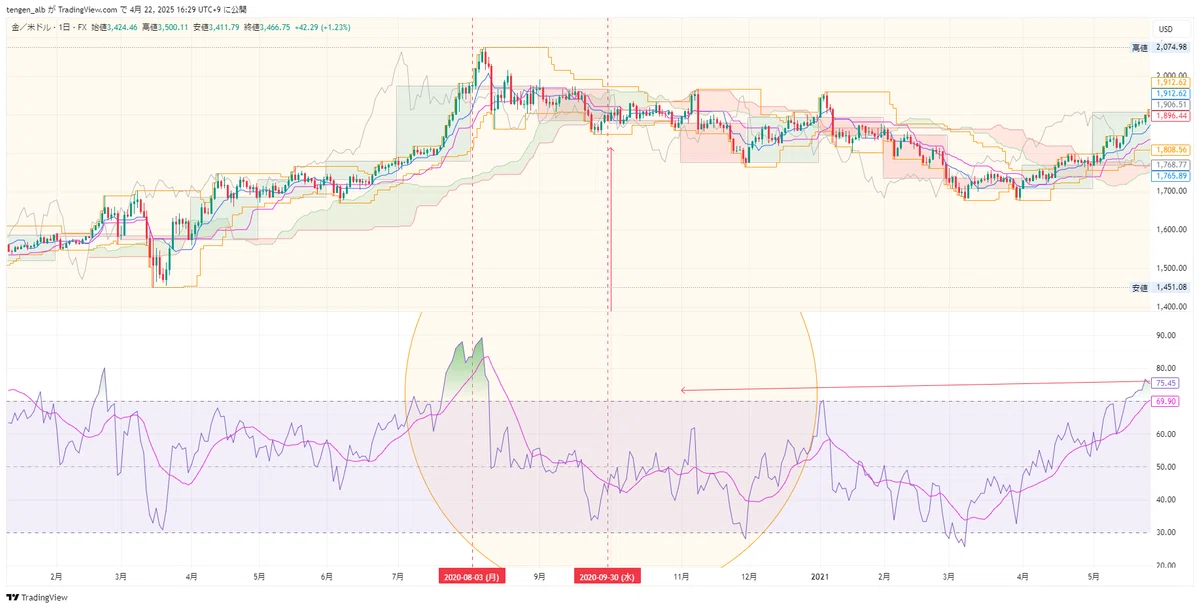
After hitting a high in August, it stalled, and the upside became heavy, so the monthly RSI appears to have entered a dead cross and turned bearish
Correction magnitude and duration after the top
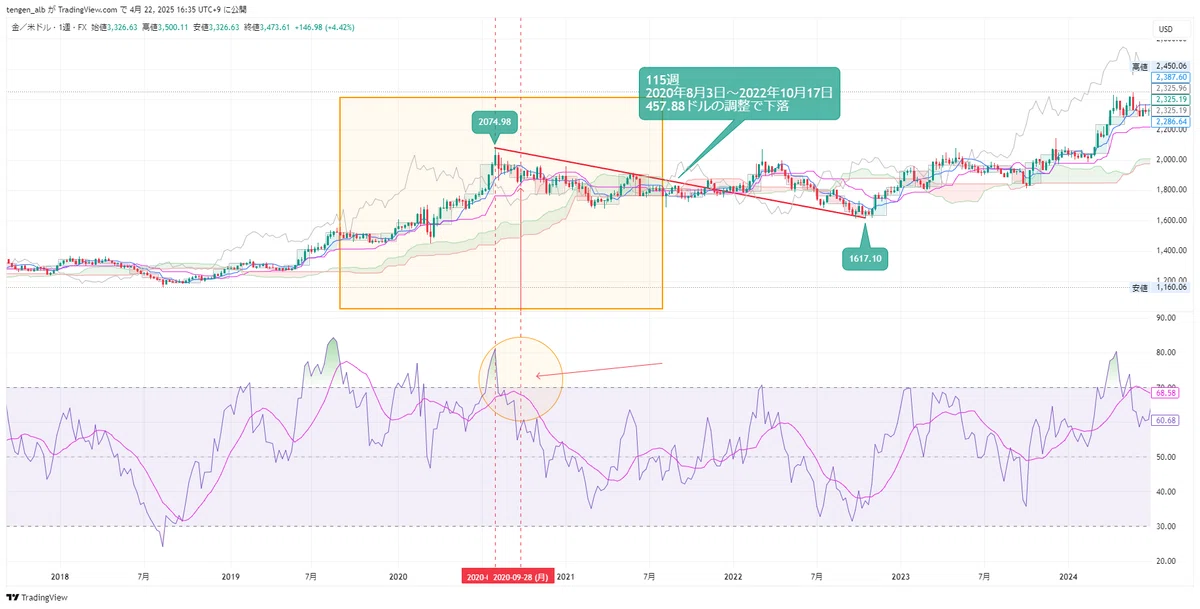
This correction was characterized by a lack of direction and a wandering pattern
Calculate the drop from the highest price to the lowest price after the peak, to determine what percentage it fell from the peak.
① 2011 Correction
740.65 ÷ 1920.80 ⇒ 38.56%
② 2020 Correction
457.88 ÷ 2074.98 ⇒ 22.07%
※ Rounding to the nearest tenth
If you adjust for a correction, the drop from the top-range is between 22% and 38%.
Back to this year’s chart.
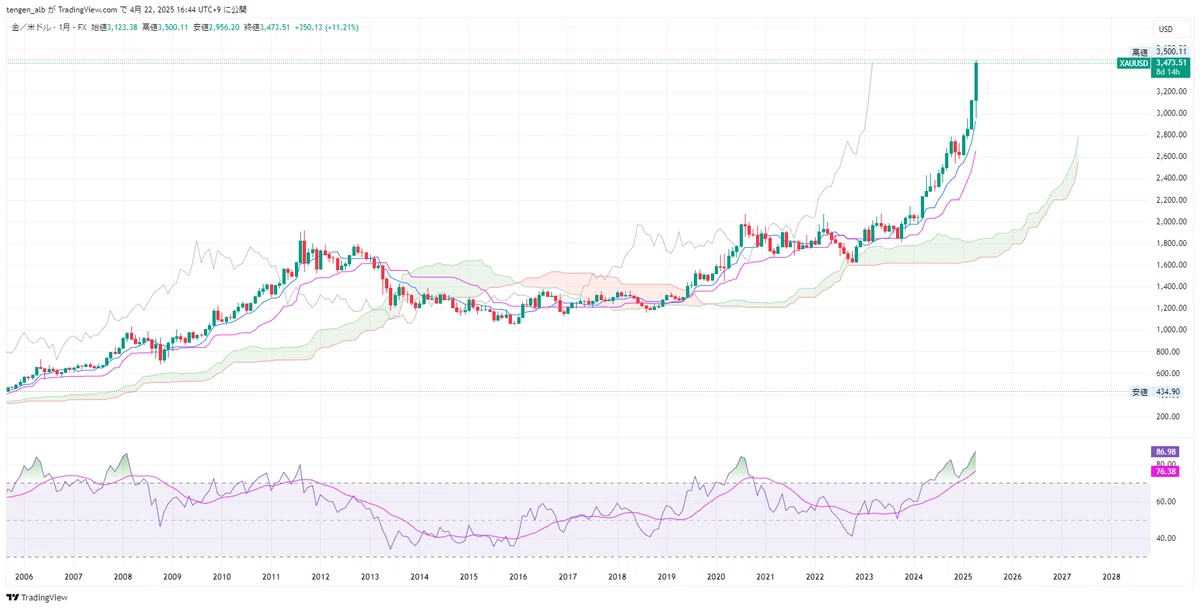
Reached $3,500, RSI reached 87
From here, with daily price weight and slowing momentum, if the monthly RSI crosses below the RSI moving average on the downside
the assumption of a correction would be established
Attention Point ②: Where the Upside Stalls
The expanding monthly pivot R3 reaching its first
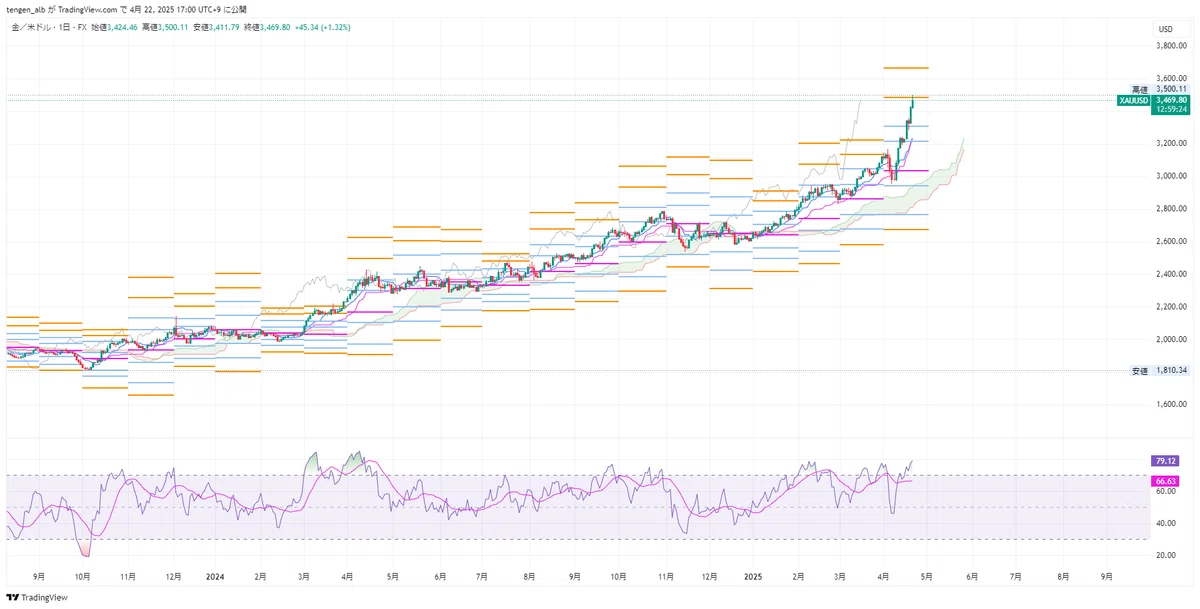
Pivot responds to the width of the previous timeframe, expanding or contracting
This month’s monthly pivot is the largest expansion in history, reaching R3
This marks a turning point indicator for pivots
What is the speculators’ target price?
Goldman raises year-end price forecast to $3,700
Price forecast at year-end 2025: $3,700
It is within the range to reach within this week, but given that markets may stall and then correct before reaching it, it is not impossible.
First, it is essential to recognize that $3,700 is a key level.
◉ Factors Behind GOLD’s Rise
① Uncertainty due to Trump tariffs
② Dollar weakness
③ Central banks buying gold
④ Expectations of rate cuts by the Fed
Fundamentally, investors are selling US assets to buy gold due to “uncertainty about the future.”
This gold buying ramped up due to geopolitical risk.
In shortGold buying in times of crisisYes.
But beyond warfare, in addition to the trade war and the ensuing uncertainty from a recession, gold has become a cash flow that investors flee to.
The development of ① is the US-China trade war; the final scenario envisions a Third World War caused by the US-China trade war, which is not a small number of investors’ concerns currently.
Next, ②, the dollar index – let’s check it.
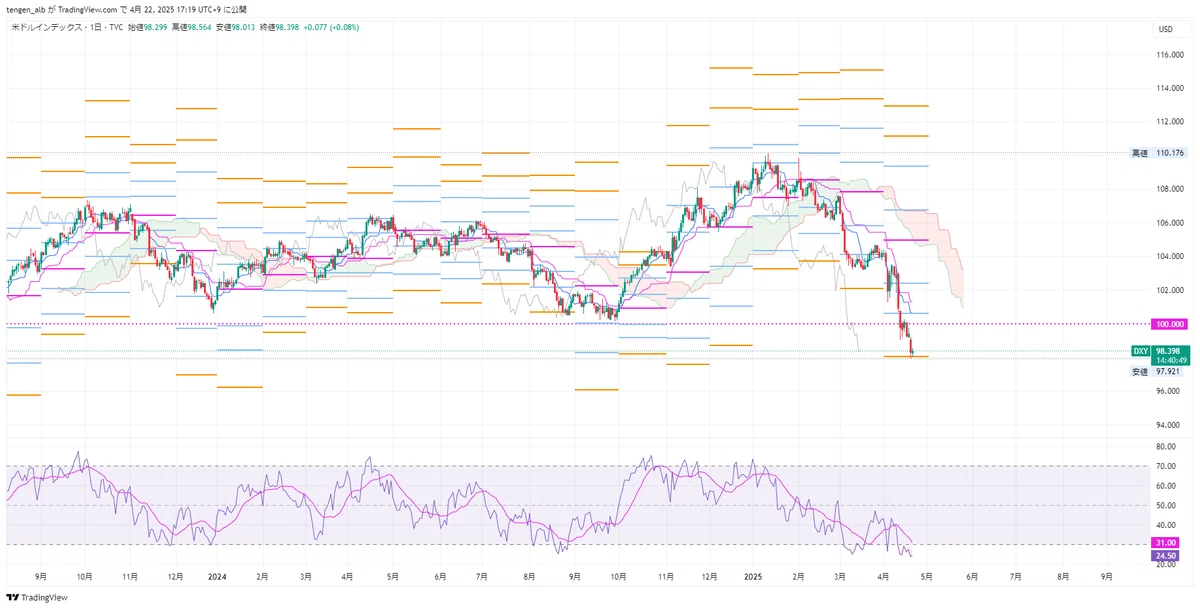
Dollar Index on Daily
Falls below 100 to 97, reaching monthly pivot S3
GOLD’s R3 and dollar index’s S3 reach would be a definitive breakout above or below
③ Central banks holding gold as a precaution
Gold’s strength as part of foreign exchange reserves. Acts as insurance during stock market crashes.
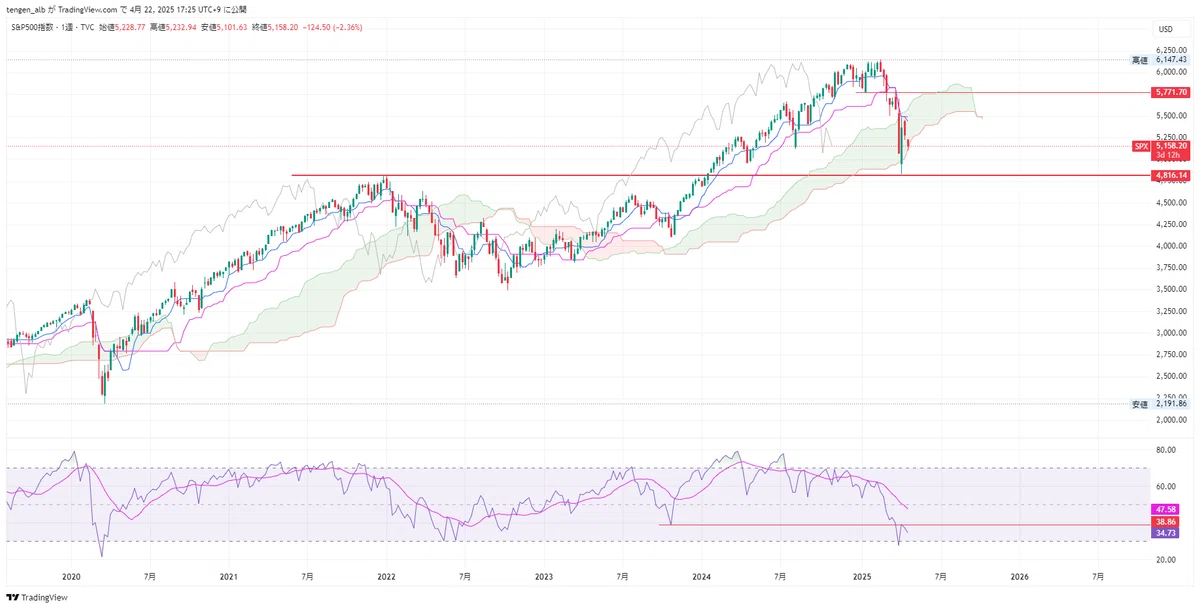
S&P 500 weekly
This too is at a turning point. Is the bear market with rising gold a sign of a crash? It’s a level where a sell-off could be expected.
If U.S. stocks crash, that would be the moment to lock in profits on GOLD long positions.
GOLD’s correction would be the most realistic correction scenario.
〇 About hedge funds (excerpt from April 18 report)
With the U.S. bond market being unsettled and fear of large capital outflows from U.S. assets weighing on the dollar index, gold, as part of the Magnificent Seven, might well have risen. About 50% of the fund managers responding to the survey by BofA cited gold purchases as the area where positions were most concentrated.
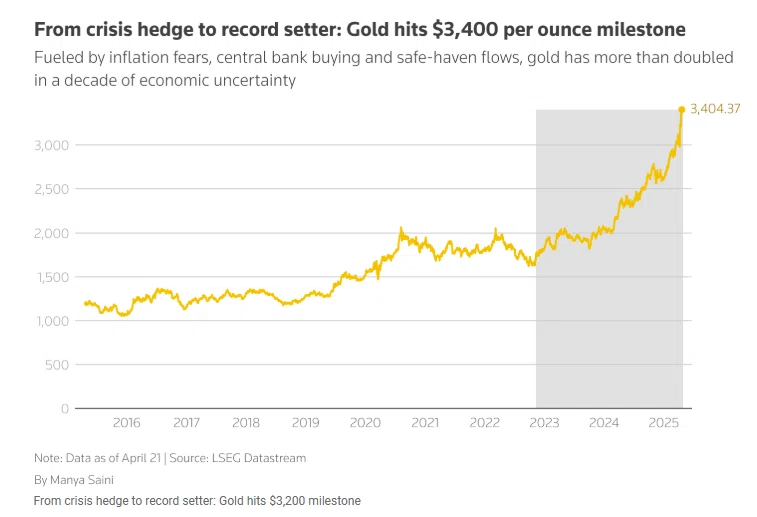
Gold prices have risen about 23% year-to-date, surpassing $3,200 per ounce.
Net 42% of funds worldwide expect gold to be the best-performing asset of the year, exceeding the inflows into U.S. listed ETFs.
There is some logic to this forecast.
Other assets are unlikely to catch up with gold’s ascent since the start of the year.
〇 Who is selling U.S. Treasuries?
For years, U.S. Treasuries have been considered safe assets by foreign exchange reserves and sovereign funds. As they become volatile, investors rush to gold.
Even last week, the 30-year U.S. Treasury yield rose the most in over 40 years. All while U.S. stocks were plunging.That is the situation.
Many hypotheses circulate about what triggered the U.S. Treasuries sell-off,one of which is that China sold U.S. Treasuries. It is believed that much of it was through indirect holders.
While President Trump eases tariff threats for countries other than China, he has raised trade barriers against China, leading to talk of China’s selling.
There is no clear evidence pinpointing what exactly triggered the fall in U.S. Treasuries.
However,China has reduced its U.S. Treasuries holdings over the past two years while significantly increasing gold holdings in foreign exchange reserves.
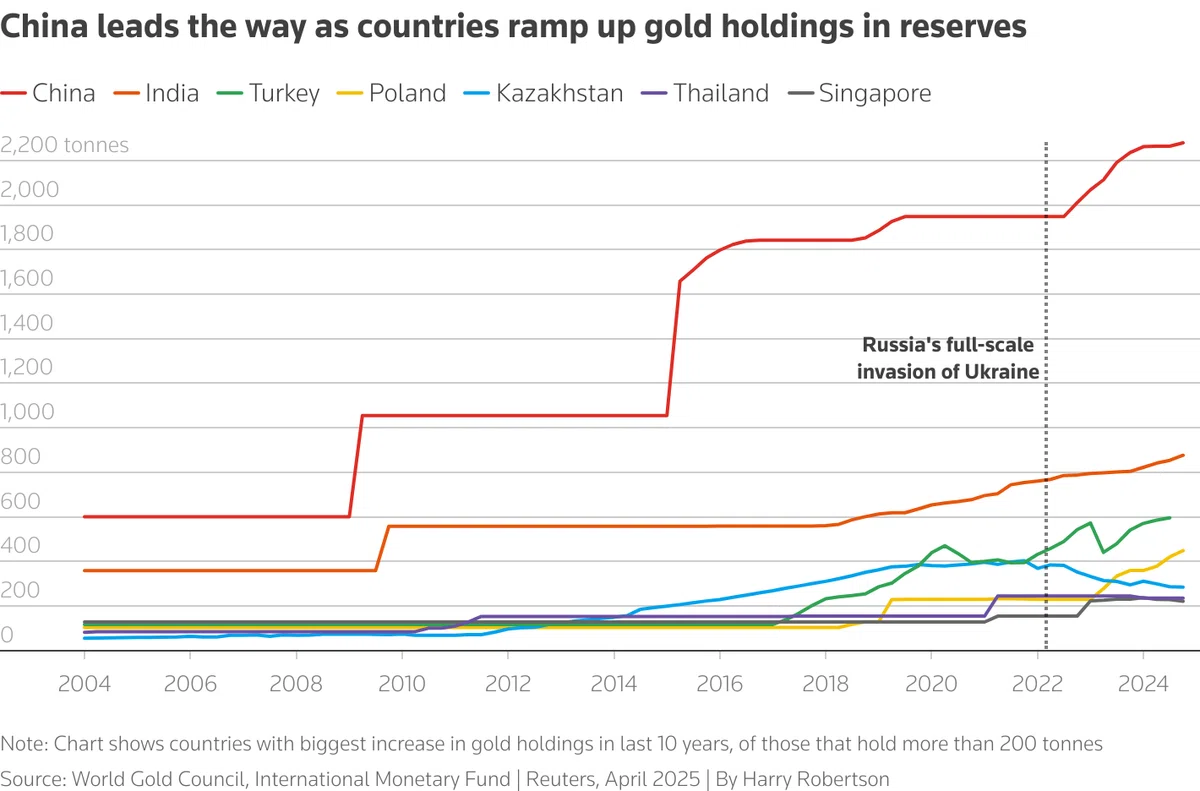
Country-by-country gold holding chart
China’s share of gold in its foreign exchange reserves is now 8%, about three times higher than just before the pandemic.
Société Générale (SG) strategists analyzed this situation and noted that, according to British government export data released on the 11th, China again imported 50 tons of gold from the UK in February.SG estimates that, based on data from the UK’s HM Revenue & Customs, China has imported about 700 tons of gold from the UK over the past two years, a “staggering” amount.
SG points out that much of that gold likely went to central banks.
Data released by the World Gold Council on the 14th shows that gold-backed exchange-traded funds (ETFs) in China have already surpassed the entire first quarter's inflows so far this month.
This amount exceeds the inflows into U.S. listed ETFs.
Why the UK? The Bank of England (Britain’s central bank) is known for secure safekeeping and reliable financial services, and stores gold for many foreign clients.
Why China? The Chinese government has accelerated its reduction of U.S. Treasuries in recent years. Since Russia invaded Ukraine and Western nations froze Russia’s foreign reserves, the pace has quickened. Physical gold is among the few assets less likely to face such sanctions.
Is there a single thread connecting the surge in gold, the U.S.-China trade war, and the current U.S. Treasury turmoil?
SG undoubtedly believes there is merit in examining the relationships among these factors.
SG states“There is a roughly positive correlation between money moving from the U.S. Treasuries to gold and this trend is trackable to some extent. And one cannot ignore that U.S. Treasuries sales align with gold exports to China.”
Thus, focusing on the correlation between U.S. Treasuries and gold, if U.S. Treasuries selling slows, GOLD may stop rising.
When the yen weakens, there are cases of selling yen to buy gold as well.
It is also a fact that gold is being bought as the dollar weakens.
With so many participants globally—investors, traders, and professionals—the element of “uncertainty” is among them all. I cannot predict with certainty, so I will continue to build hypotheses and analyze to identify GOLD’s upward trend and potential correction phases.