

【GOLD Fuka-bori】What to check after a large price movement, and how to respond; what are the key points of strategy?
Hello, Trader Tengen here.
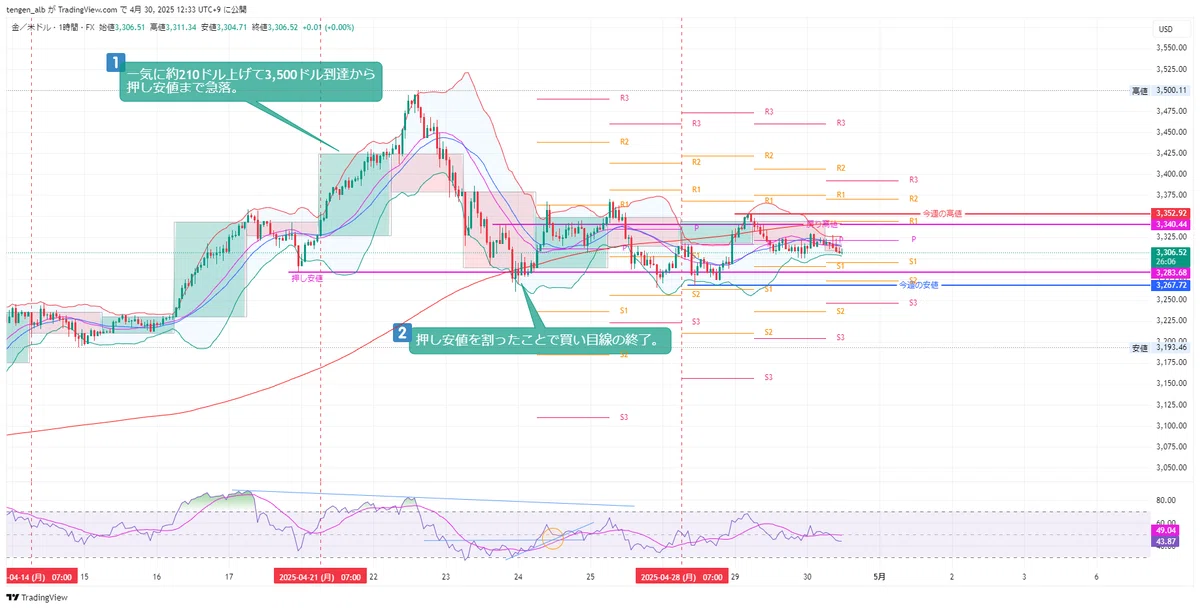
Gold has reached the important level of $3,500.
However, it seems to have stalled after that rise, soI will quickly check the situation.
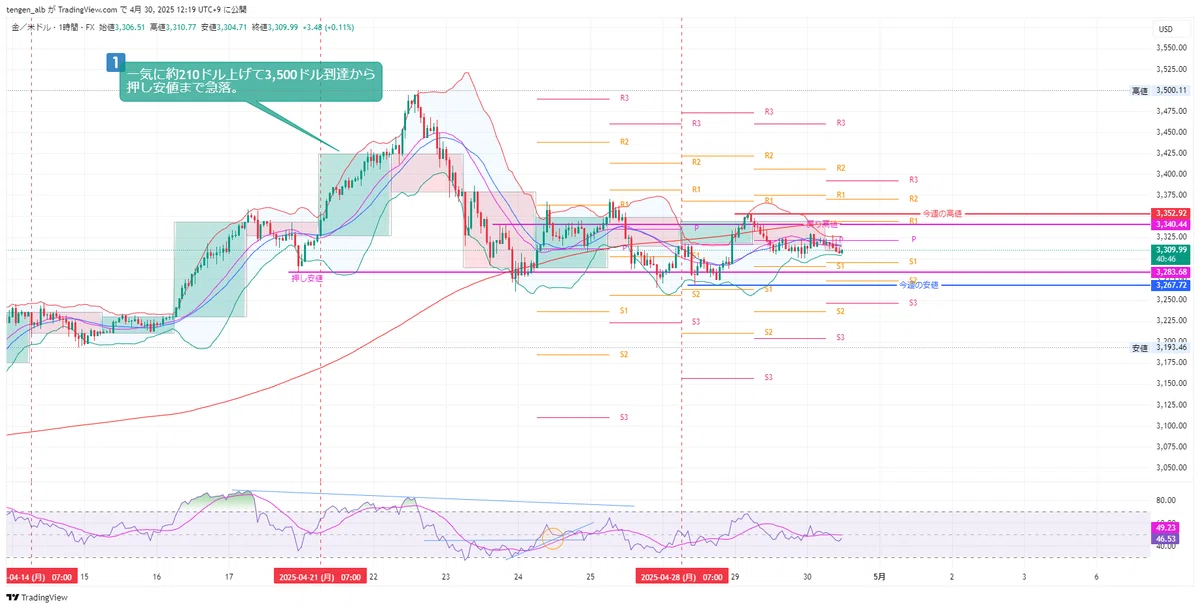
※ The daily chart is overlaid on the 1-hour chart.From 4/16 to 22, there was a sharp rally
On Wednesday the 16th, it broke out from consolidation to the upside.
Thursday showed a stall in the rally, but the decline was limited and it could not reach the押し安値 (the support level).
Friday was a holiday, and from Monday of the following week the rally resumed, reaching $3,500 on Tuesday the 22nd.
※ It is not a clear breakdown, but it is a fact that the low was updated
However, having reached the $3,500 milestone triggered profit-taking, and on the daily chart a long upper shadow and a bearish reversal formed.
The pullback on Thursday and the pullback on the 22nd clearly show different upper wicks.
The next day the 23rd, buying was weak and selling dominated, forming a large bearish candle and breaking below the previous low.
On the 24th and 25th, Thursday and Friday, attempts to rise failed and declined.
This shows weak buying and a heavy tendency to move toward the downside.
◉ Price movement is sideways and entering a squeeze
It is in a standby state, accumulating energy until a directional clue appears.
Rather than a bold breakout, it seems better to adopt a standby posture.
① Bollinger Band squeeze
② Pivot compression
③ Lower highs and higher lows
On a short time frame, there is a risk of misreading the trend and judging the market as directionless.
While I said energy is being accumulated, in essence both long and short positions are beginning to get trapped.
Which side holds out longer will reveal the direction, and which side gets forced out may drive movement.
〇 The impact varies depending on how long it stays inside the inside bar
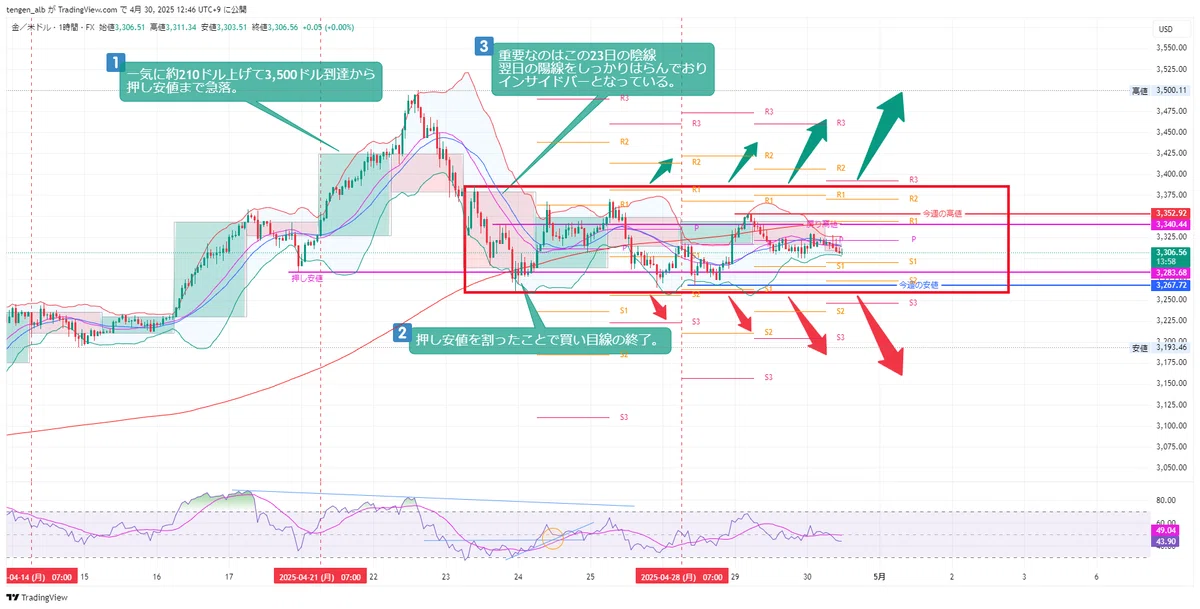
※ The fifth day after the large bearish candle that broke the押し安値 (support) on the 23rd
From the lowest point formed after breaking the support, if you count the 1-hour candles up to April 30 at 12:00, there are actually 104 candlesticks that fall within the high-low range of the 23rd daily candle.
With the 10-day low updated, major players are expected to start unwinding long positions in earnest for a while.