Introduction to the key points of technical analysis for discretionary trading and useful free indicators
Important Technical Analysis in Discretionary Trading
Some traders are quite confused by this.
For beginners, first of all,learn chart patternsthoroughly.
Among them, it’s efficient to memorize formations whose price movement after pattern completion can be predicted.
In particularflagsandpennantsarecompleted with a breakoutwhich makes entry points easy to identify, so they are recommended.
The rest depend on the observertechnical indicatorswhich, however, is not meaningful to combine a large number of indicators for beginners.
Technical indicators include two representative types: oscillators that reveal numerical overbought/oversold conditions, and trend-following indicators that show the direction and strength of the trend.
(For details,here)
Oscillators tend to produce signals of being overbought or oversold too early in trending markets, which makes them weak in trending conditions, but they excel in range-bound markets.
Trend-following indicators are prone to false crossover signals in range markets, but perform strongly in trending markets.
By combining indicators with different characteristics, you can check the direction of the trend with trend-following indicators and time entries and exits with oscillator indicators,
and so on.
The site administrator’s favorite is the combination of RSI and SMA (simple moving average).
In particular, RSI is a highly useful technical indicator and excels as a gauge of trend and timing.
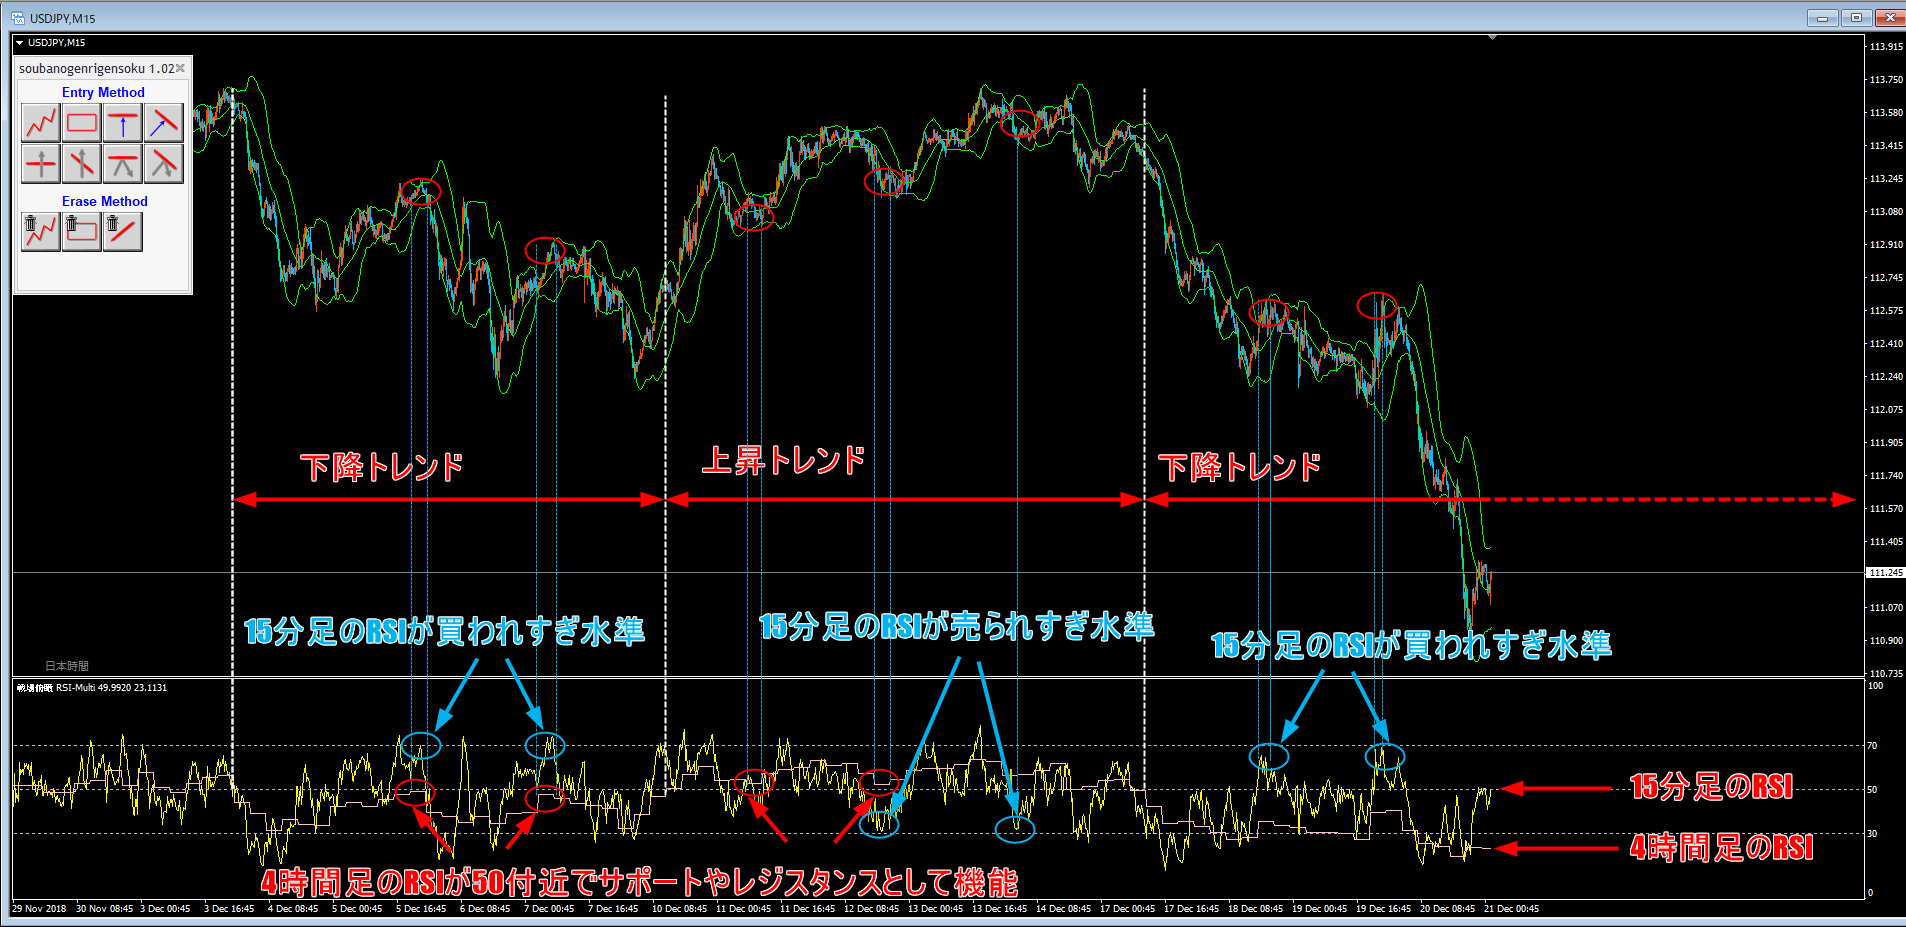
Using RSI to Grasp the Trend
RSIwhen it moves between 50 and 70 indicates an uptrend,when it moves between 30 and 50 indicates a downtrend.
As price approaches 50 during an uptrend, it can act as support; as it approaches 50 during a downtrend, it can act as resistance, making it useful for timing pullbacks and recoveries.
It can also be used to time entries and exits.
To further improve the accuracy of trend identification, using RSI across multiple timeframes—such as 4-hour RSI with 15-minute RSI, or 1-hour RSI with 5-minute RSI—will also improve environment recognition.
We distribute a free indicator that monitors RSI across multiple timeframes. Details arehere
The Strongest RSI Signal
RSI offers highly useful signals, among which the most reliable is divergence.
Divergence means a gap between price and RSI; if price is rising while RSI is falling, or price is falling while RSI is rising, it can signal a potential market reversal, so caution is warranted.
We distribute a free indicator that detects RSI divergence. Details arehere
A slightly more advanced technical analysis
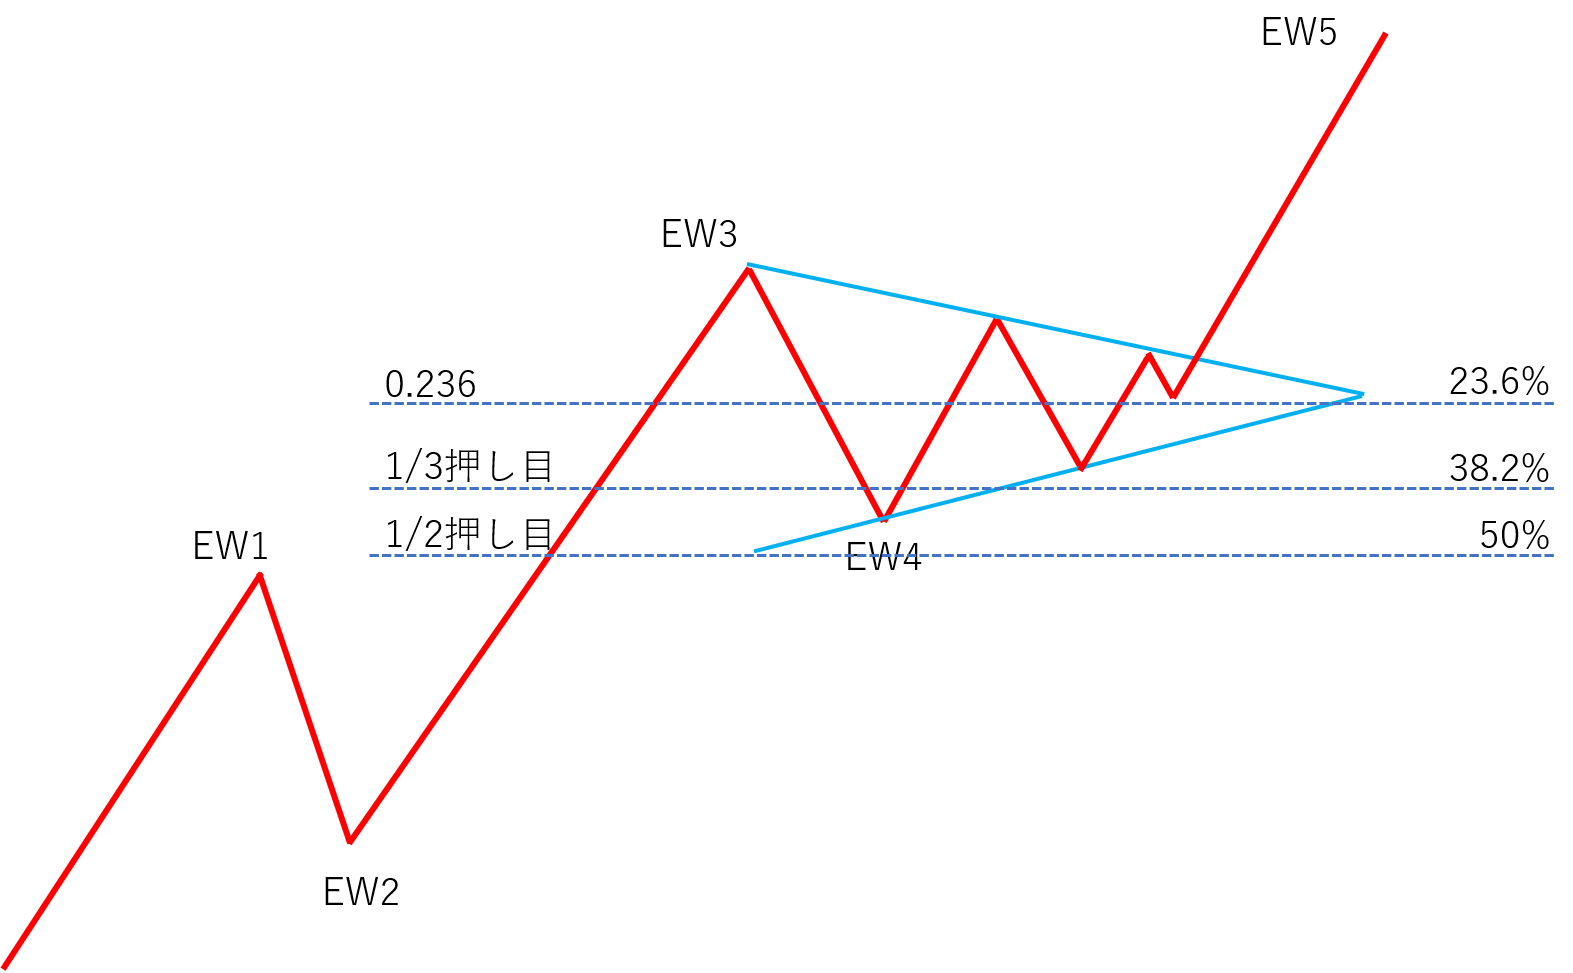
There is also a technique that uses Elliott Wave and Fibonacci retracement.
● Elliott Wave refers to the theory of wave cycles.
Details are published on our site, so please check there.
(Details of Elliott Wave arehere)
● Fibonacci retracement is a quantitative measure of pullback levels.
Details are also published on our site, please check there.
(Details of Fibonacci retracement arehere)
There is an old market saying, “Buy on the first pullback,” and Elliott Wave theory provides a theoretical basis for this.
However, many ordinary traders, upon hearing about Elliott Wave or Fibonacci retracement, simply click the × in the top-right corner and leave (laugh).
Indeed, it can feel intimidating.
Yet, grasping this can sometimes allow you to picture most of the day’s price action.
<Elliott Wave Example>
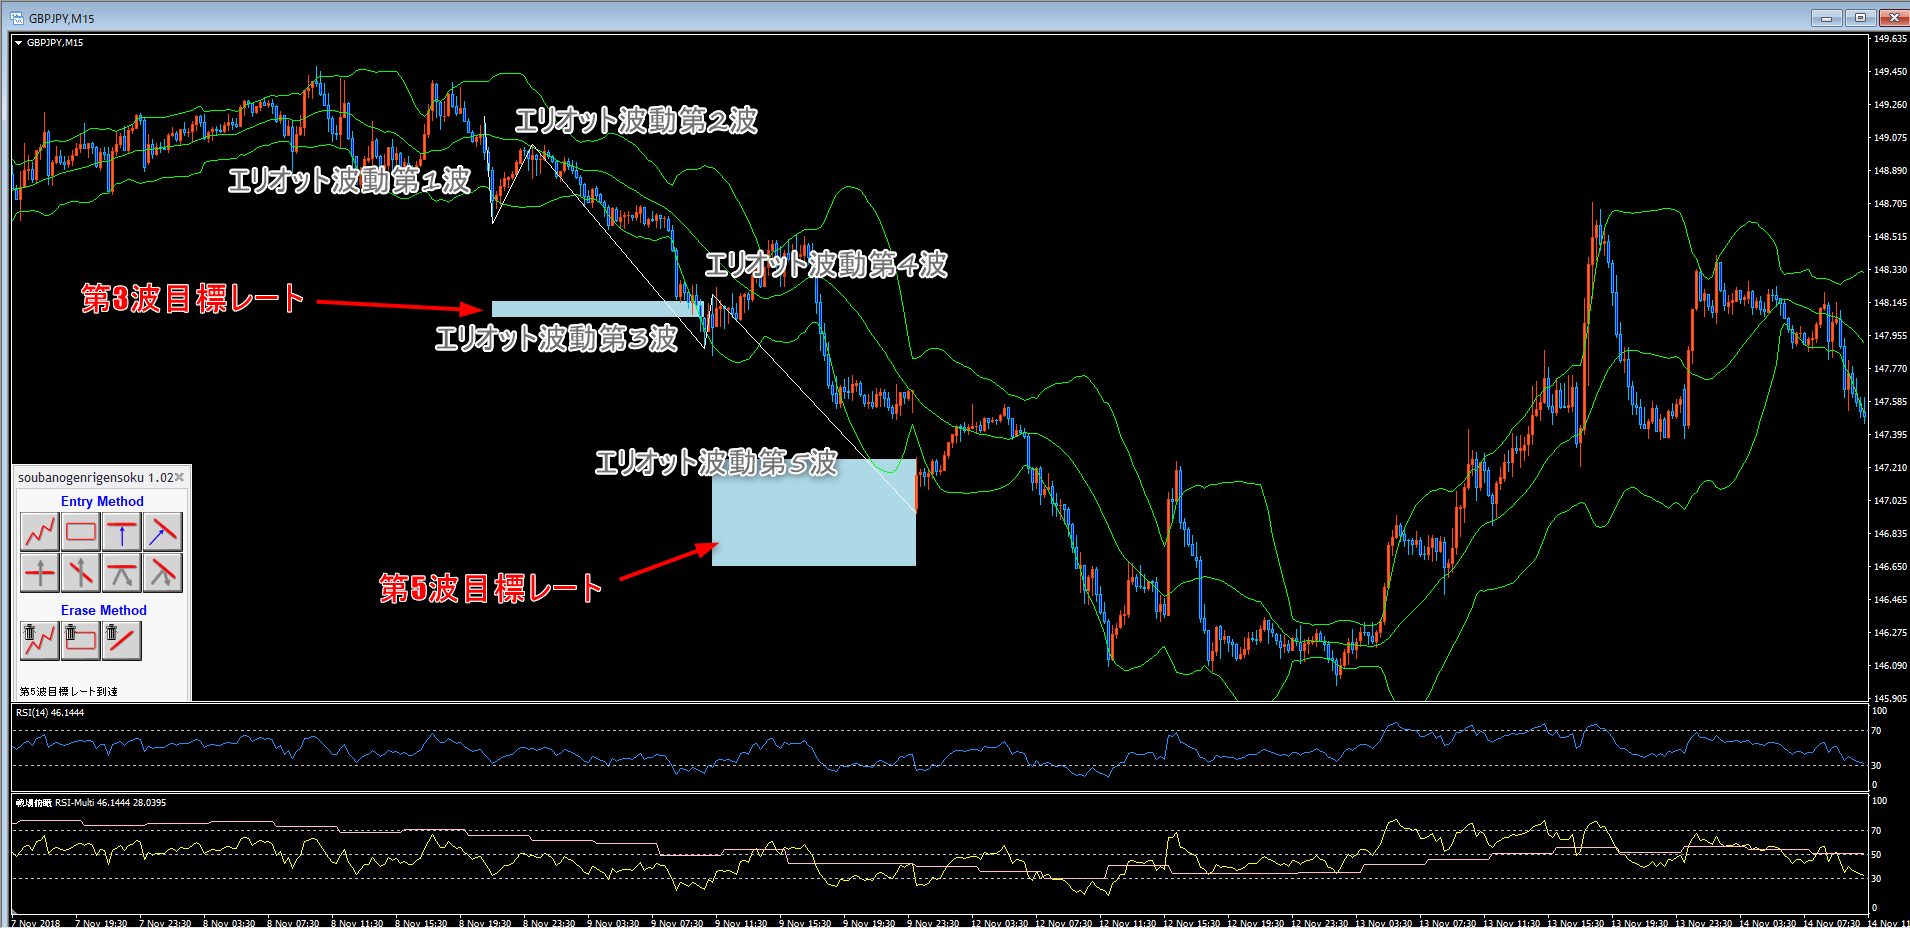
The indicator that outputs the target rates for Wave 3 and Wave 5 shown in the image above isherefor sale.
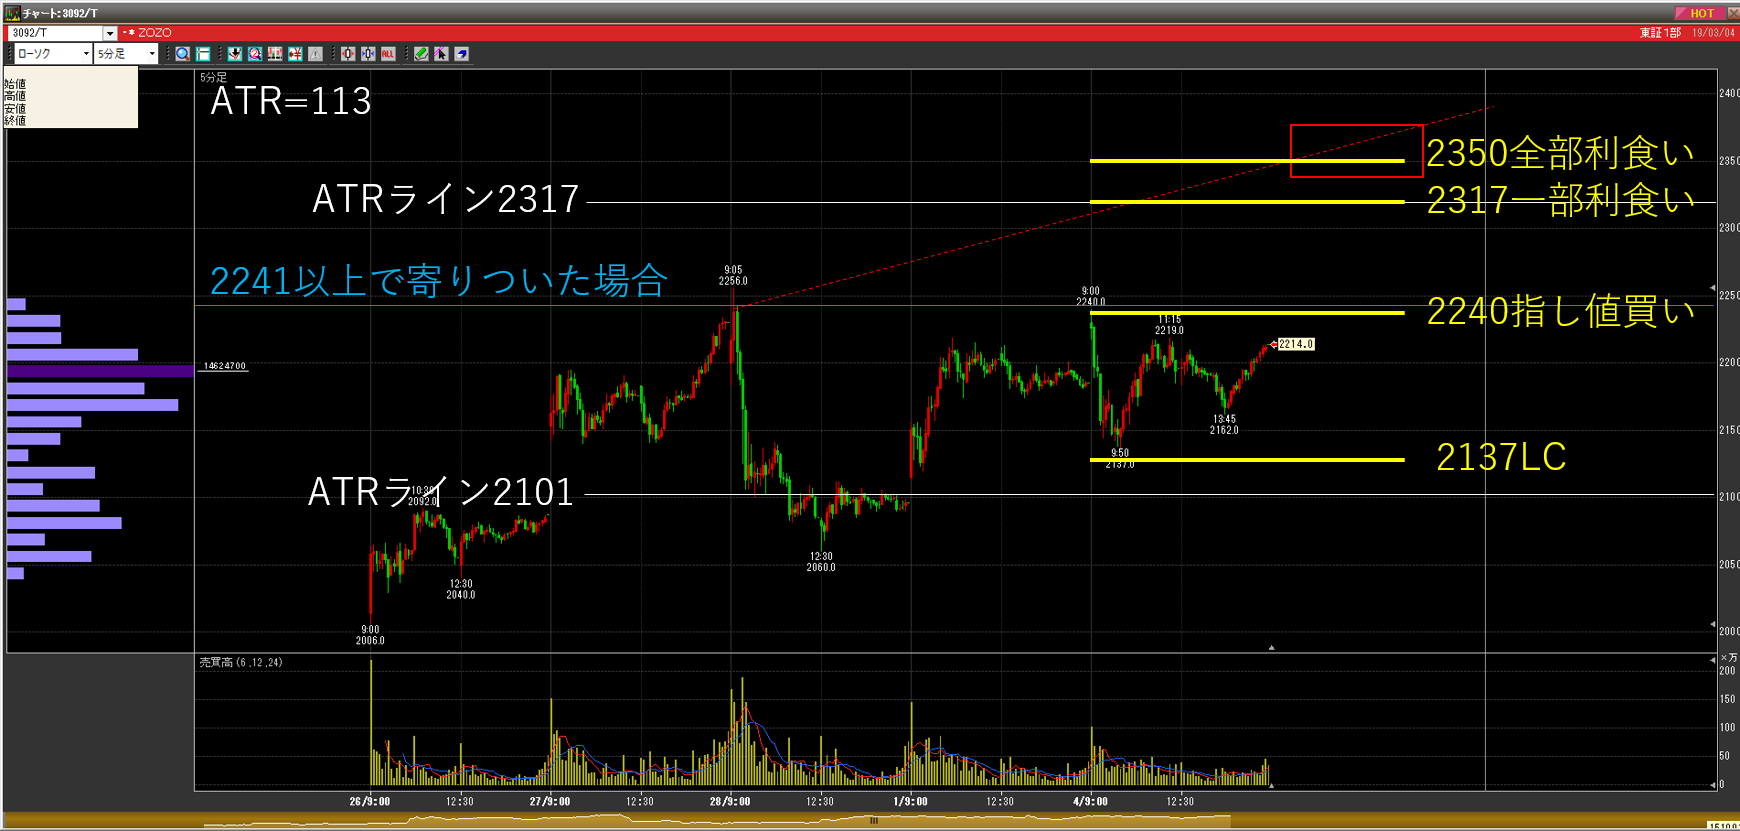
Alsotoday’s article features a discretionary/automatic trading hybrid: trading using flags, pennants, and Elliott Wave
EAisconditionalbutdistributed for freeavailable.
Details arehere
This indicator and EA are developed with the sole aim of winning in discretionary trading.
Let’s grow our capital using strategies that suit the times we are in.