Capture only the winning setup and enter! (April 21)
0
Today (4/21) the
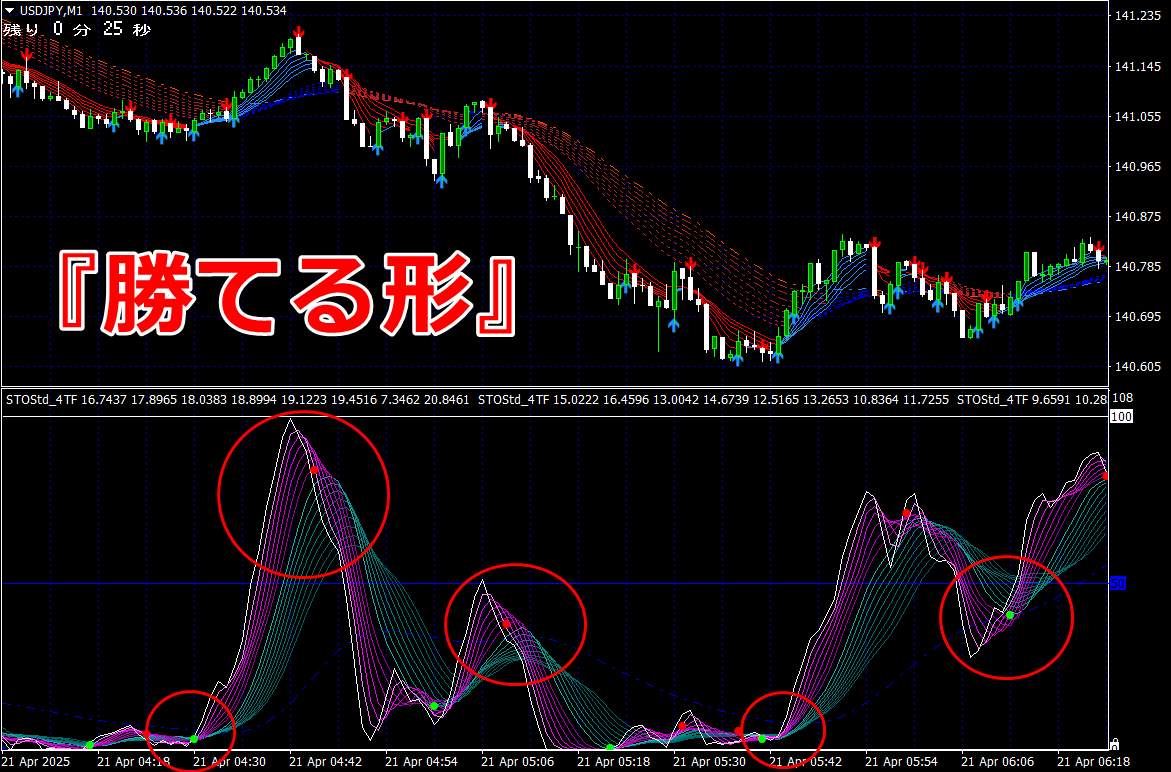
【Winning Shape】Only capture and enter!
(USDJPY 1-minute chart)
【Winning Shape】Only capture and enter!
(USDJPY 1-minute chart)
★After the signal lights up, the pink zone rises over the green zone,
or, a shape that covers overthe areaandguarantees a win entry!
★After the signal lights up, the pink zone rises over the green zone,
or, a shape that covers overthe areaandguarantees a win entry!
(Click image to enlarge)
What is the 【Winning Shape】?
An indicator that lets you visually learn the entry point
Specialized for short-term trading in binary options and FXWe publish a rock-solid entry method with the “1-minute chart indicator.”
<Entry steps are①②simple!>
In an upward trend,

①Prepare for entry when the arrow signal lights up.
②When the arrow signal is lit,if the pink band of the indicator rises under the green bandfrom belowin a scooping shape,then near the moment the current candle closes (or a few seconds before close) choose a 1-minute or 3-minute high entry.
※Signal on does not equal entry, so if the indicator doesn’t scoop up the green band, do not enter (signals occur only a few times). (Frequency of entry from signal lighting is about once in several times.)
※On a 1-minute chart, there are several tens to about 100 entry opportunities per day
“Only enter by capturing the Winning Shape!”
< Shape scooping the green band=What is Winning Shape? >
Points where similar entries are possible exist, as shown in the indicator shape in the image below.
What is the 【Winning Shape】?
An indicator that lets you visually learn the entry point
Specialized for short-term trading in binary options and FX
We publish a rock-solid entry method with the “1-minute chart indicator.”
<Entry steps are①②simple!>
In an upward trend,
①Prepare for entry when the arrow signal lights up.
②When the arrow signal is lit,if the pink band of the indicator rises under the green bandfrom belowin a scooping shape,then near the moment the current candle closes (or a few seconds before close) choose a 1-minute or 3-minute high entry.
※Signal on does not equal entry, so if the indicator doesn’t scoop up the green band, do not enter (signals occur only a few times). (Frequency of entry from signal lighting is about once in several times.)
※On a 1-minute chart, there are several tens to about 100 entry opportunities per day
“Only enter by capturing the Winning Shape!”
< Shape scooping the green band=What is Winning Shape? >
Points where similar entries are possible exist, as shown in the indicator shape in the image below.
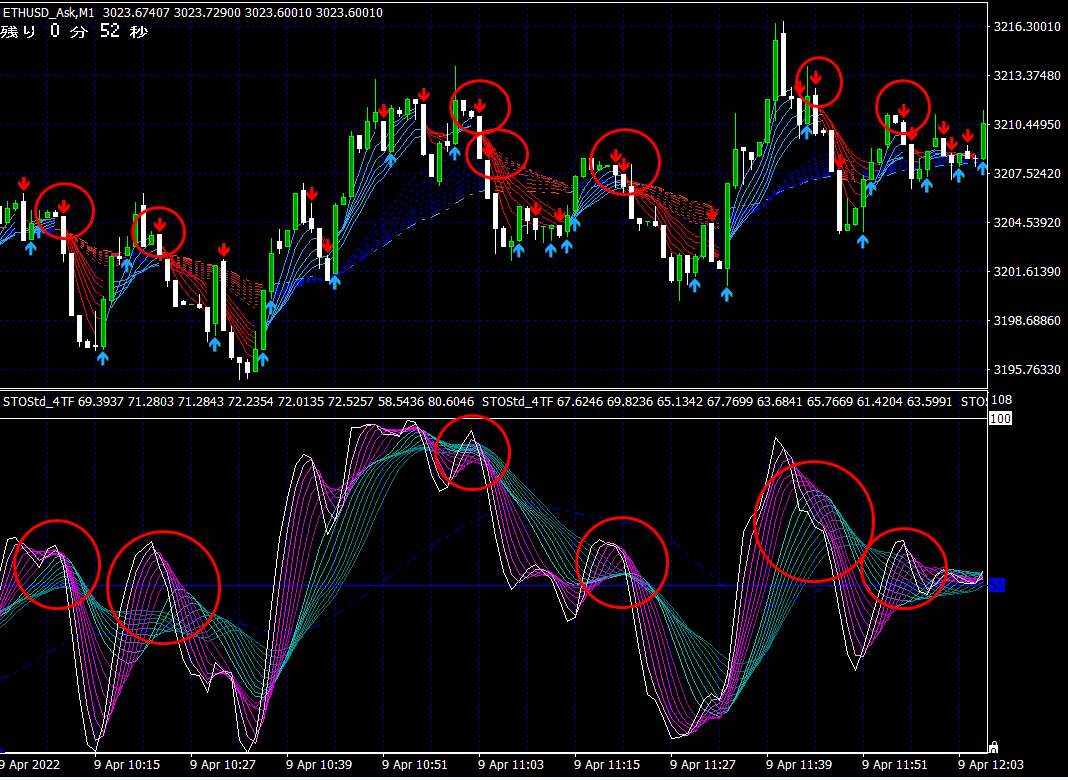
In a downtrend,
①Prepare for entry when the arrow signal lights up.
②When the arrow signal is lit,if the pink band rises over the green bandfrom aboveoverlapping,then the current candle closes a few seconds later or immediately after closes,enter a low-entry on 1-minute or 3-minute timeframe.
※Signal on does not equal entry, so if the indicator does not overlap the green band, do not enter (entry frequency is about once in several times).
※On a 1-minute chart, there are several tens to about 100 entry opportunities per day
“Only enter by capturing the Winning Shape!”
< Shape overlapping the green band=What is Winning Shape?>
Similar entry points are possible with indicator shapes like the ones in the image below.
For details of the indicator and purchase, click here!
1-minute chart indicator Three-layer, three-color waveform indicator


× ![]()