

[April 14, 2025] Verification of the De-swinging Method for the World Indicators (EUR/JPY)
This time, I would like to introduce entry points for EURJPY.DSATEA (Day Swing dedicated auto-trading EA) is also explained in detail regarding parameter settings and tips.
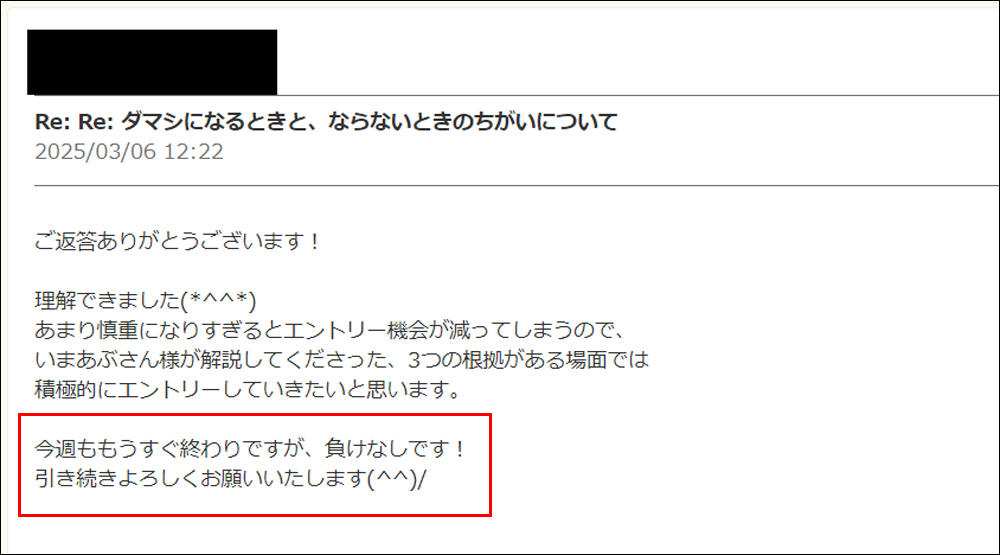
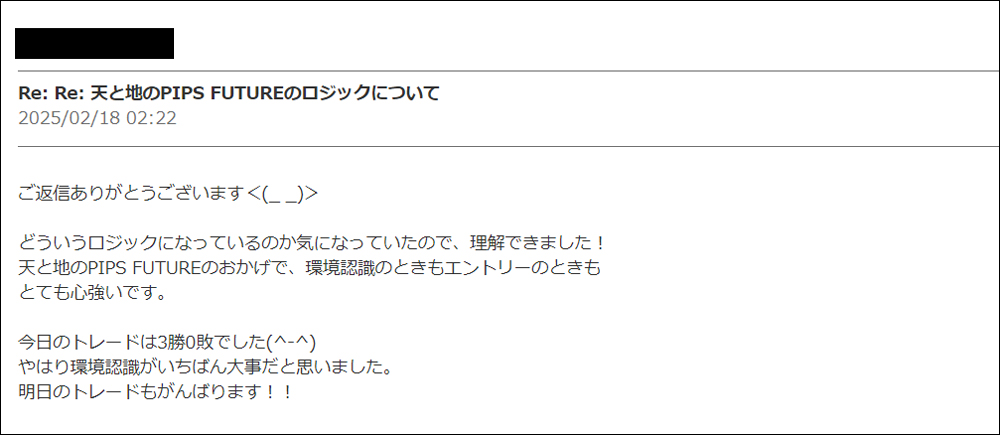
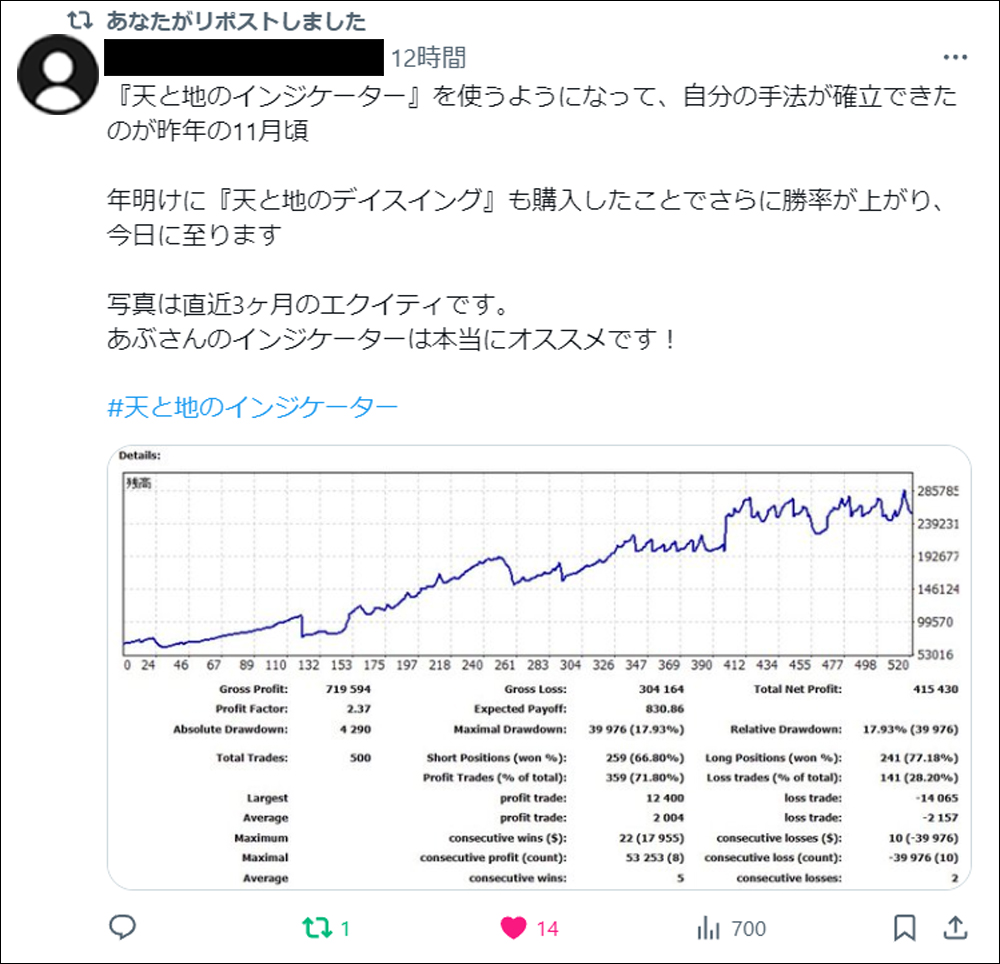
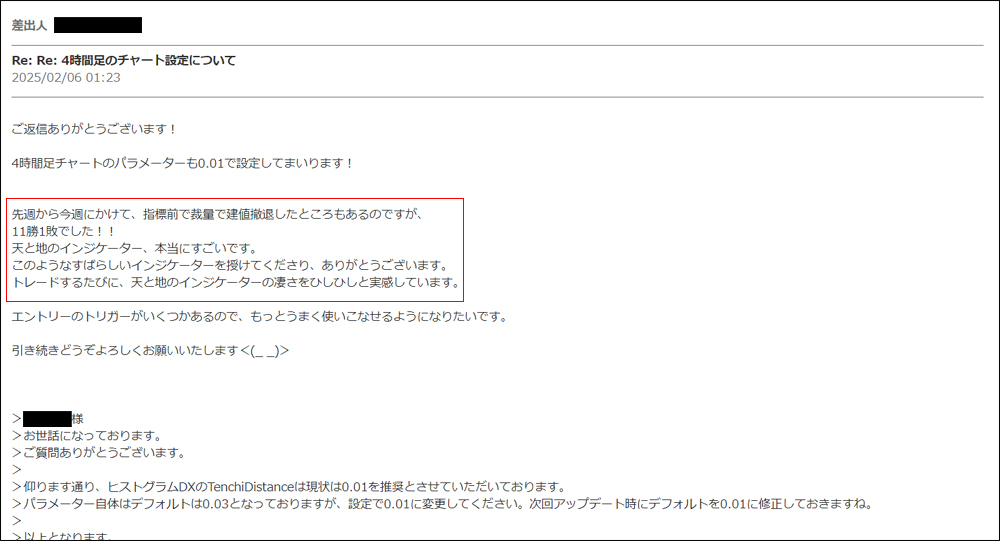
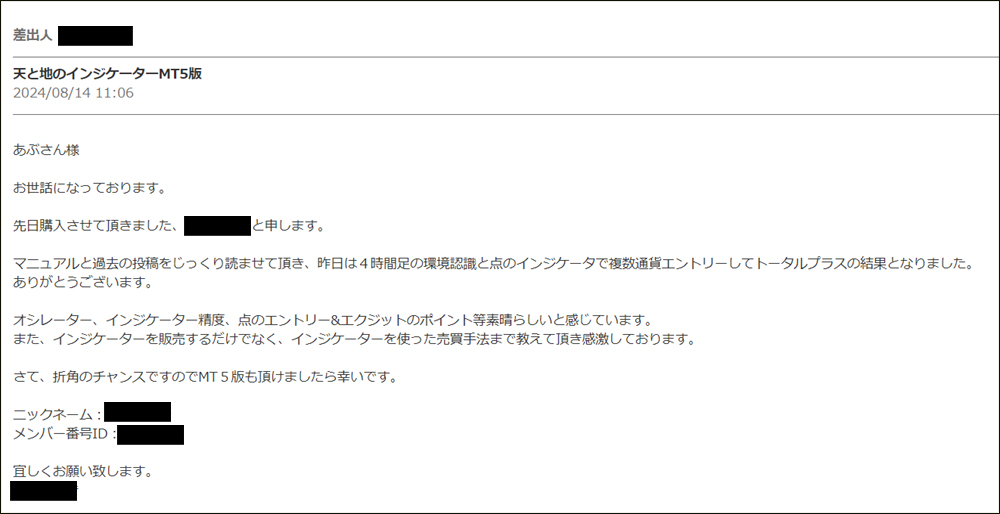
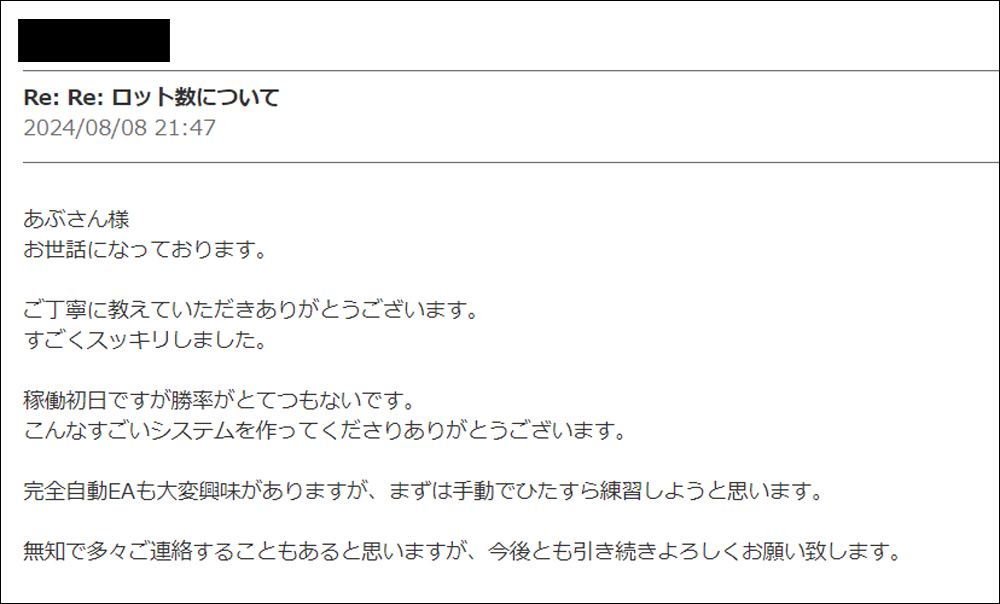
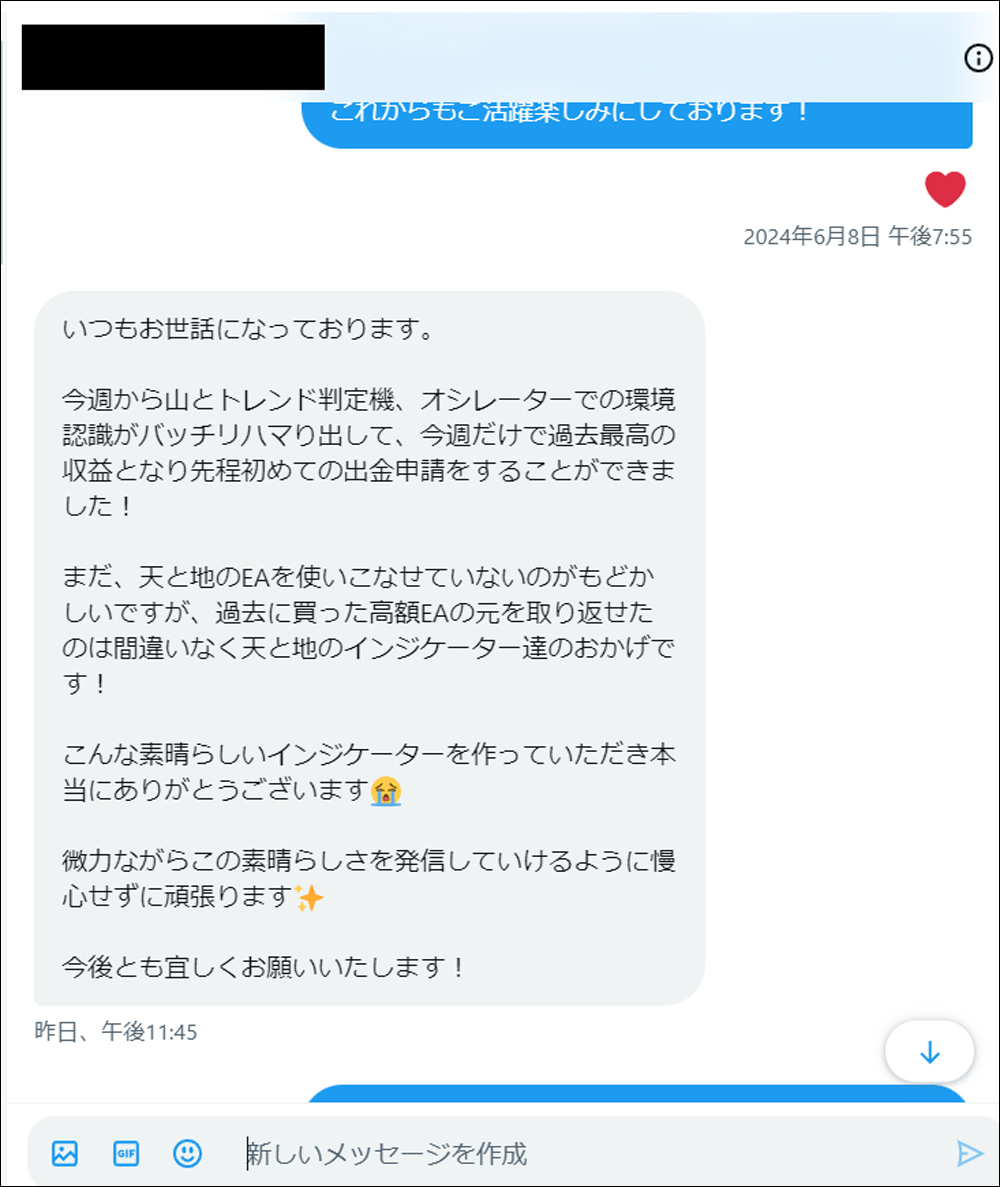
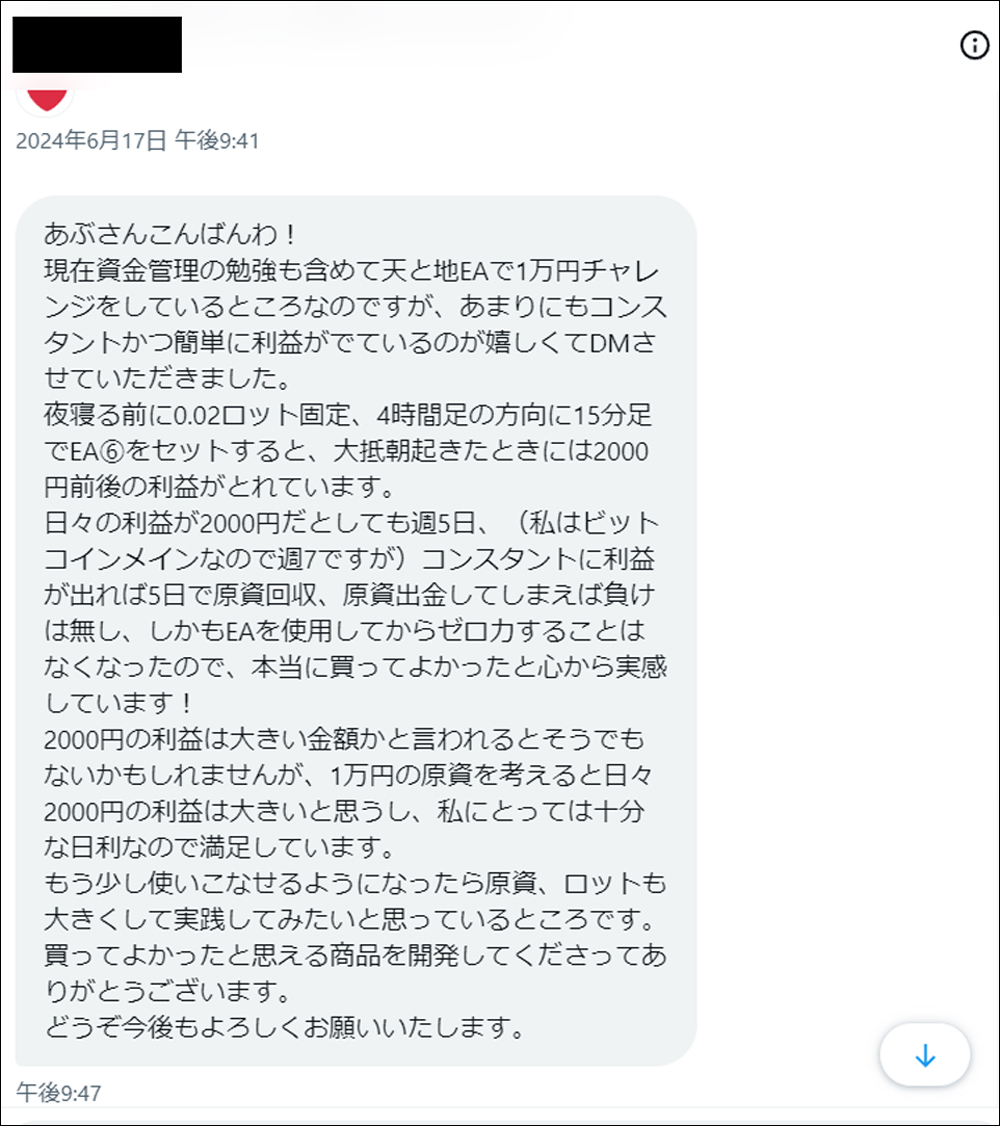
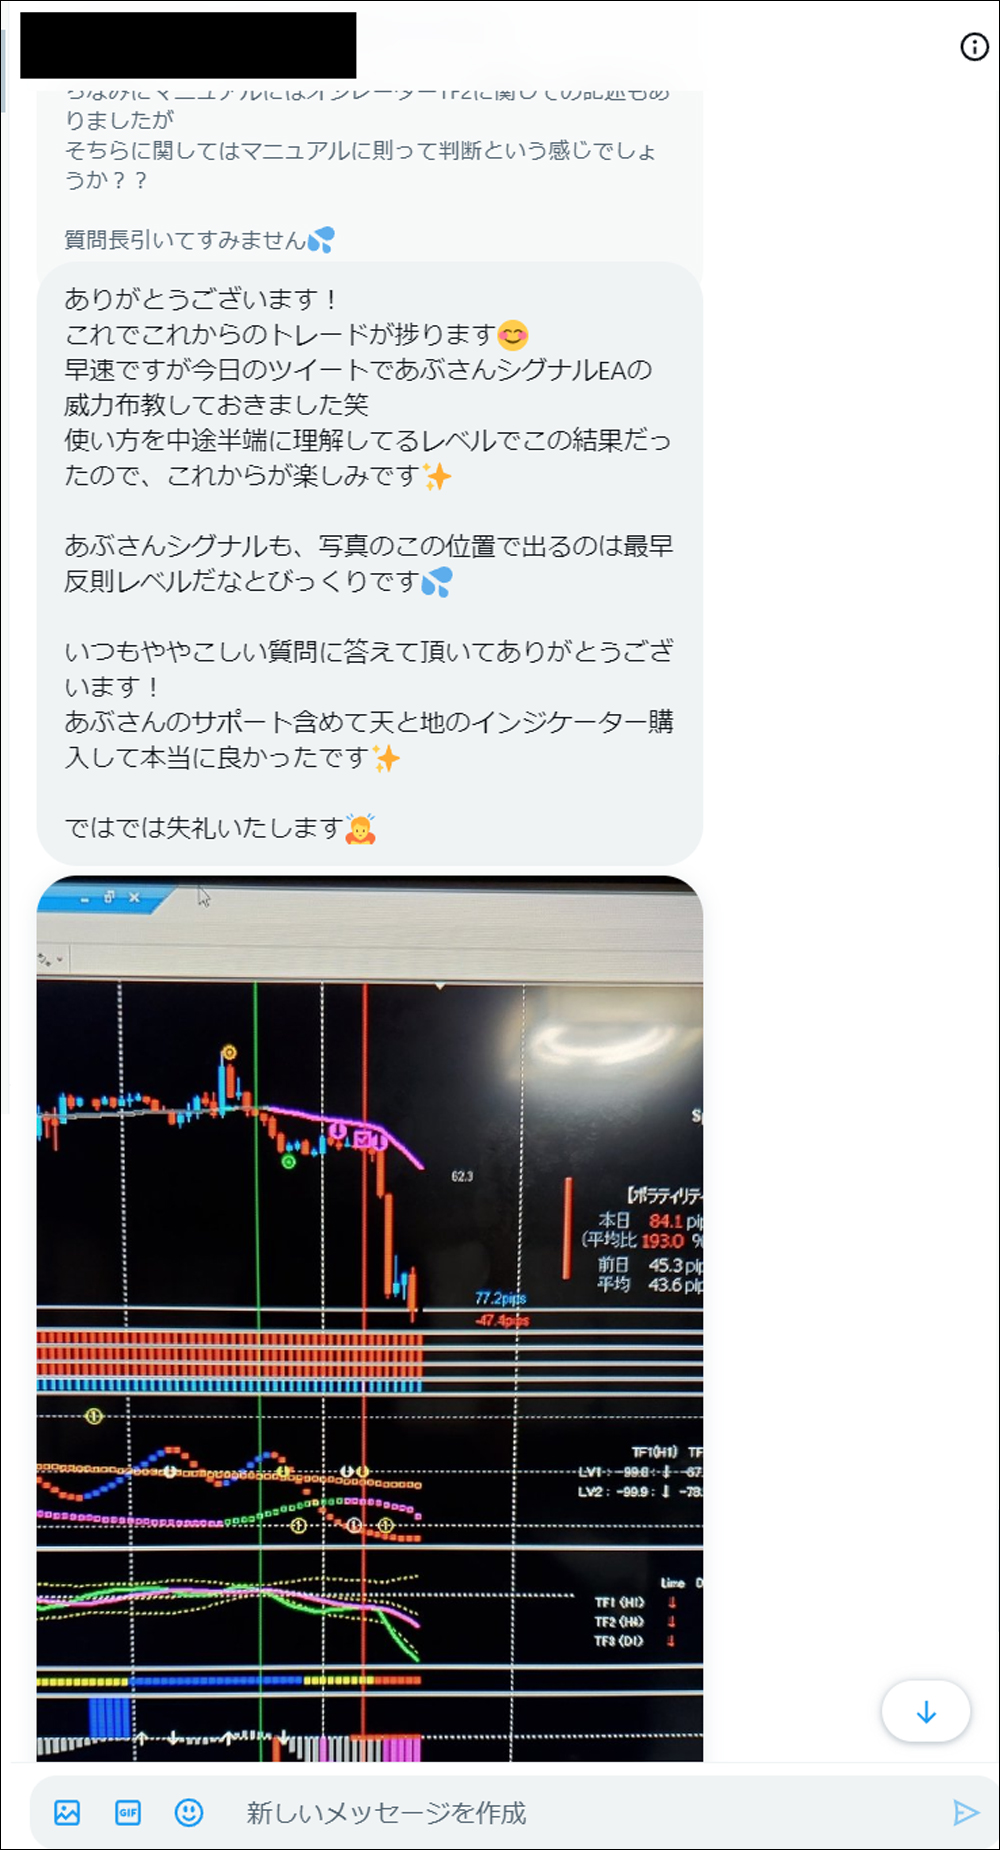
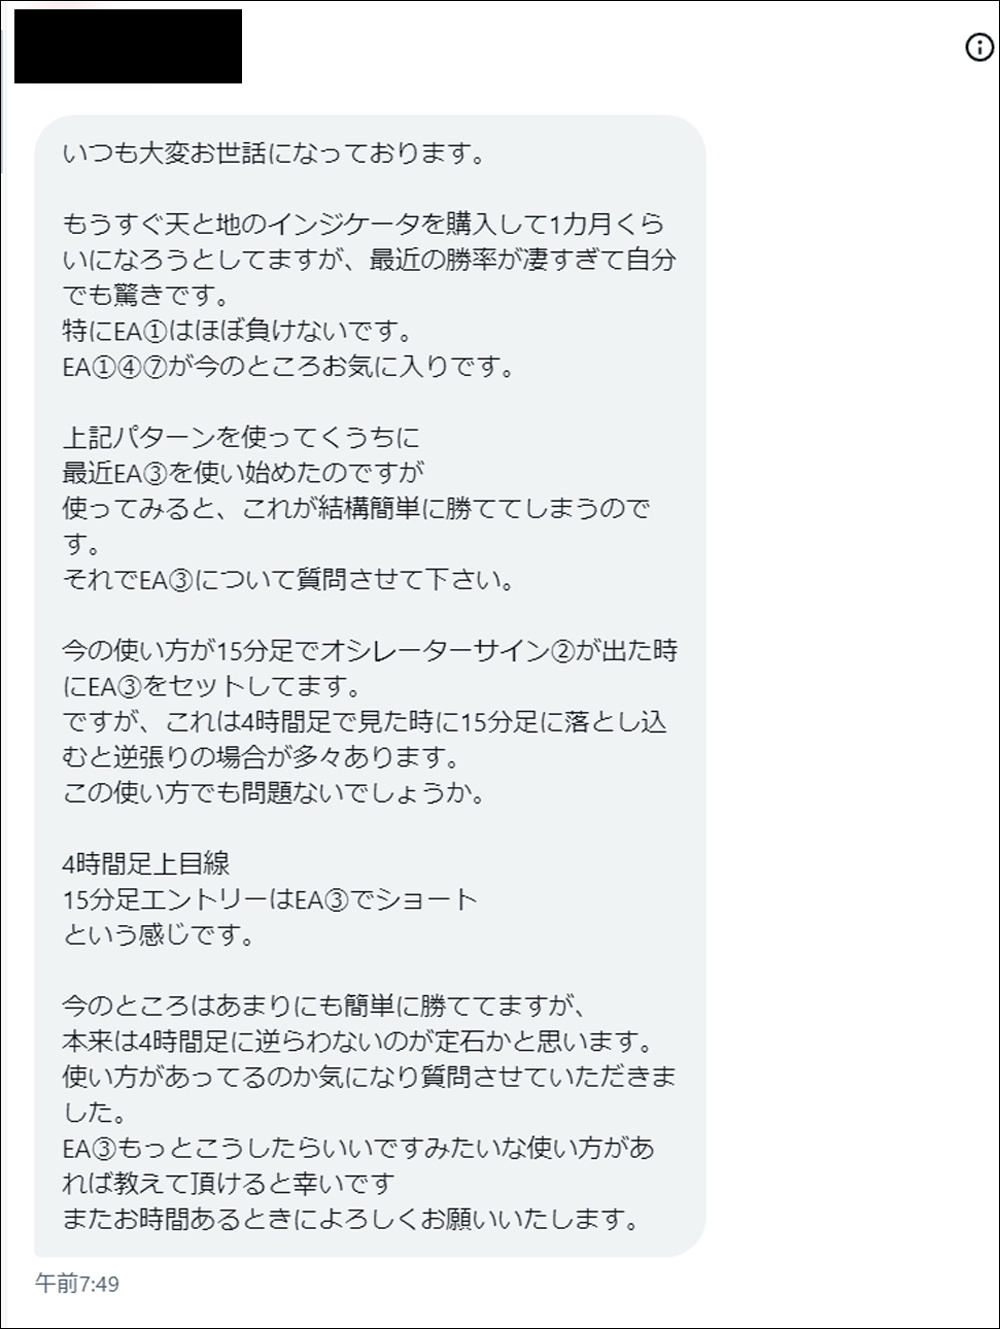
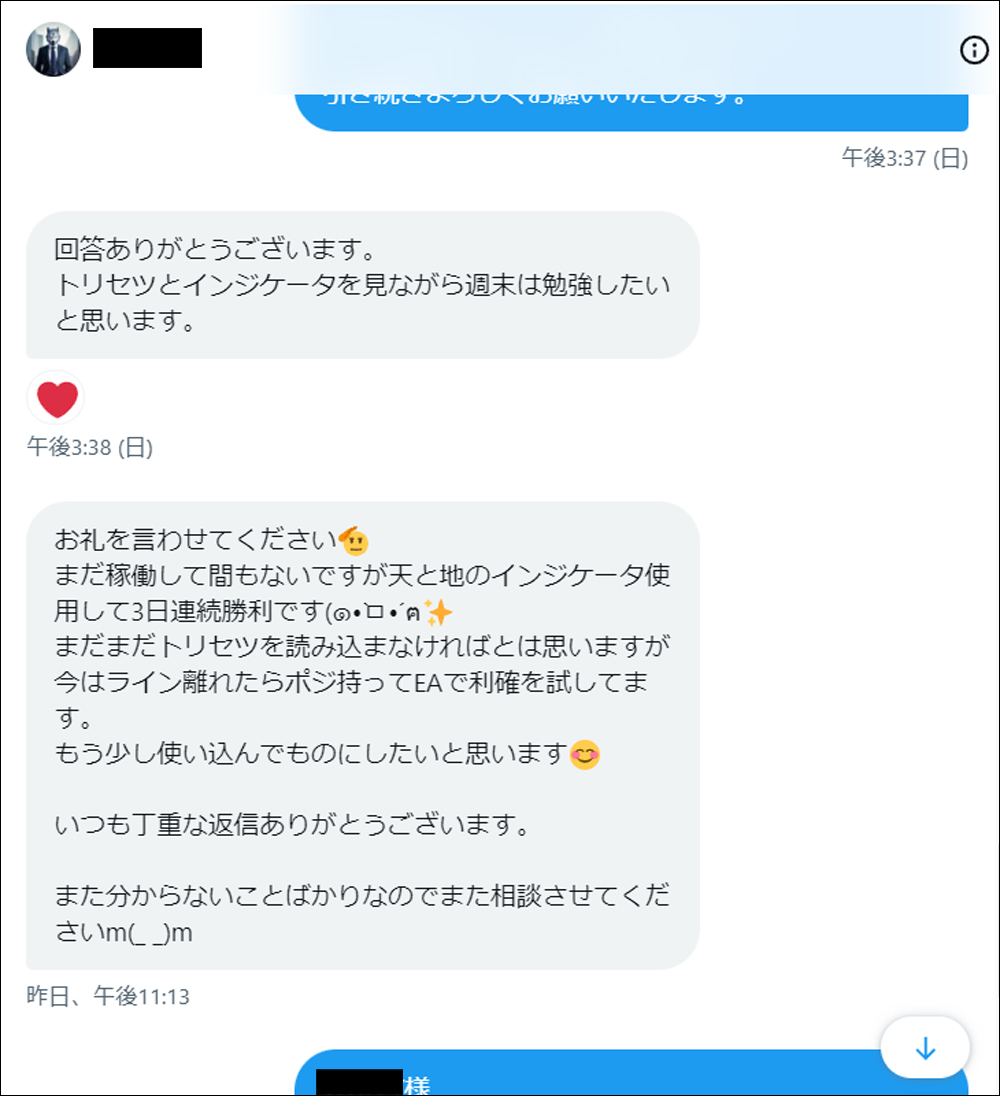
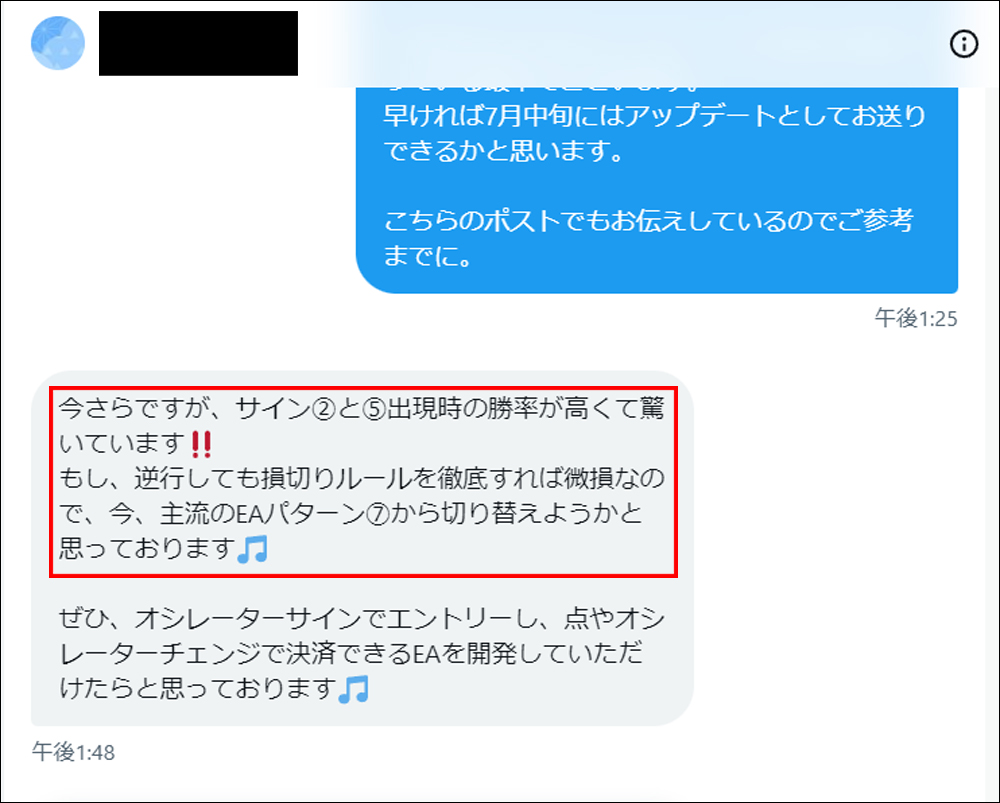
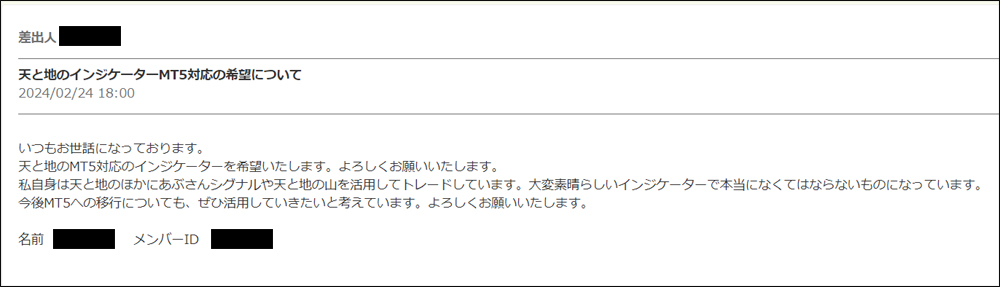
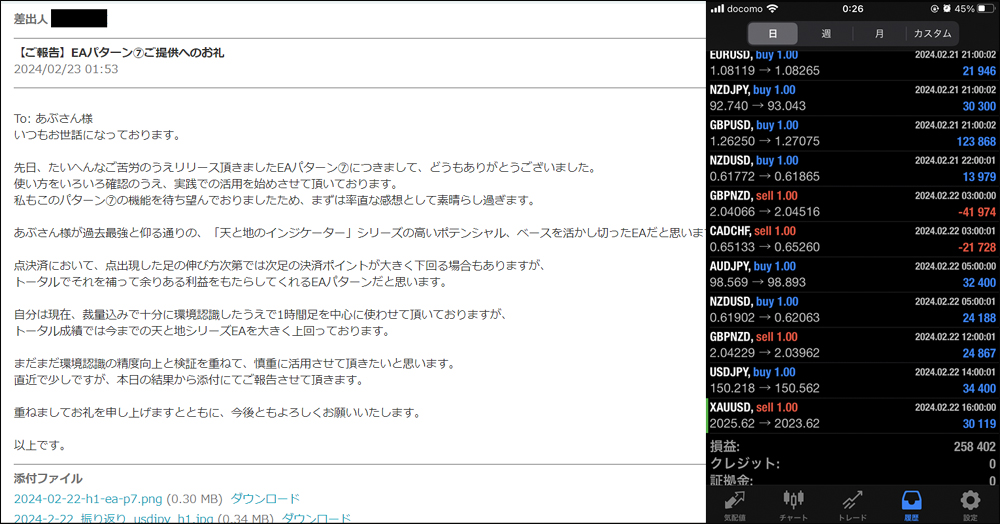
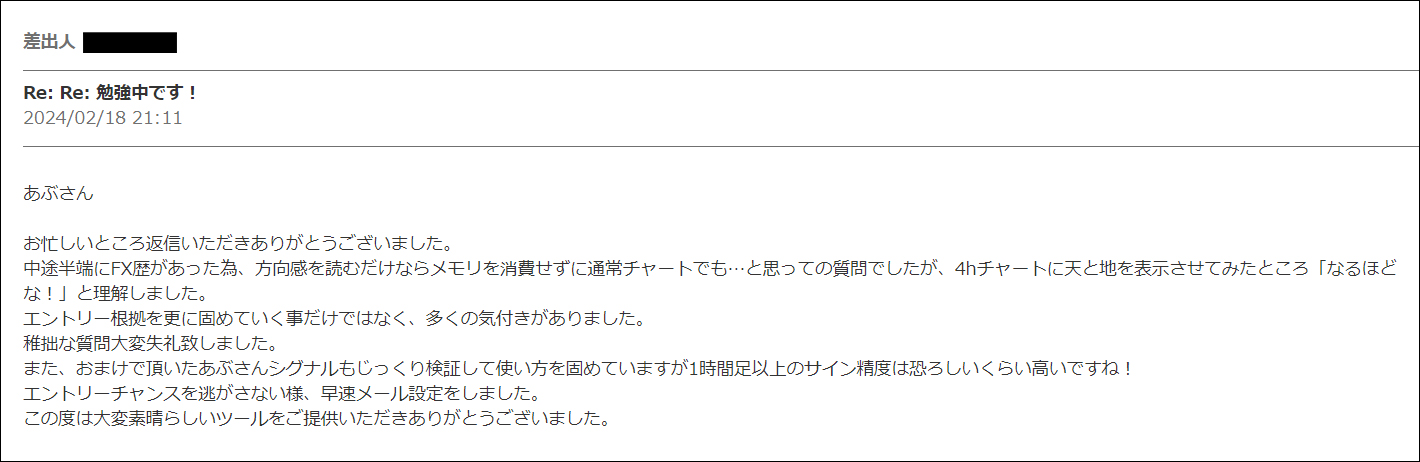
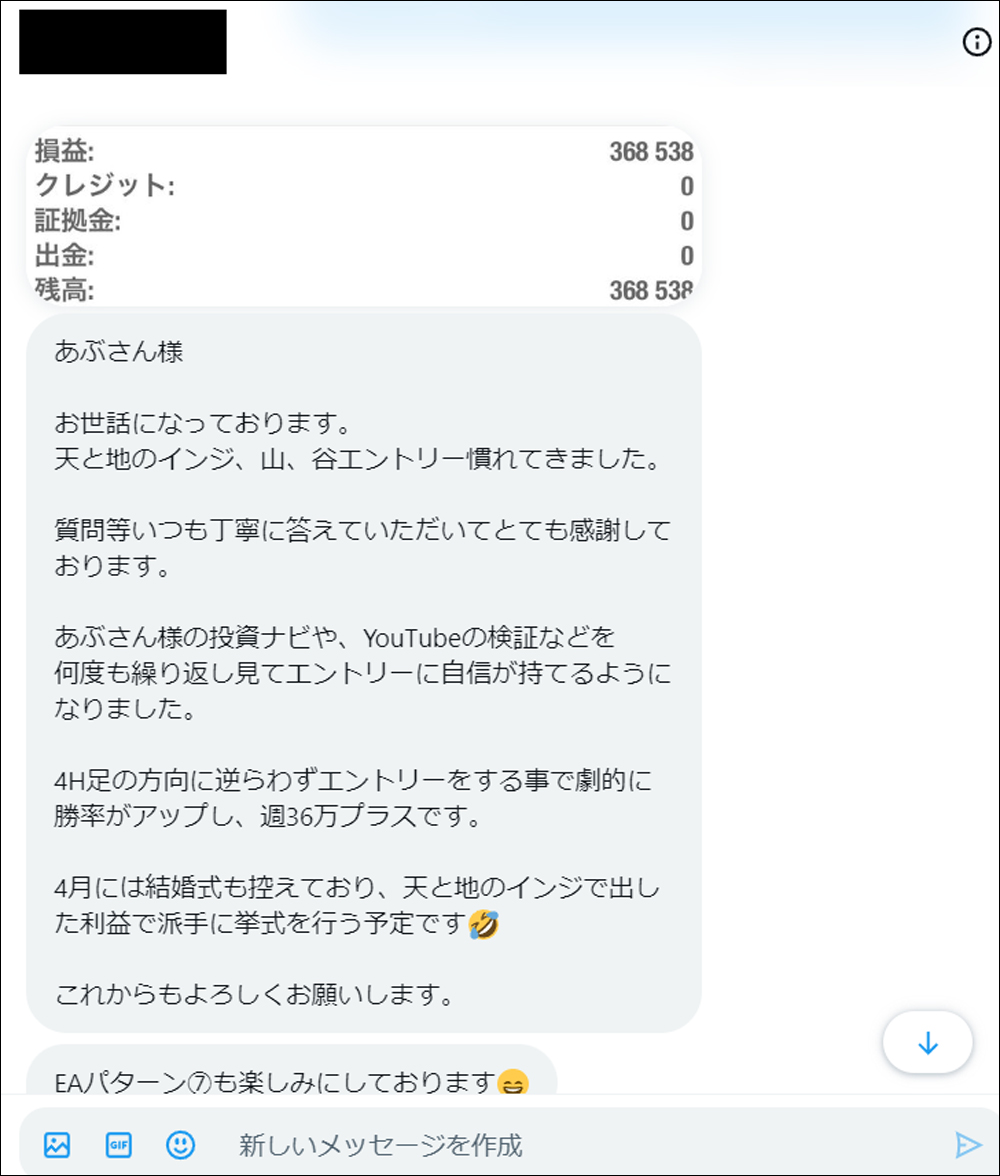
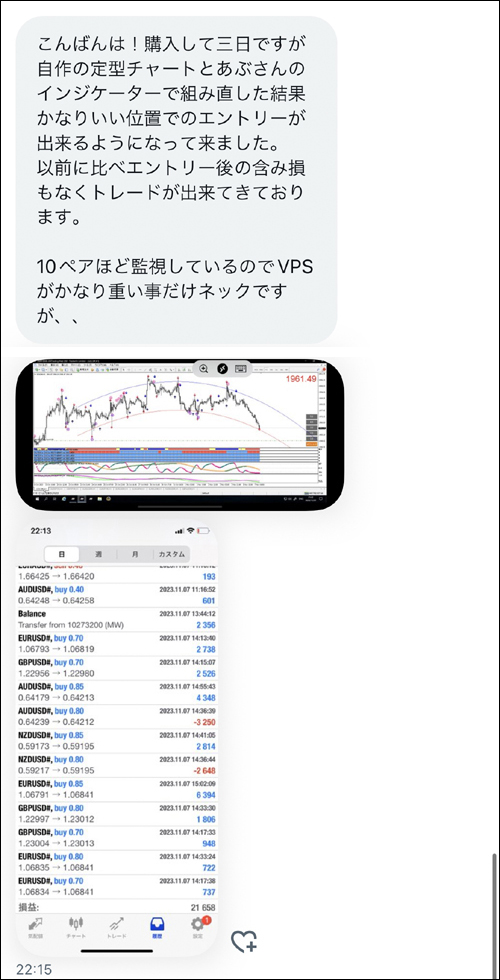
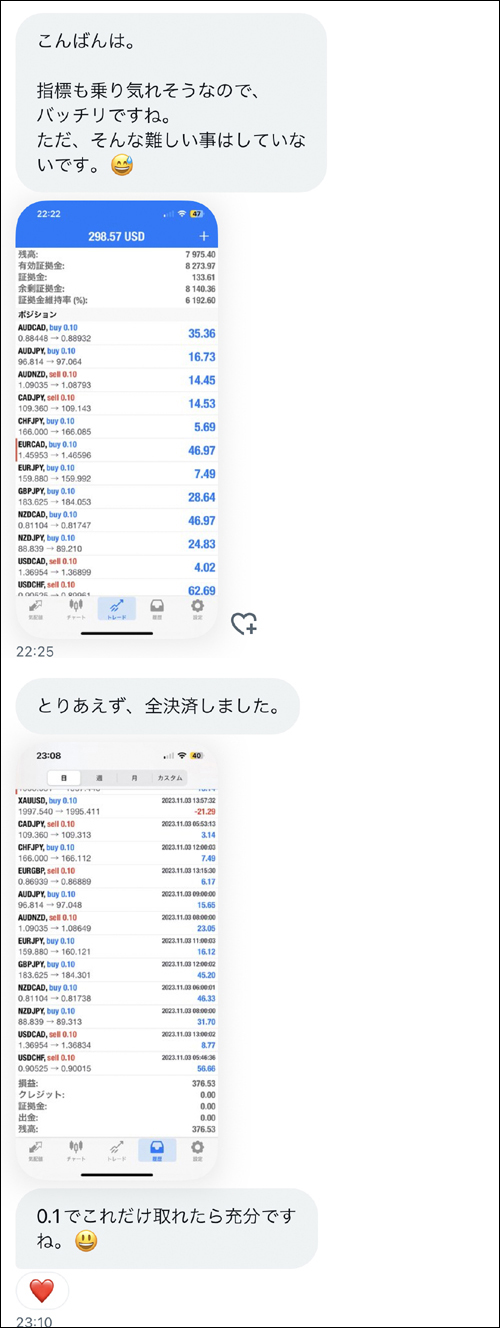
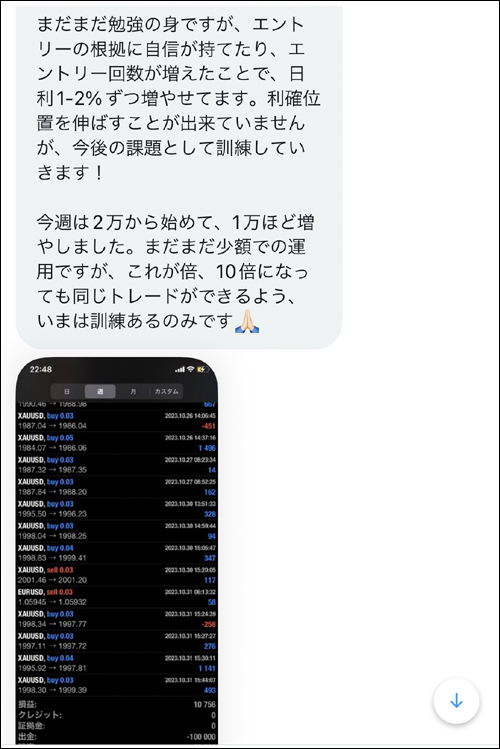
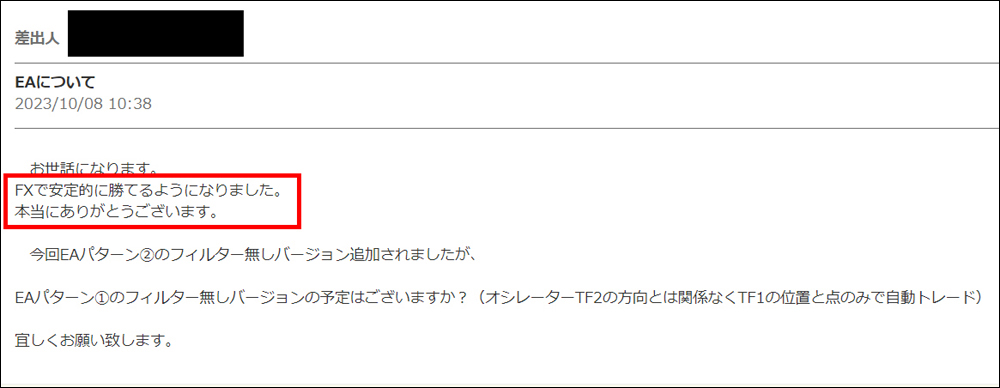
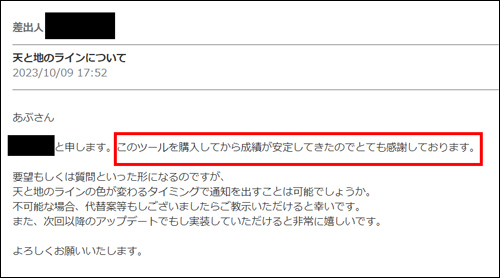
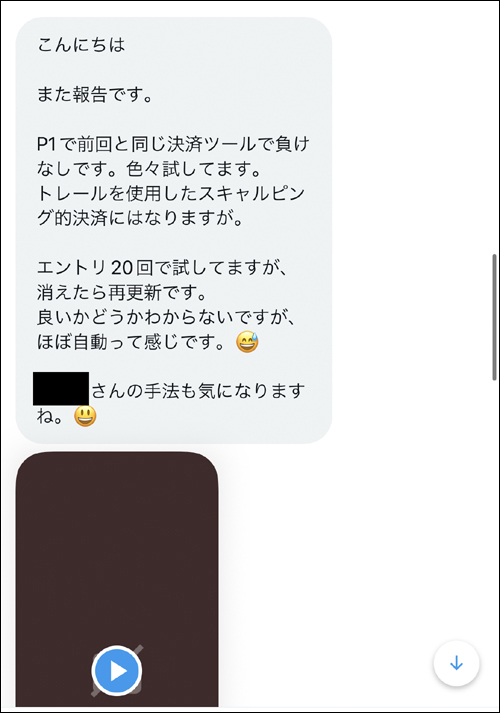
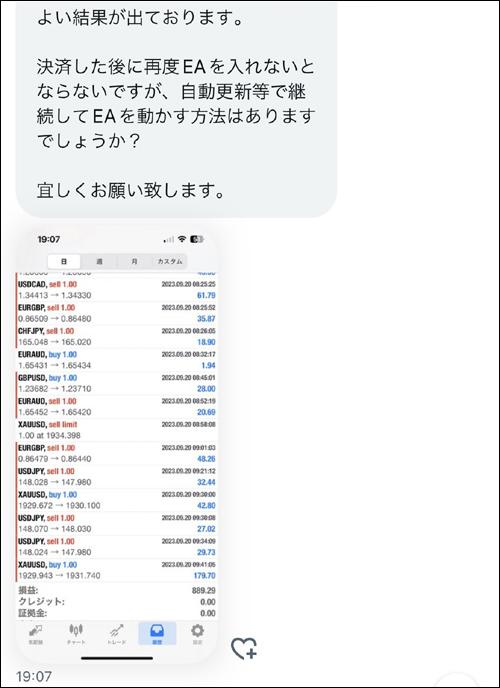
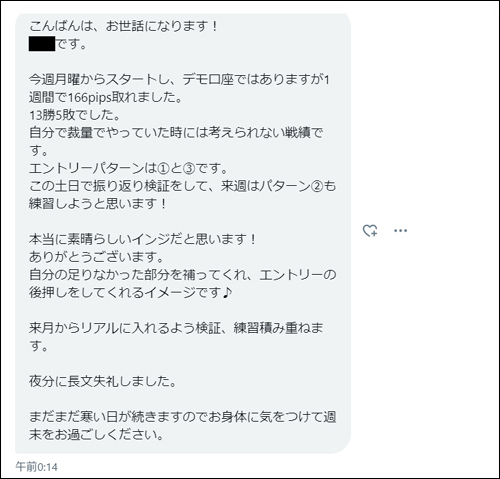
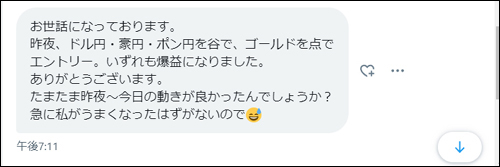
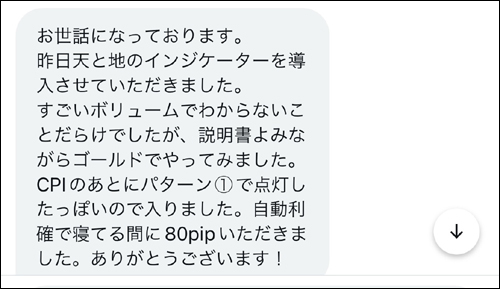
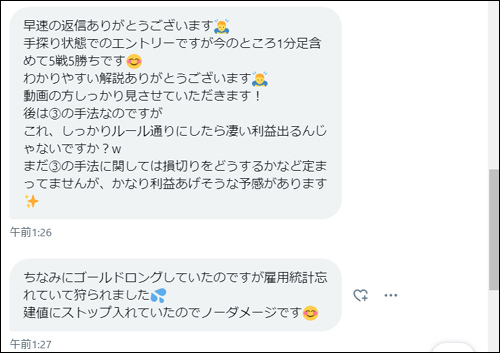
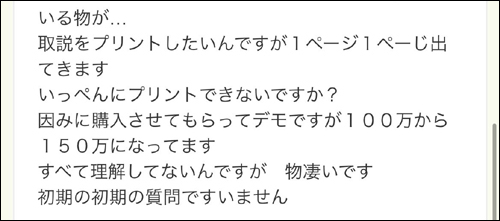
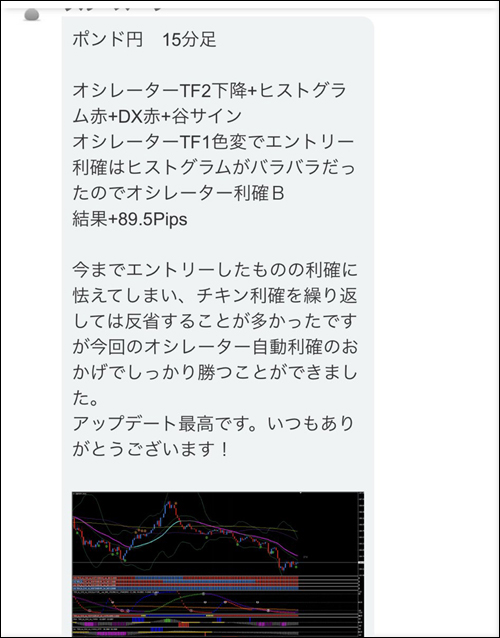
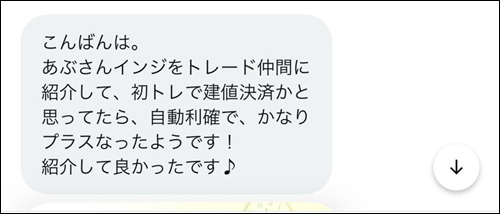
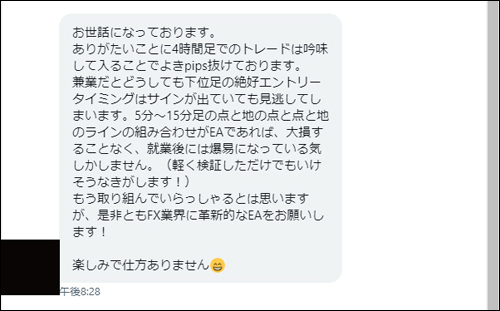
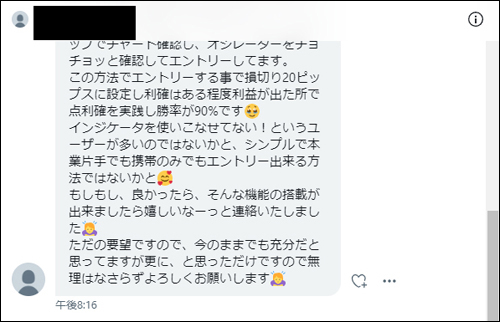
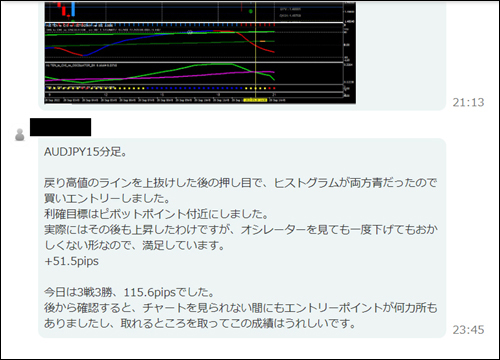
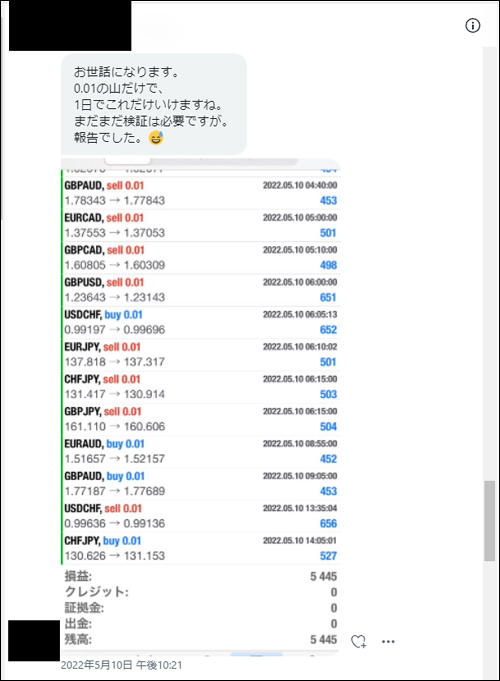
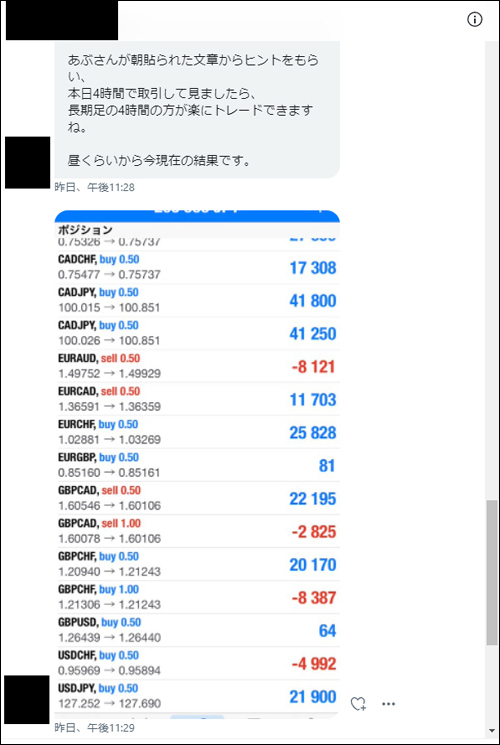
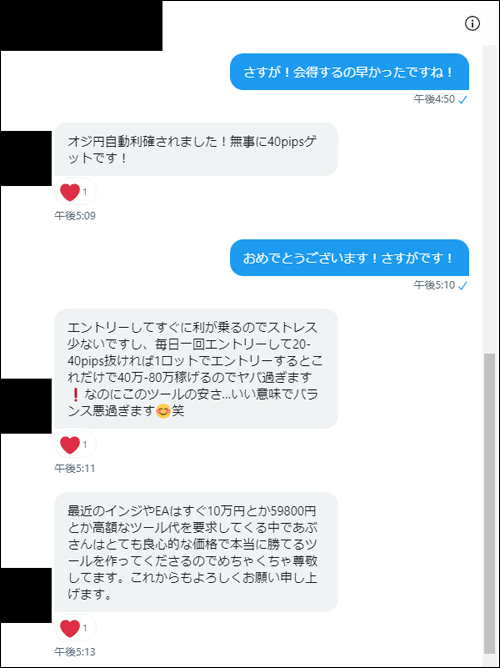
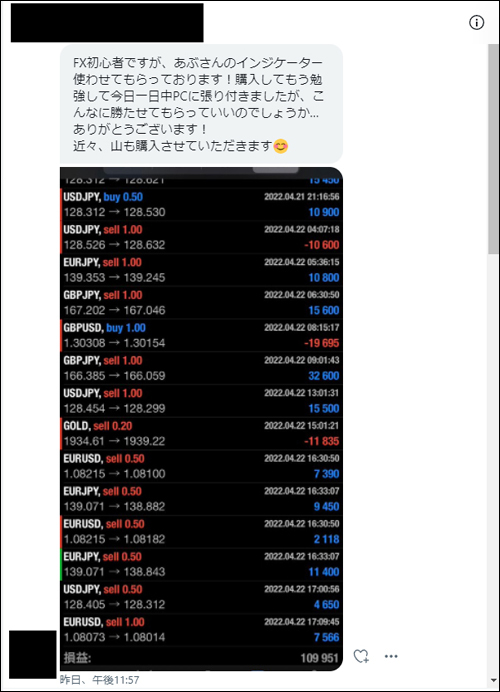
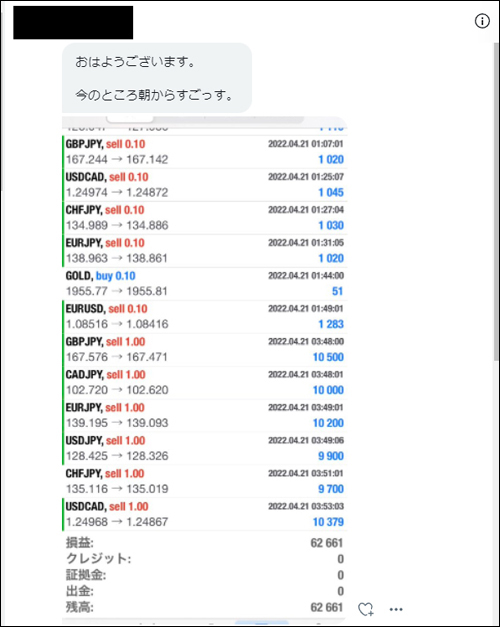
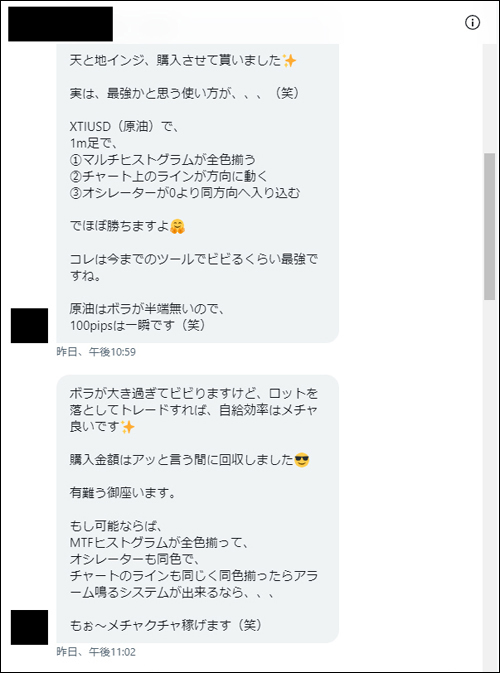
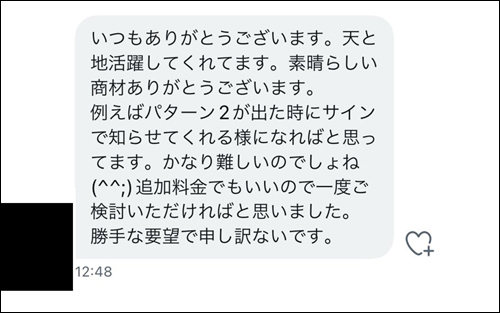
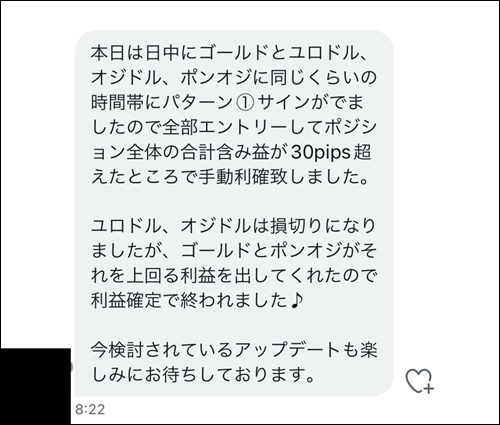
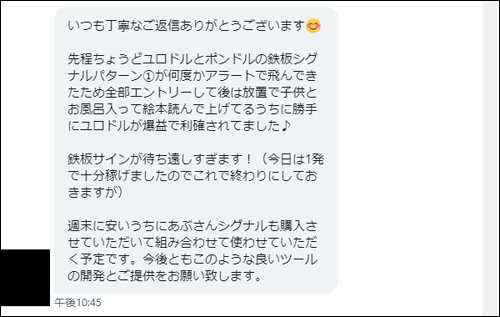
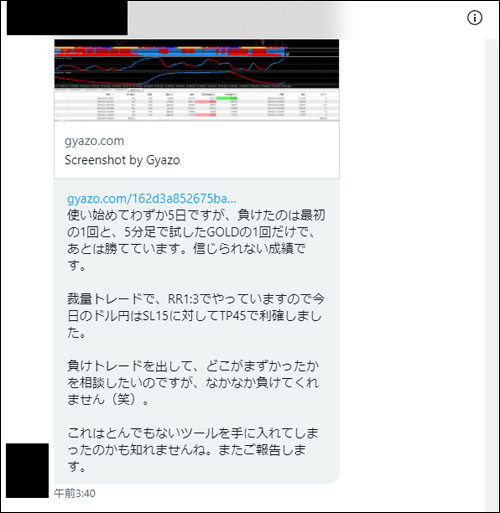
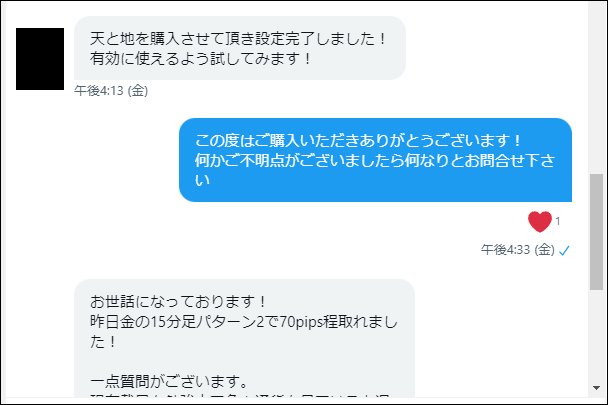
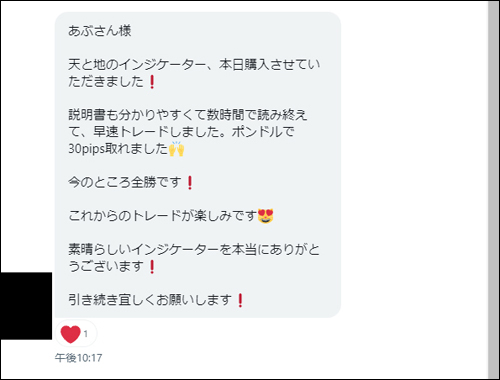
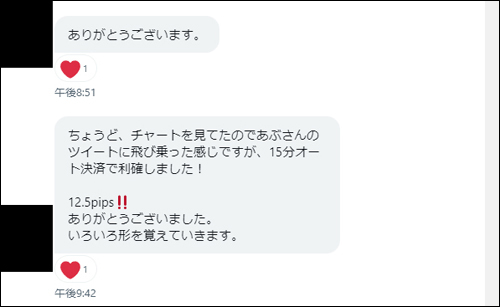
We would like to share some of the many pleasant DMs we received from users. ↓


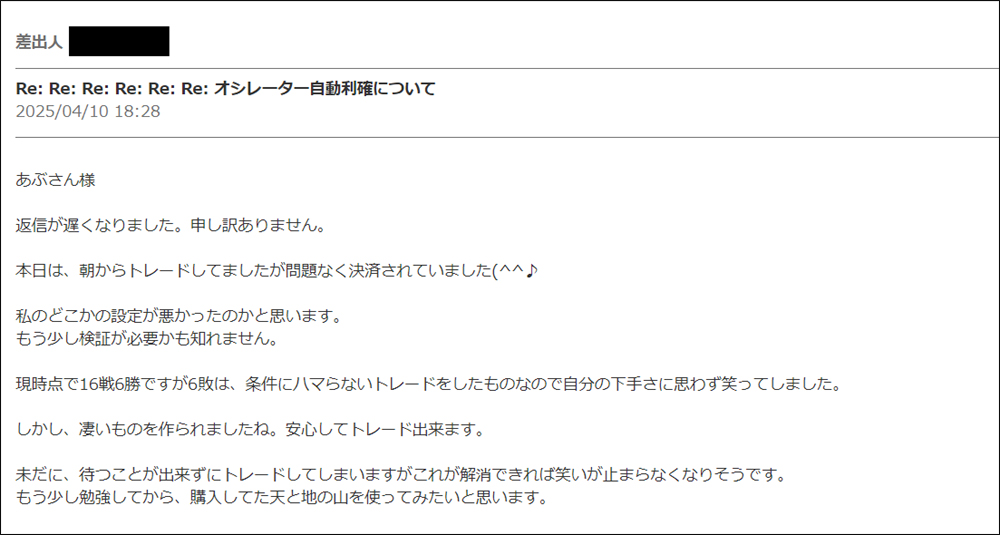
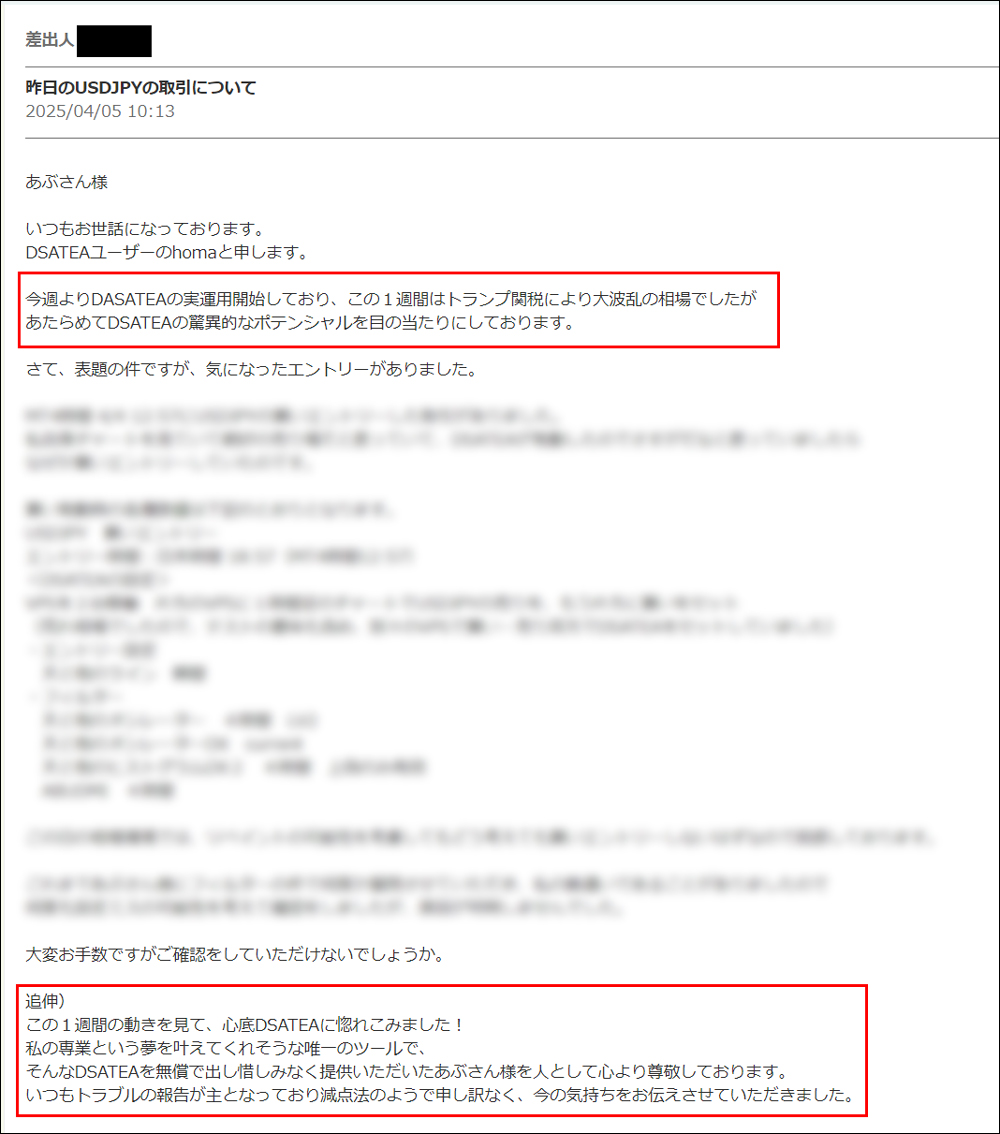
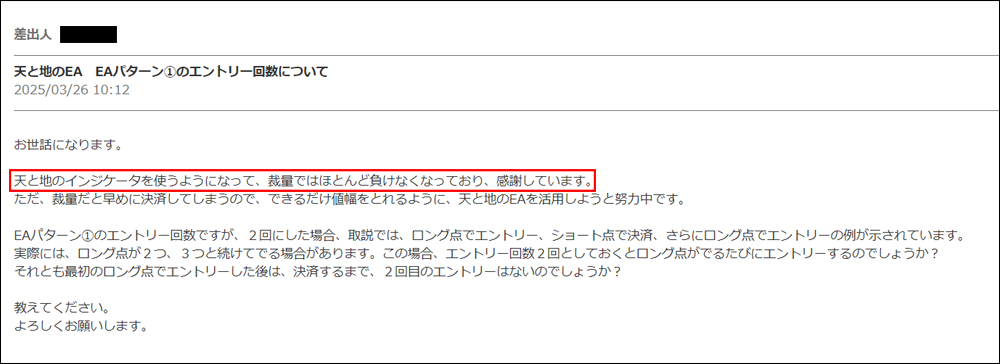
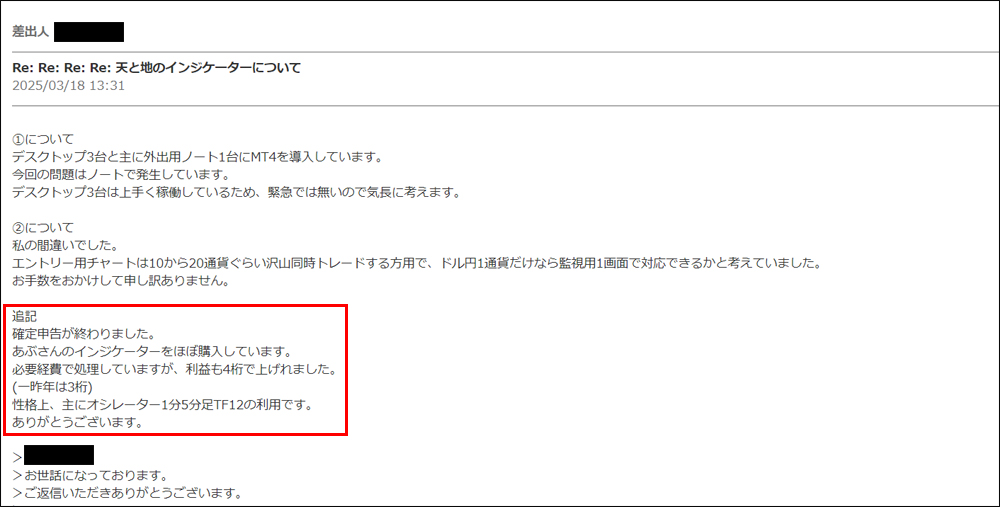

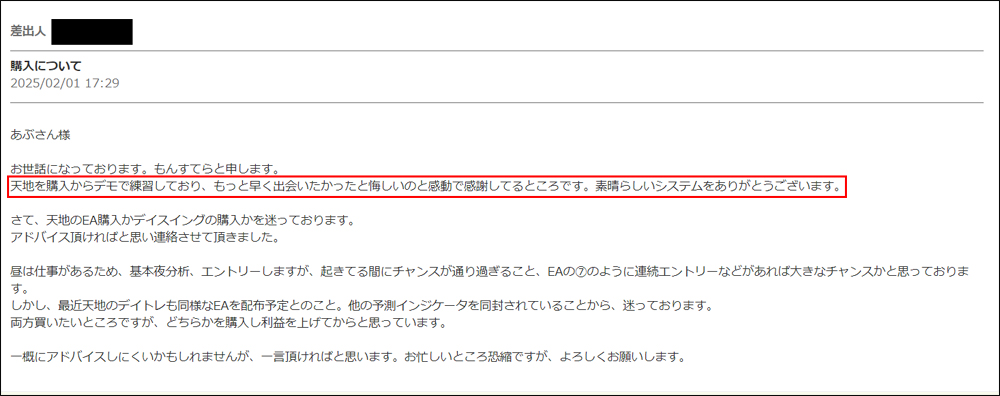
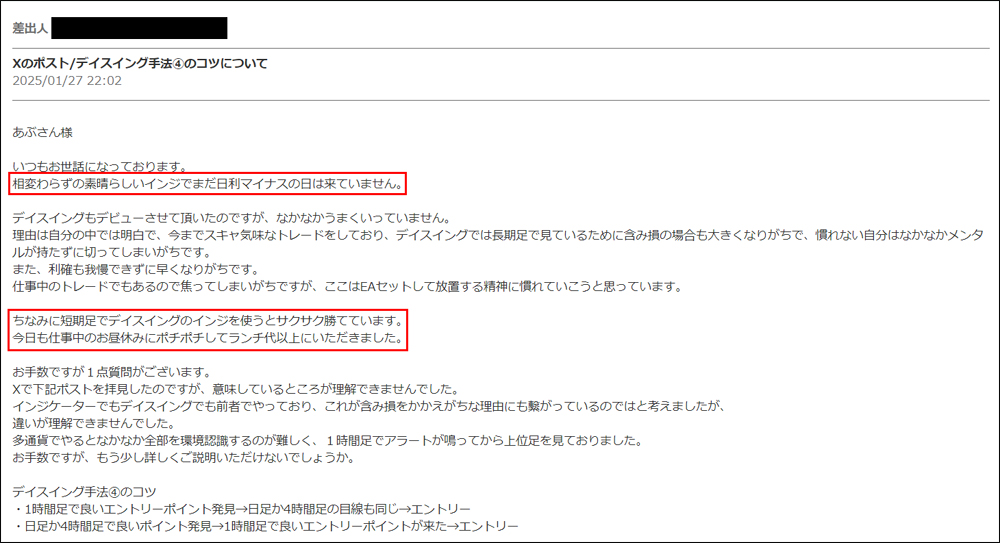
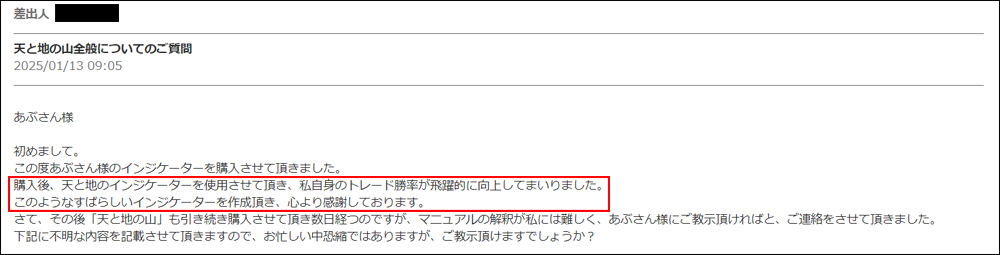
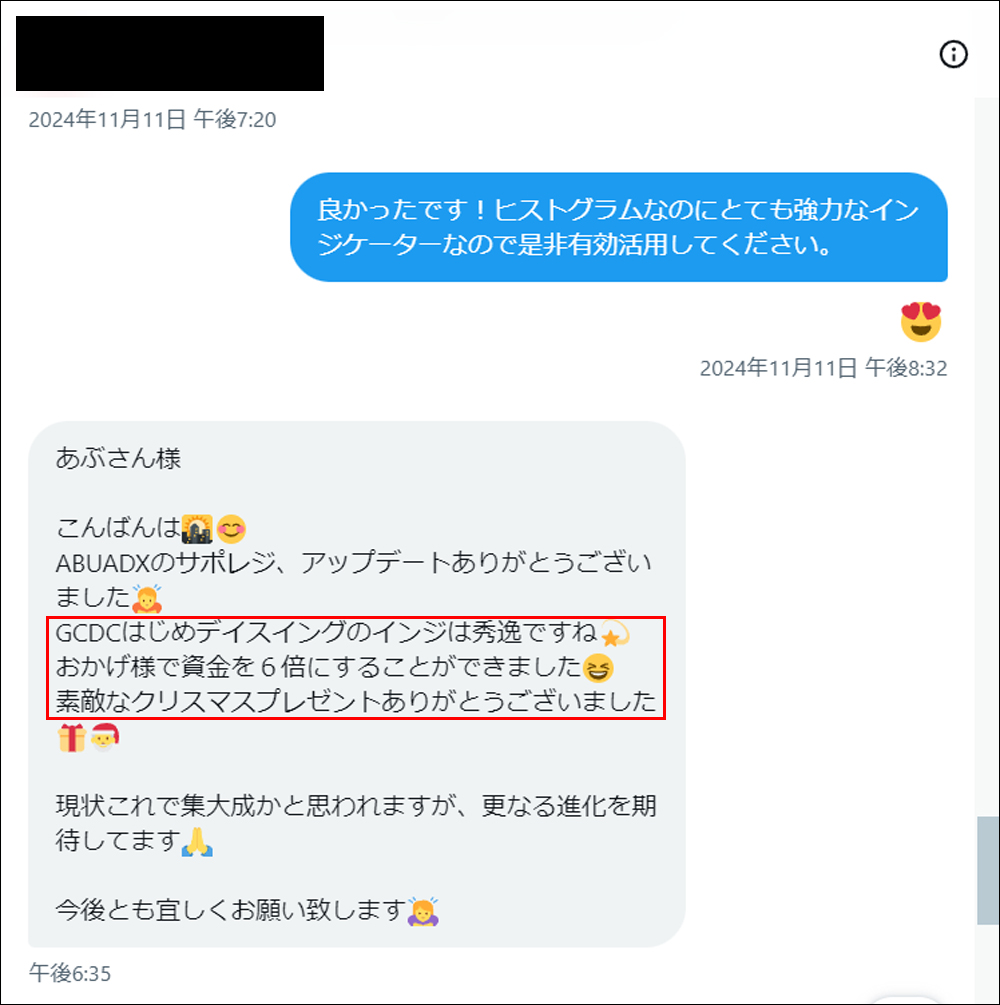
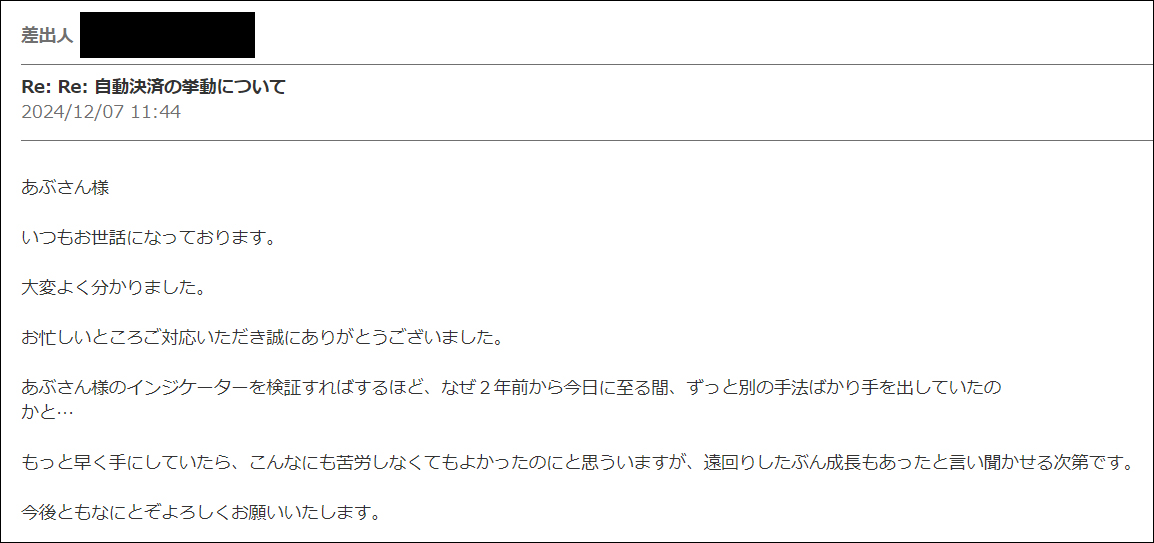
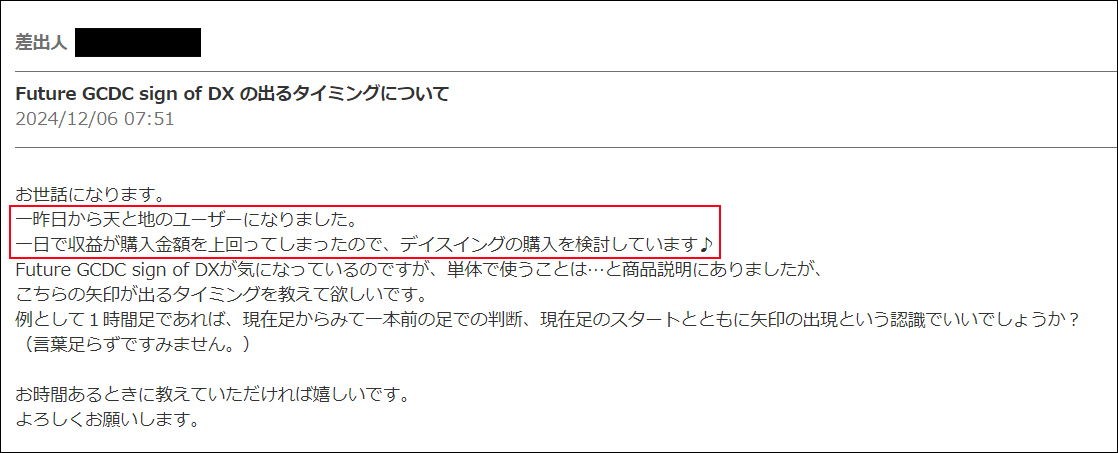
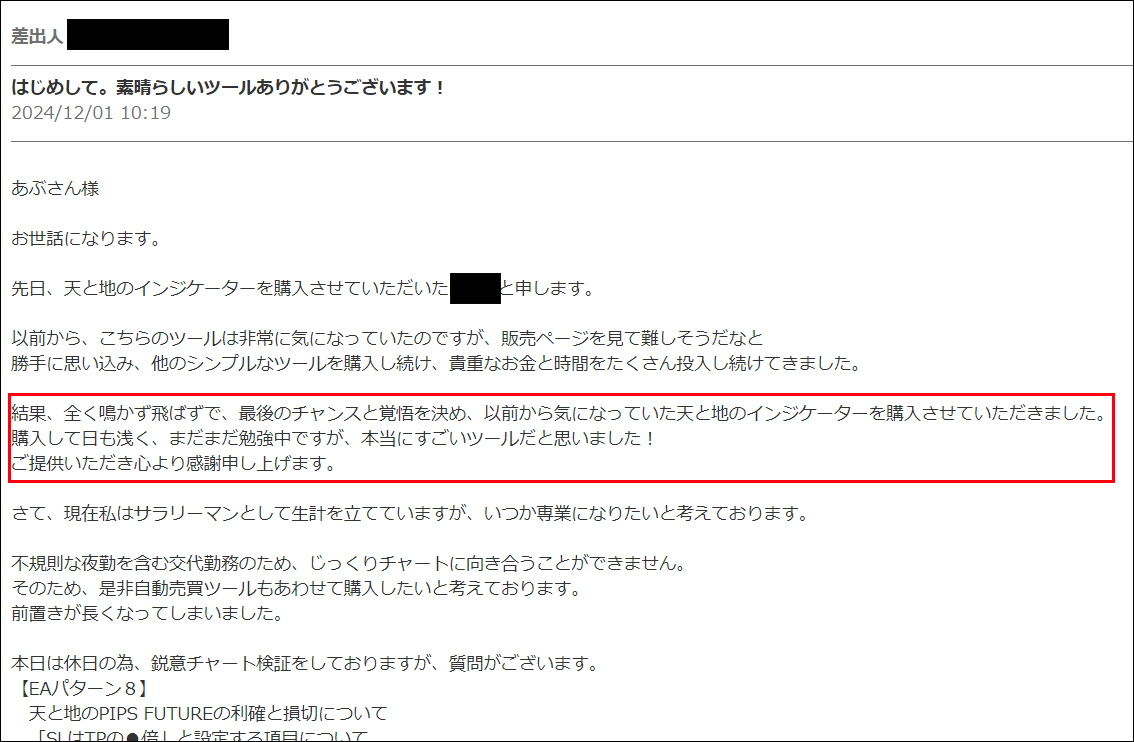
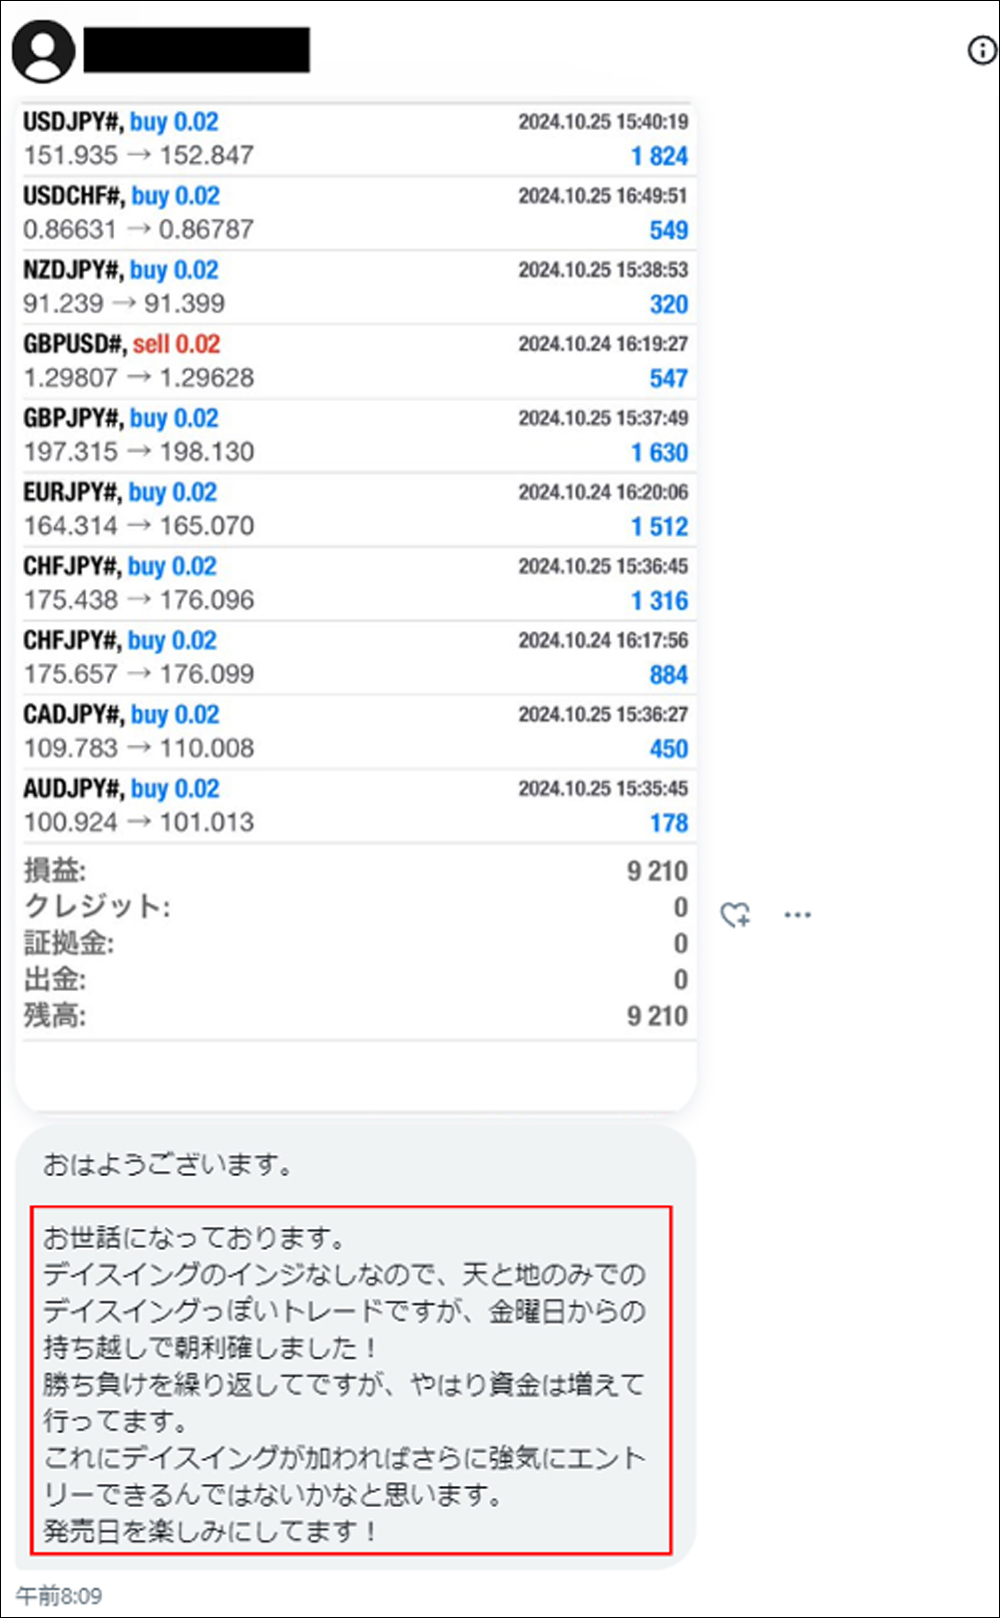
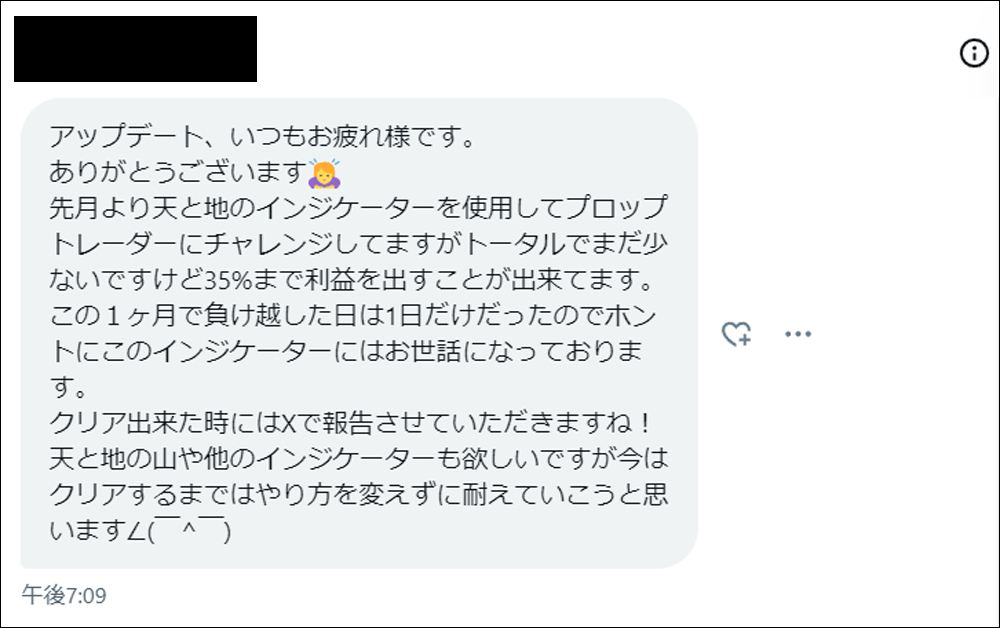
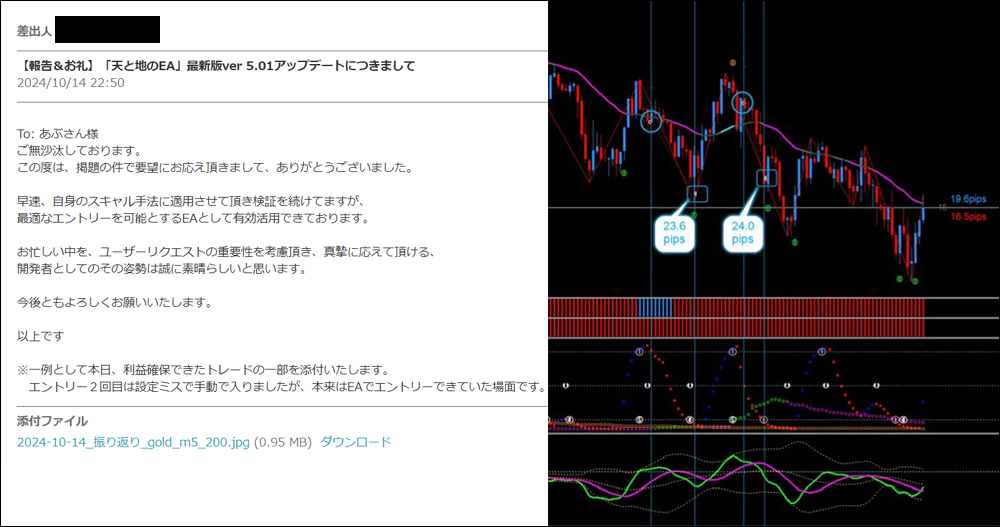
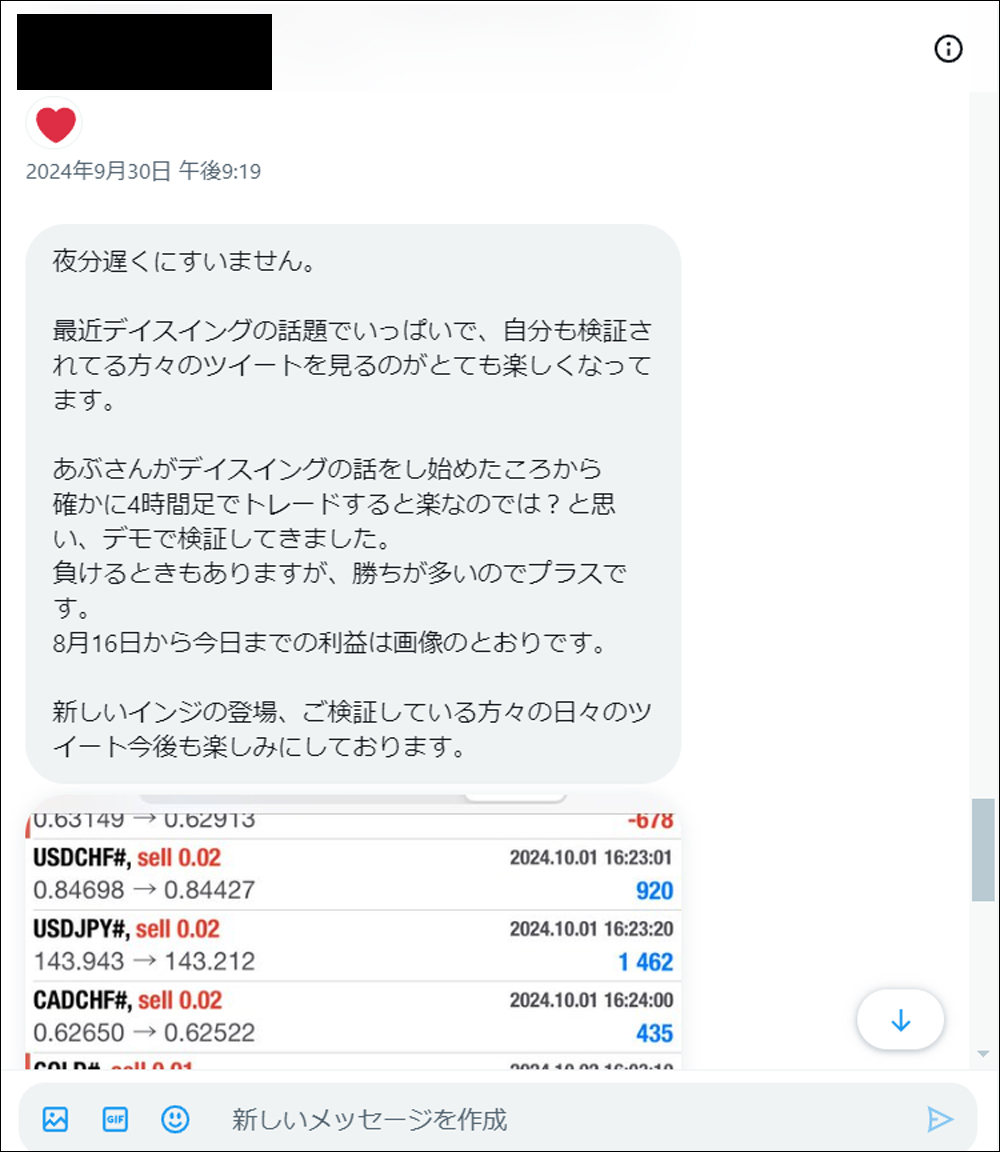
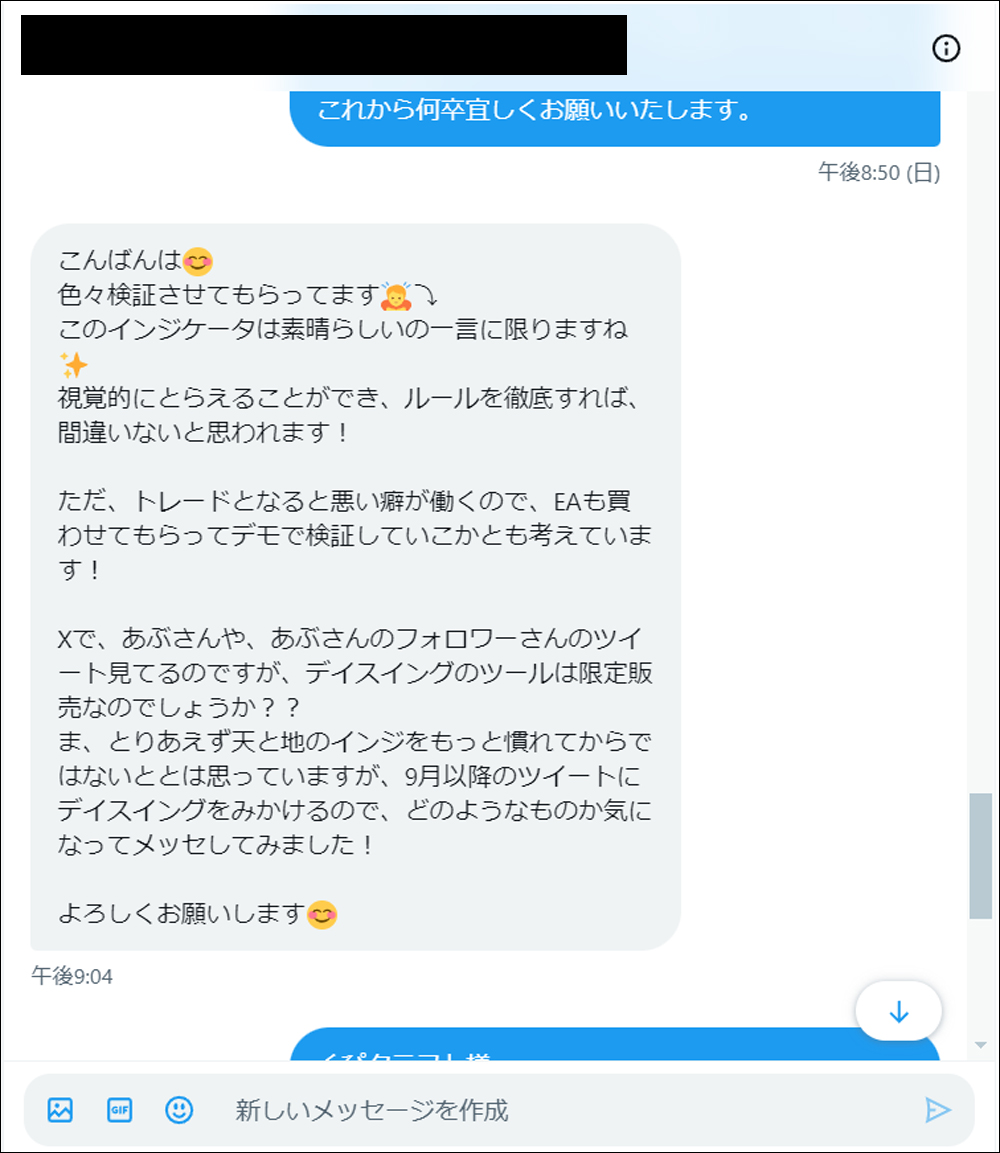
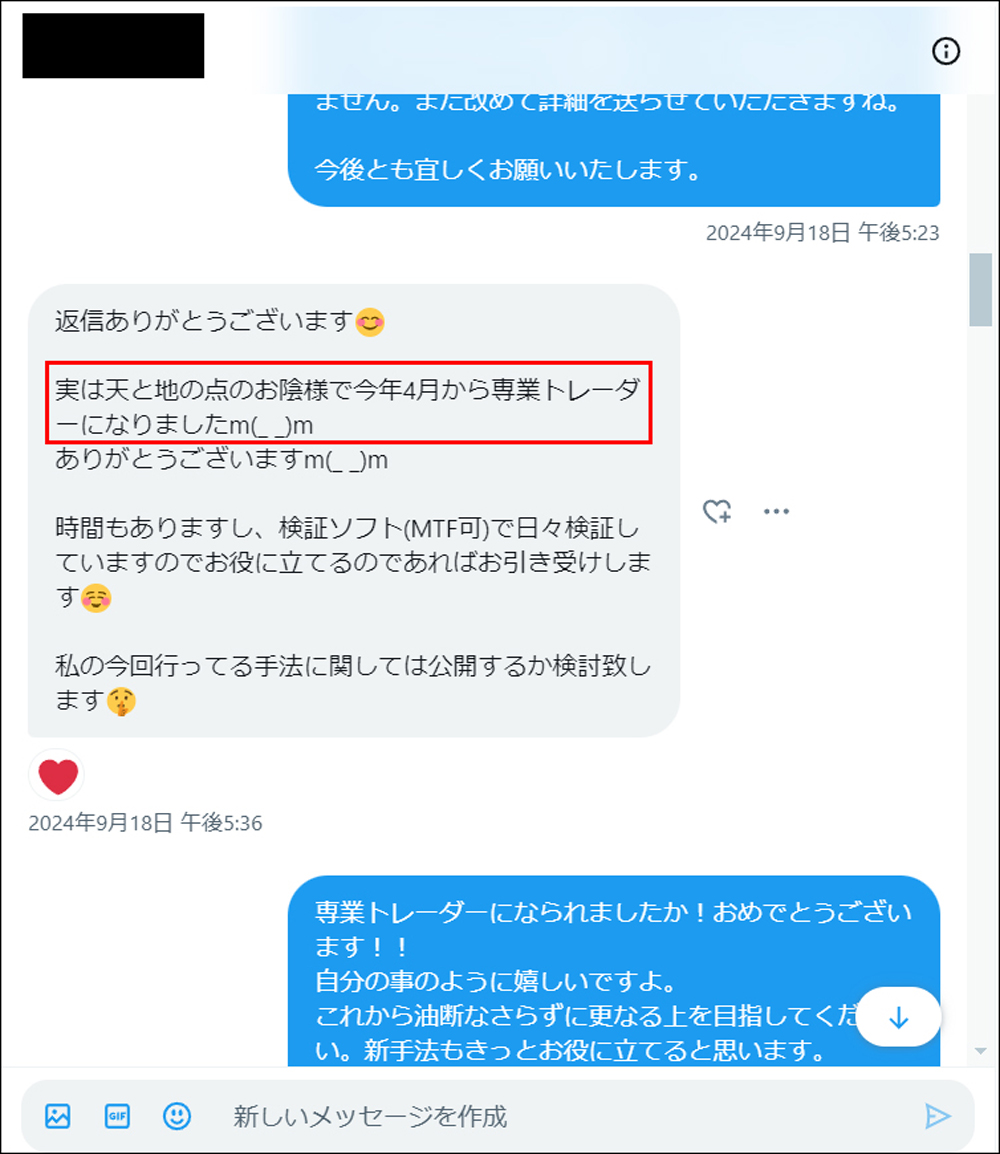
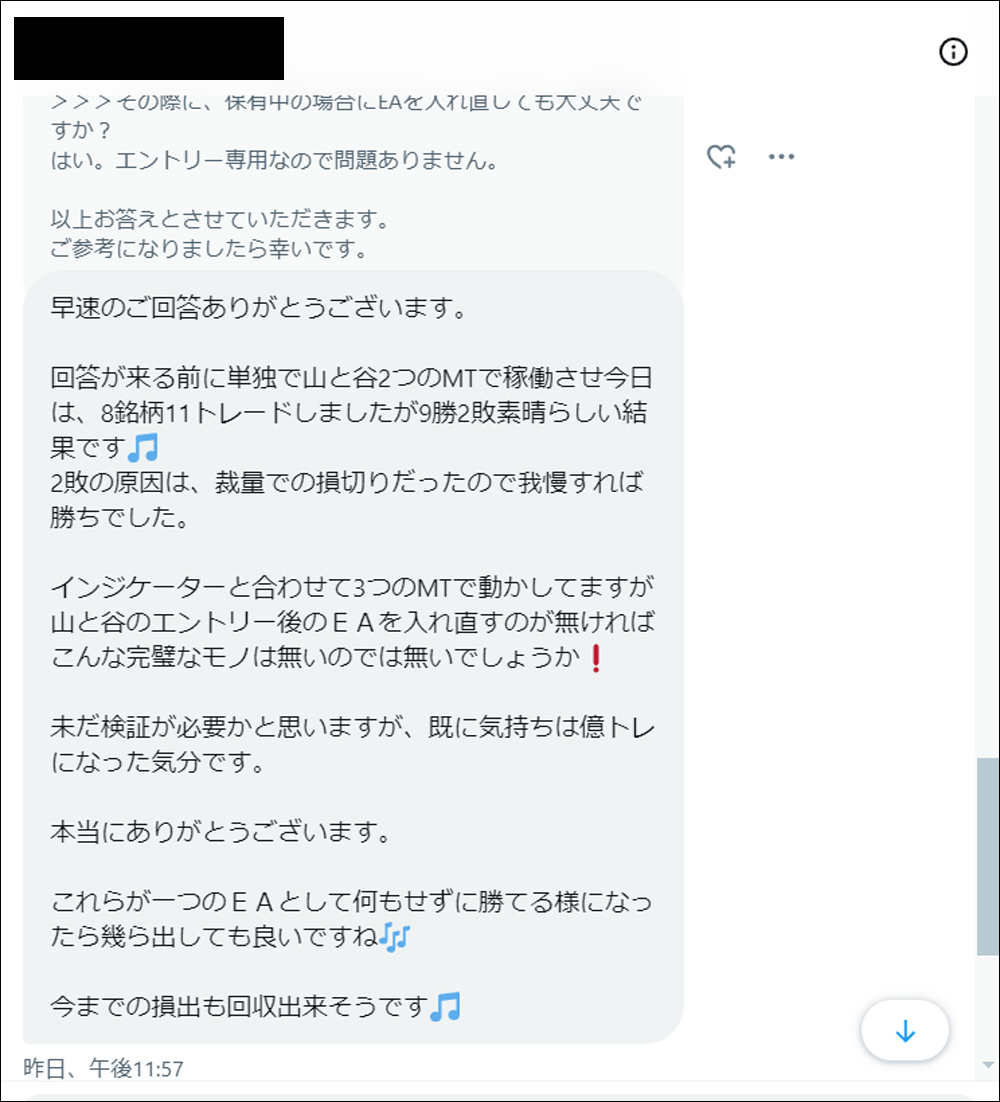
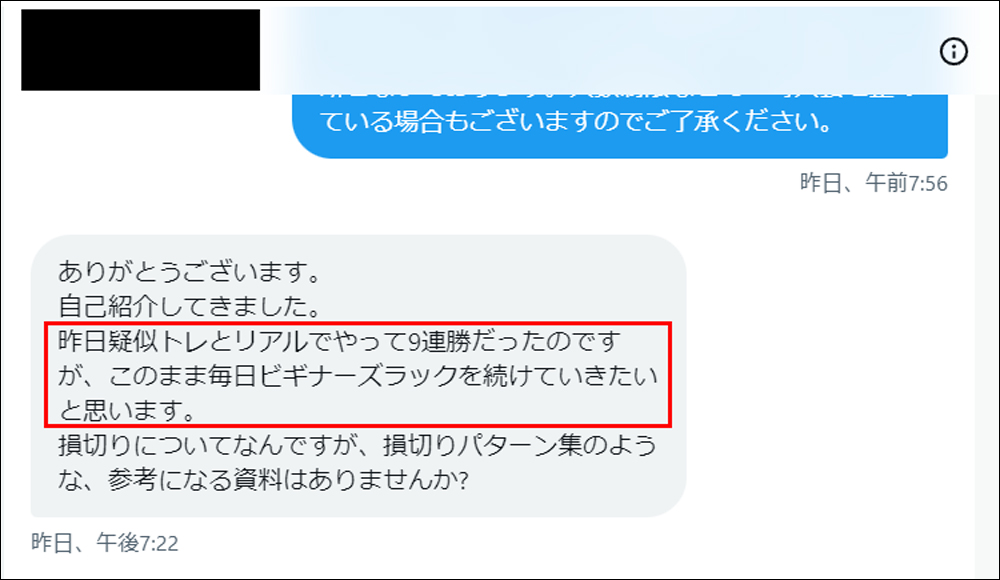
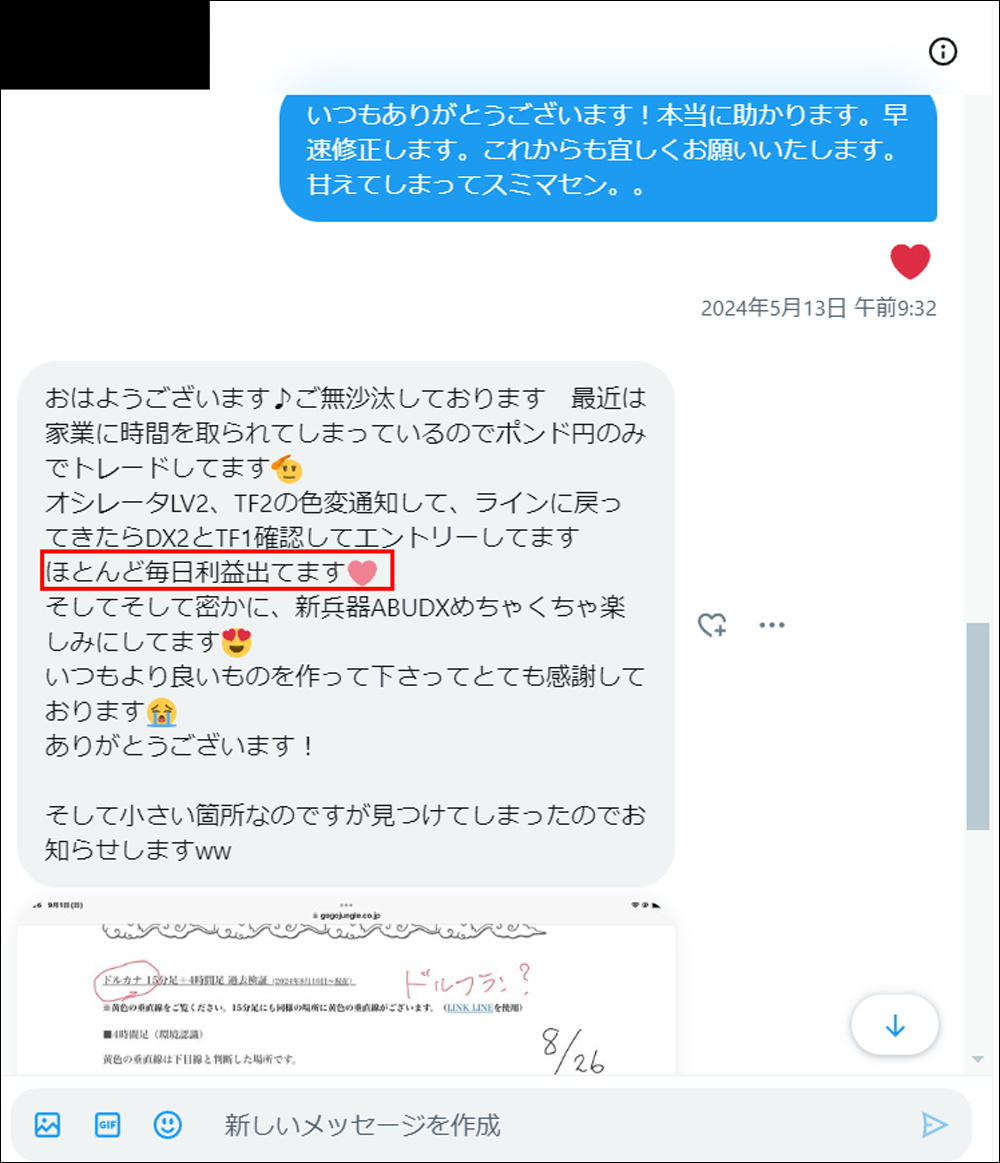
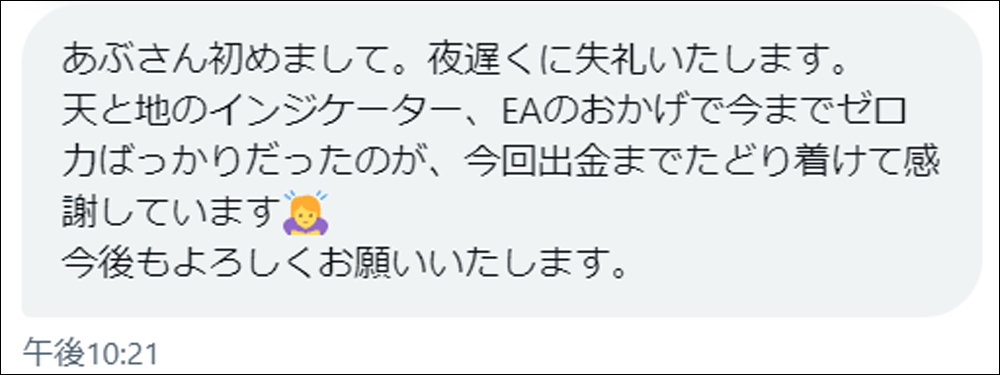
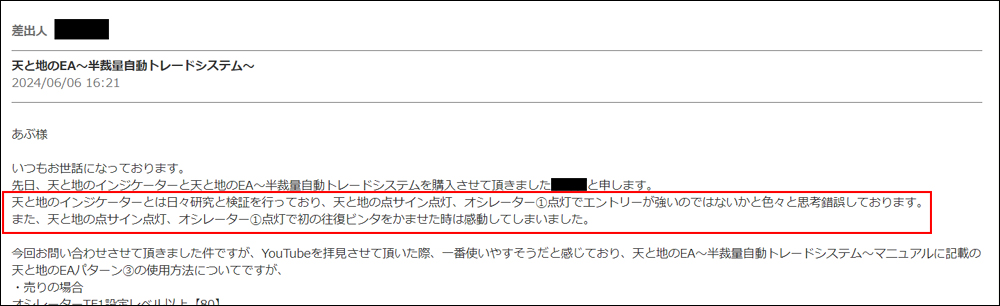
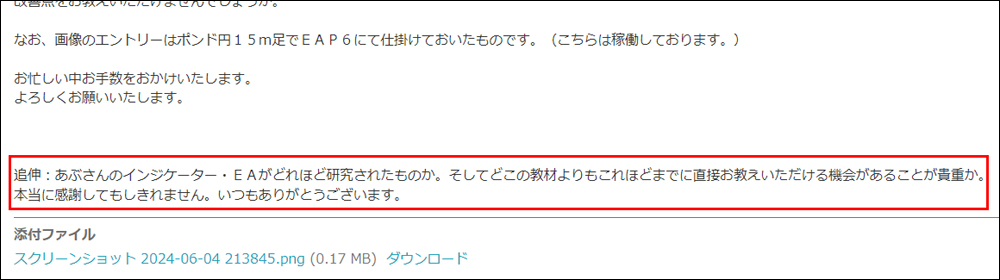
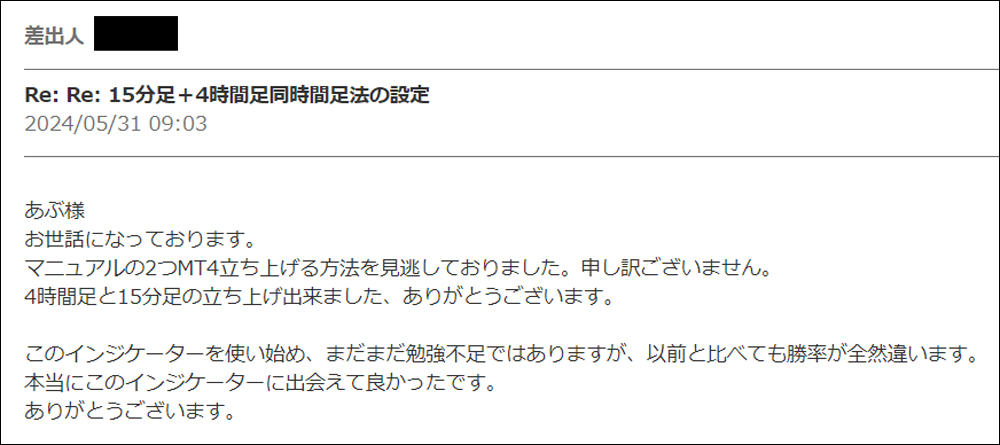
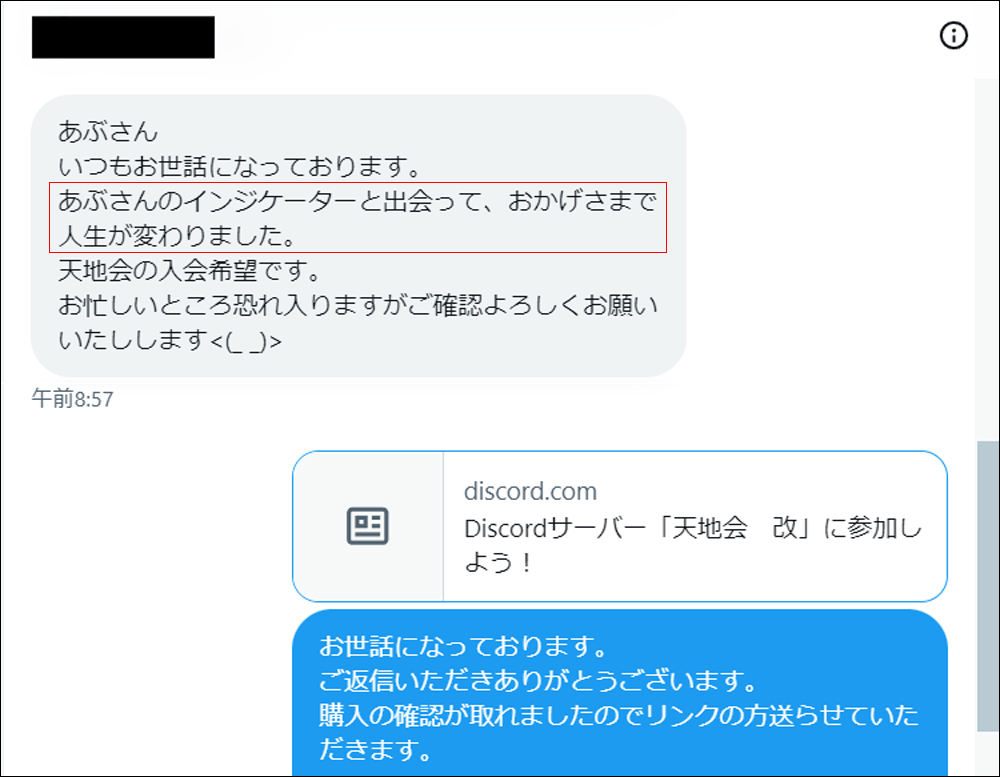
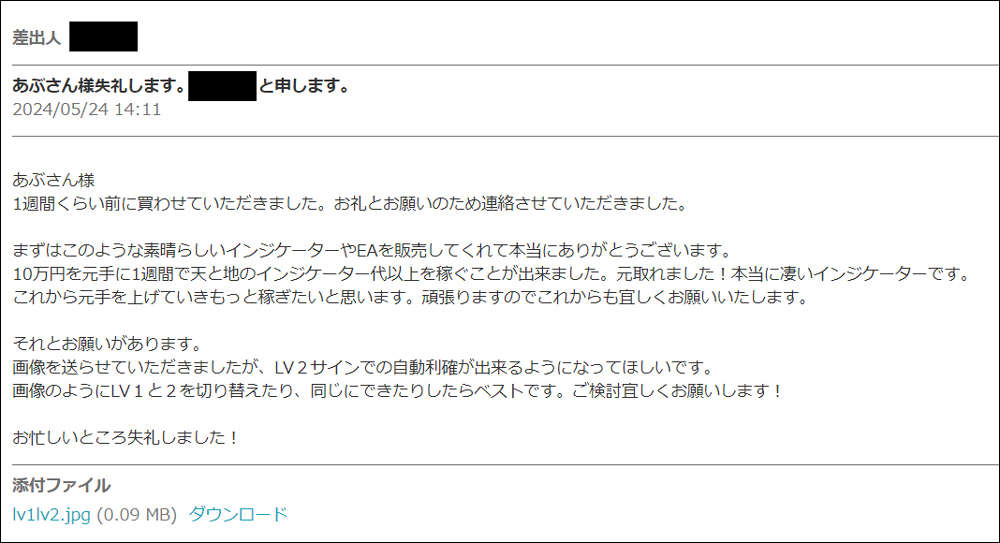
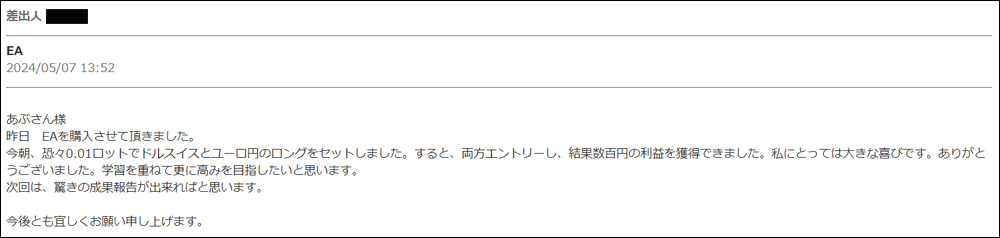
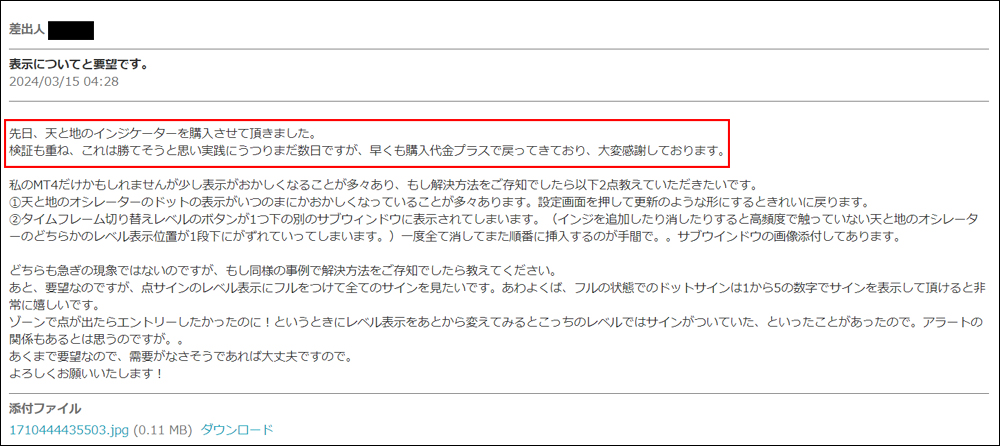


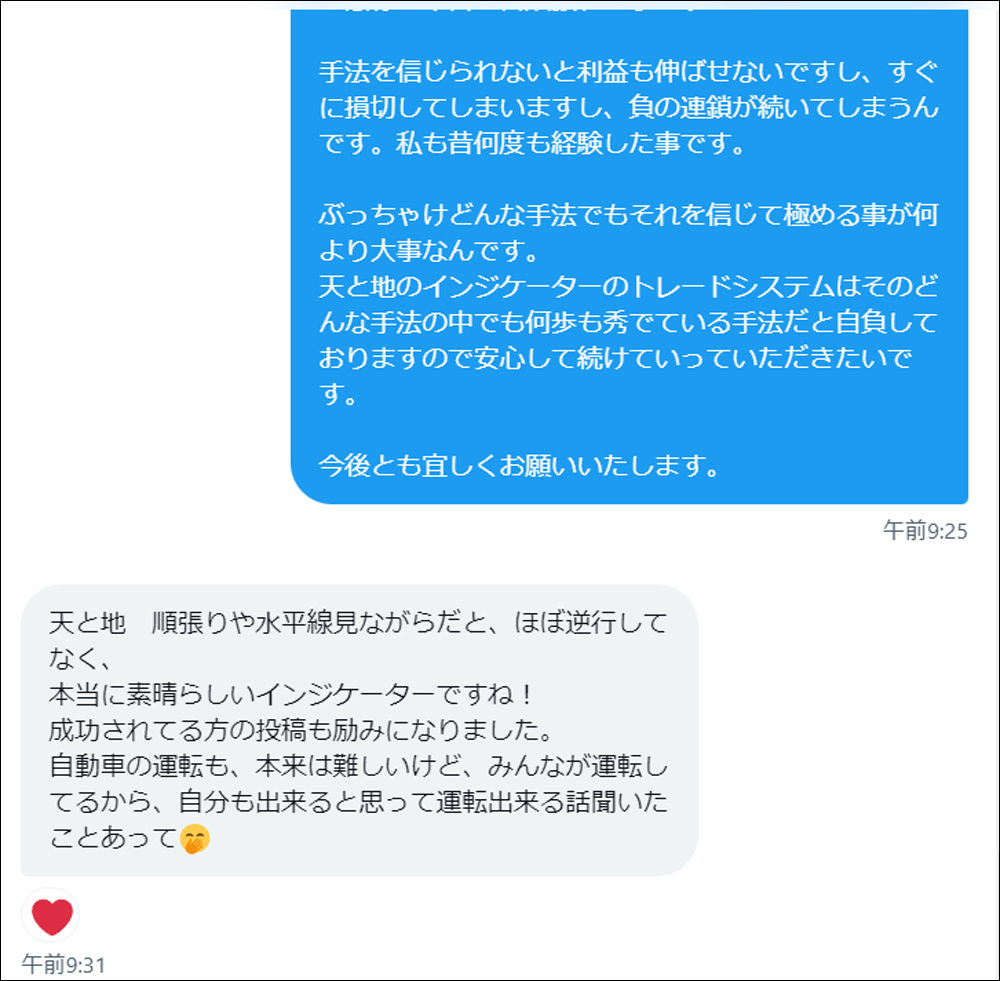
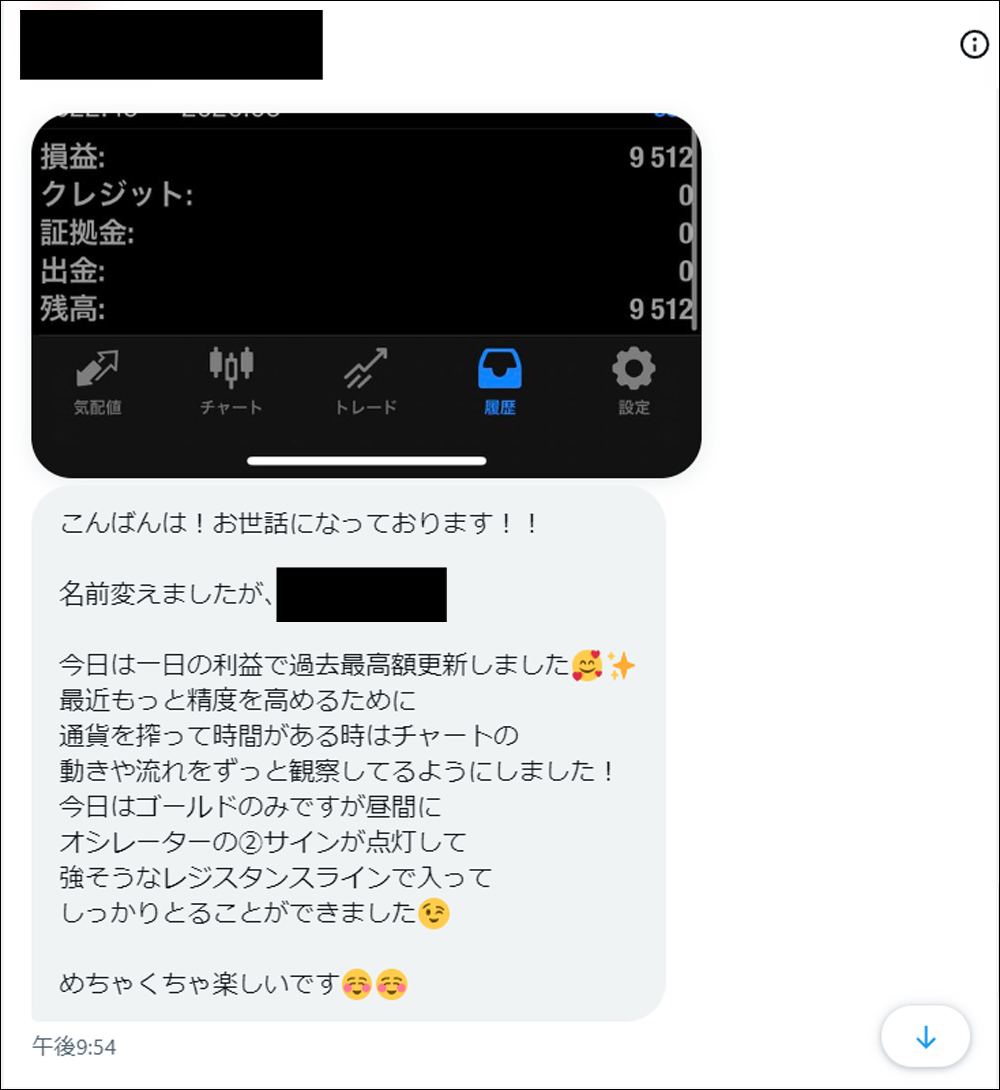
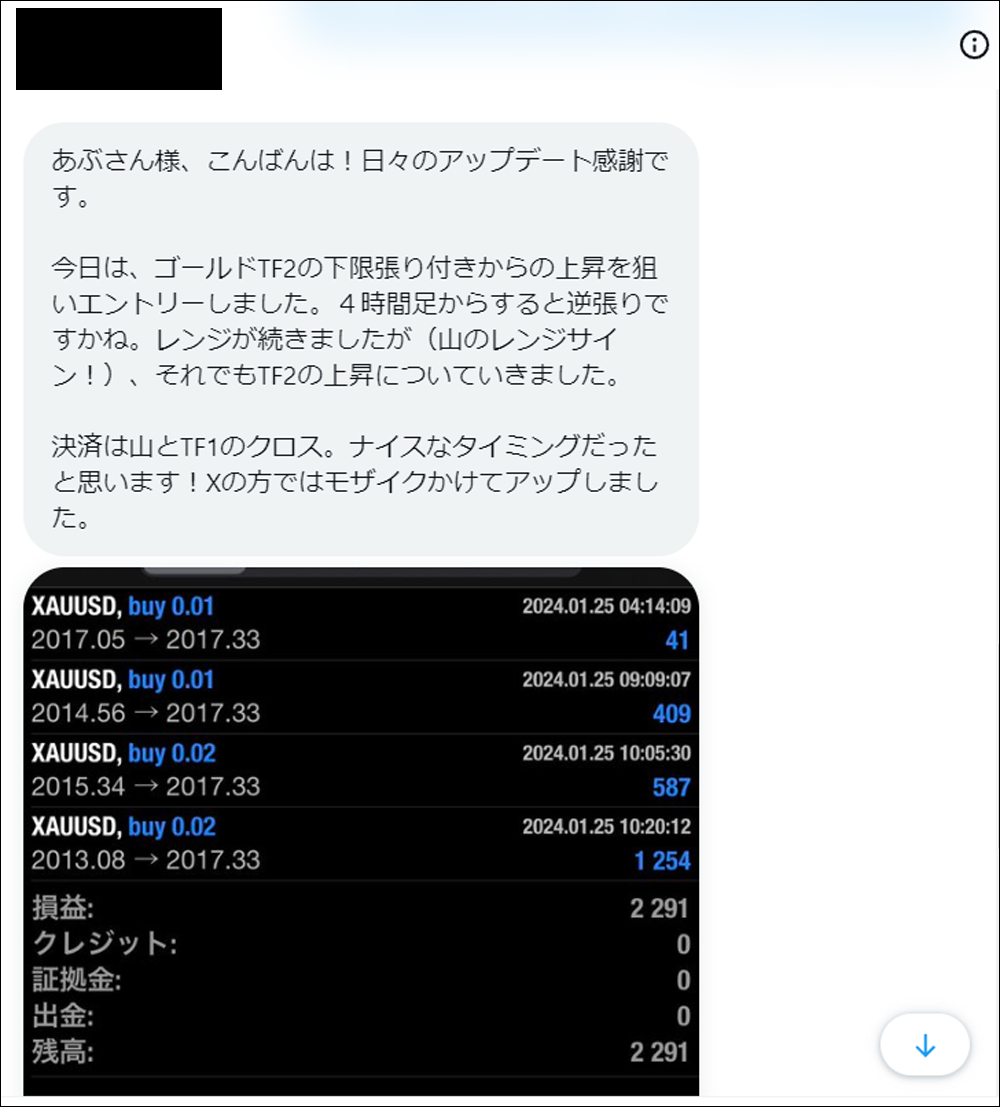
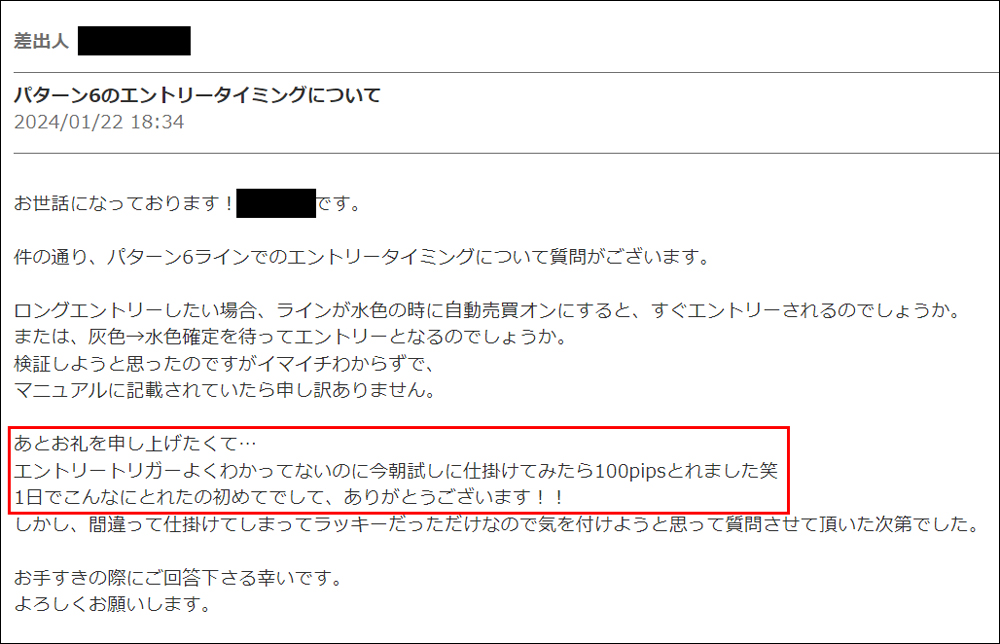

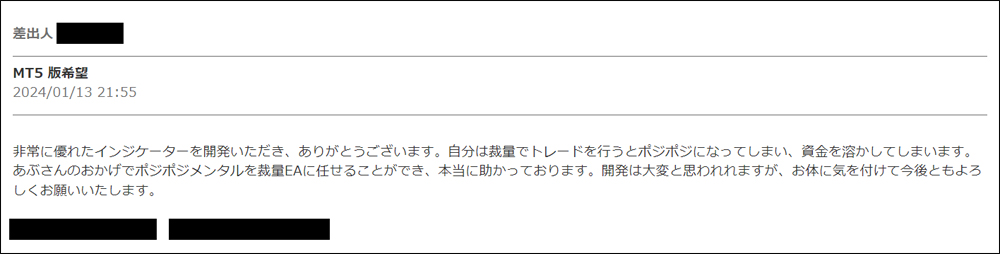
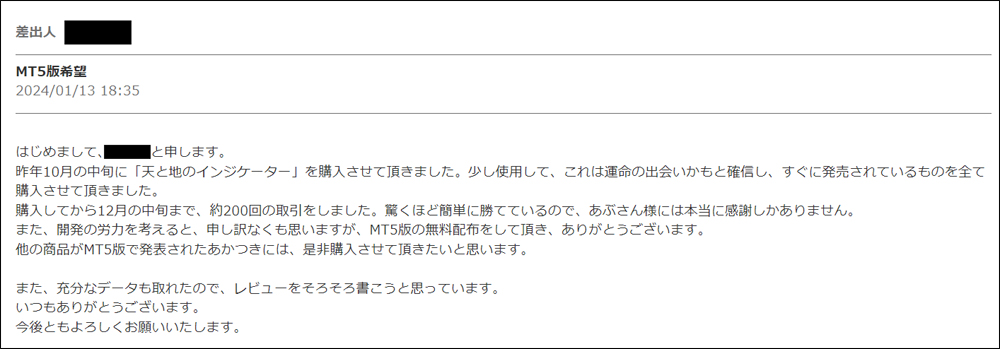
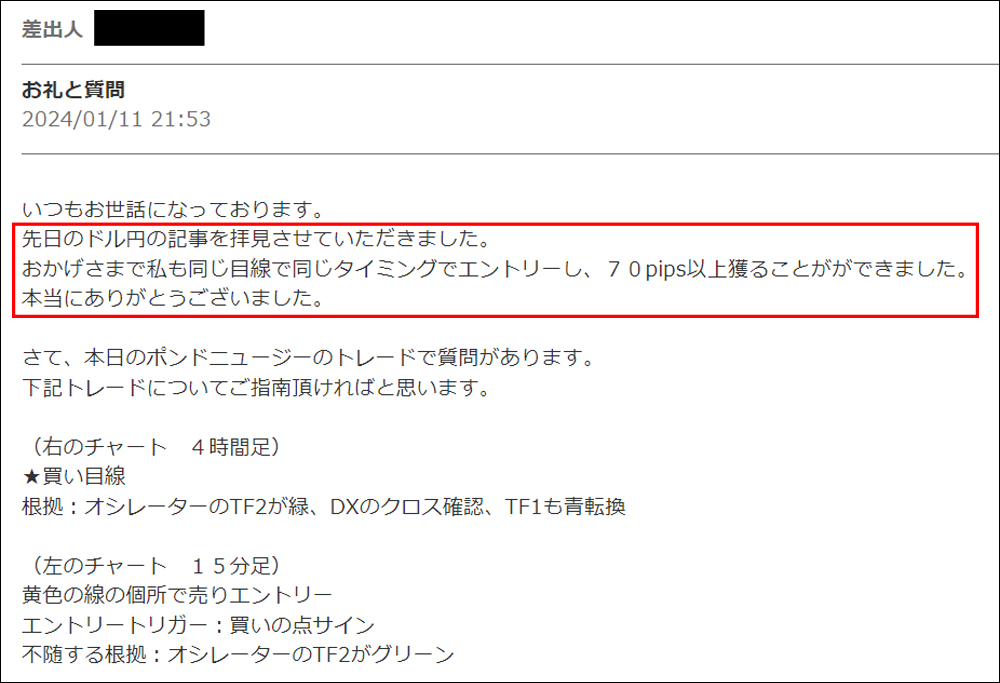
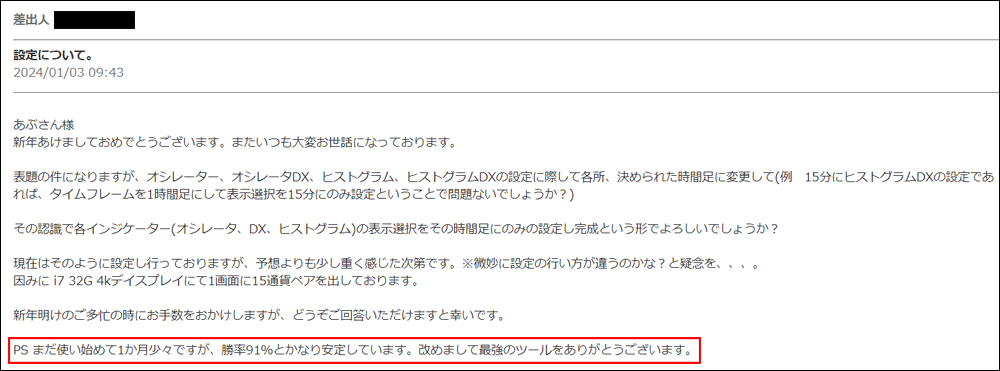
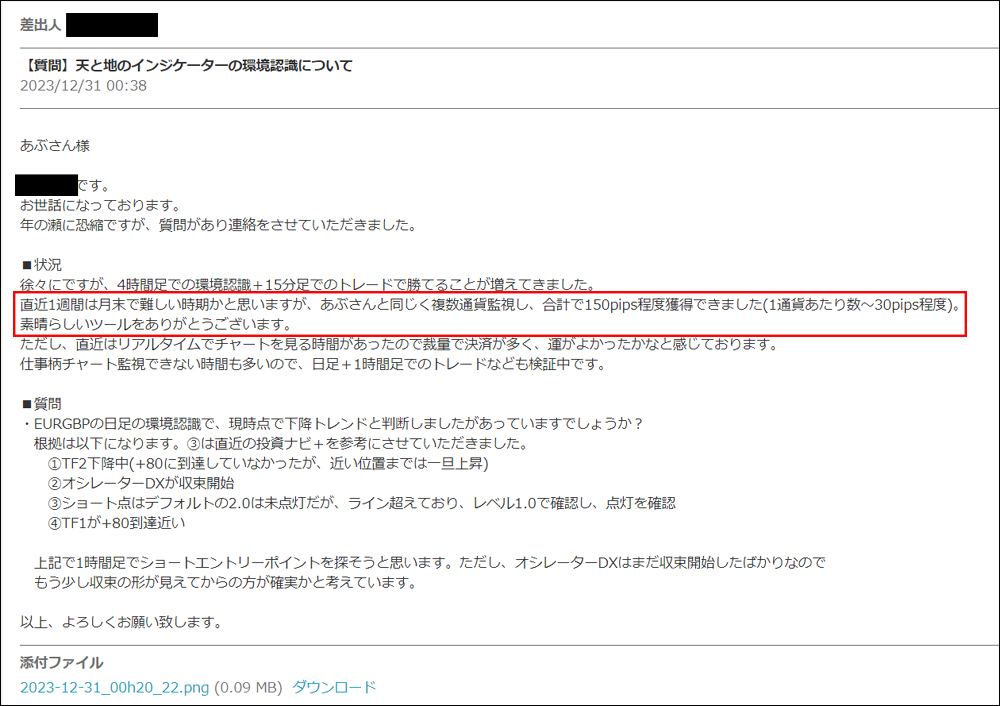
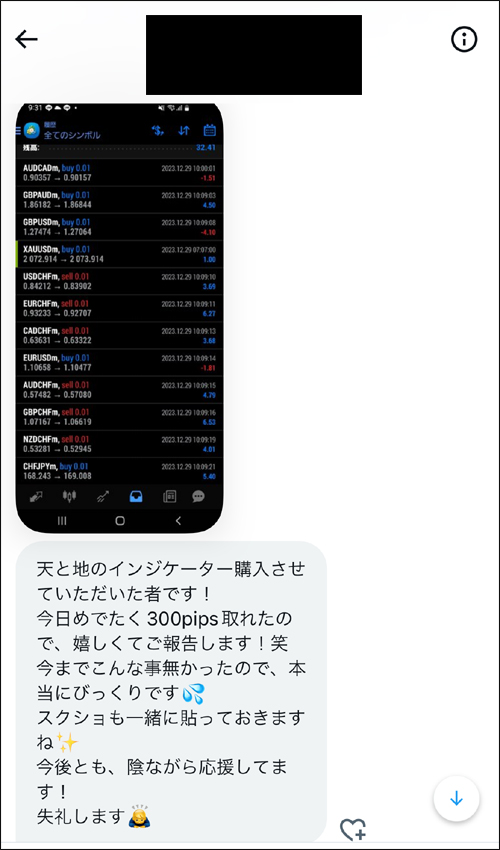
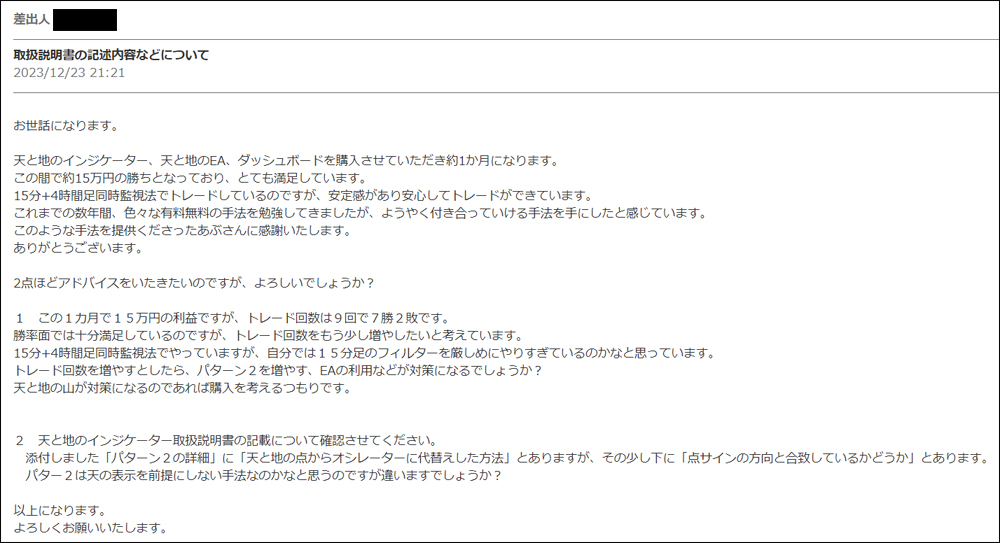
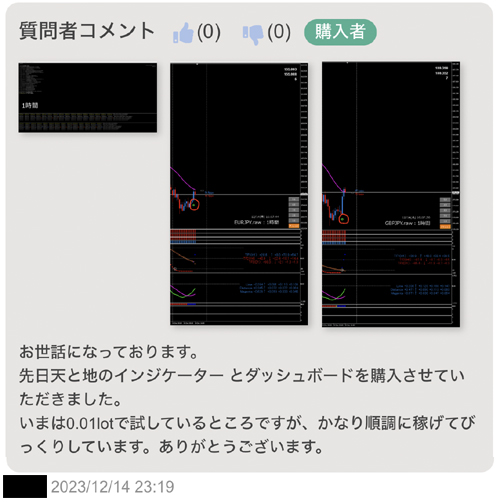
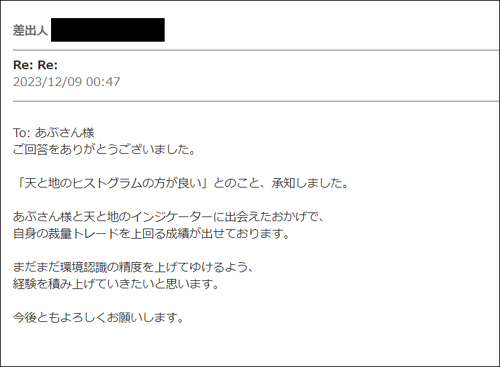
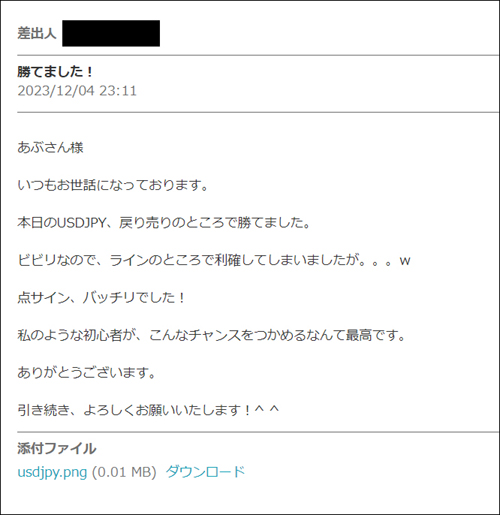
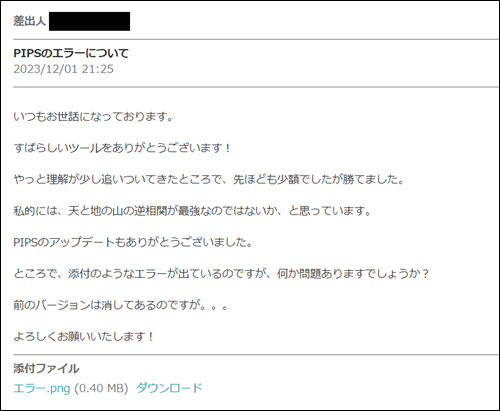
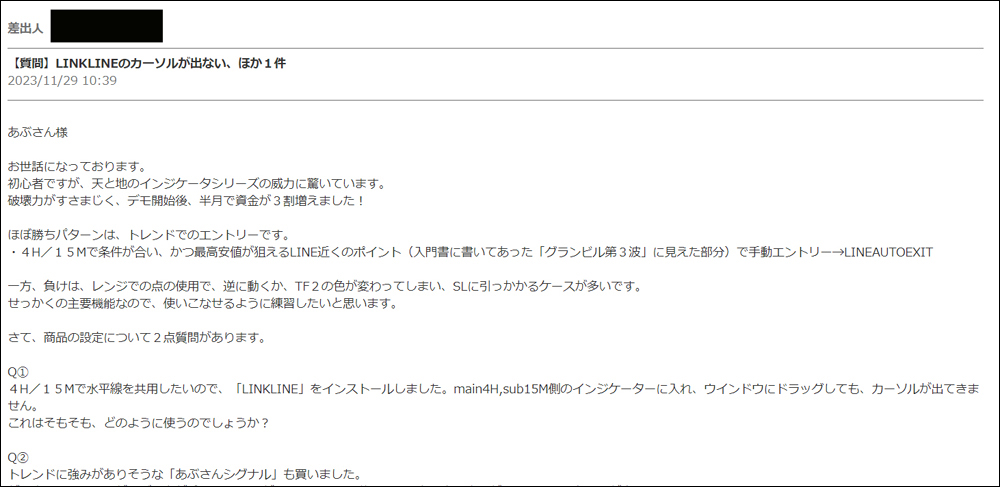
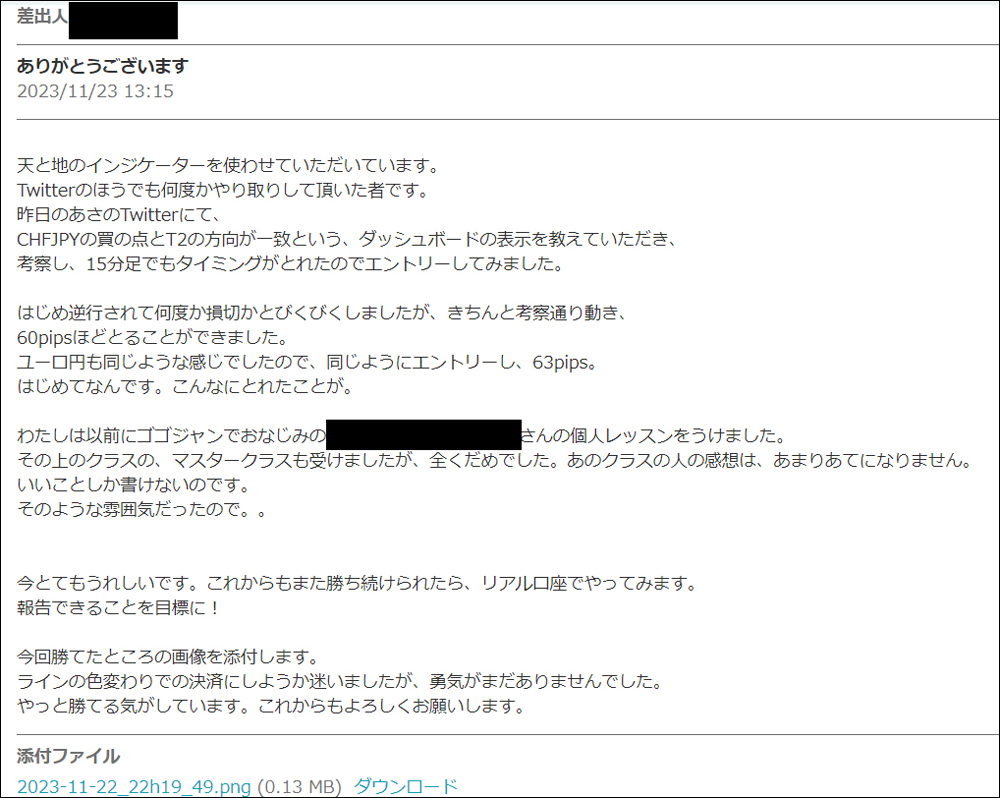
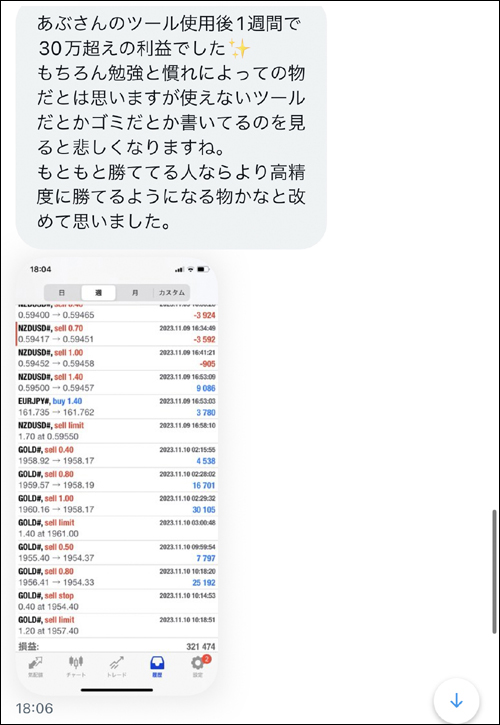
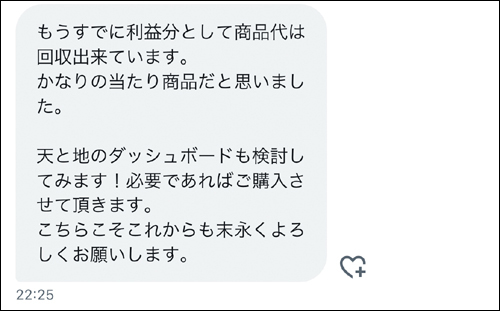
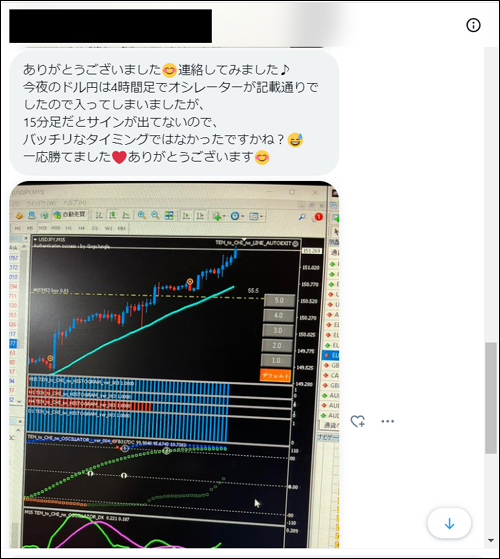
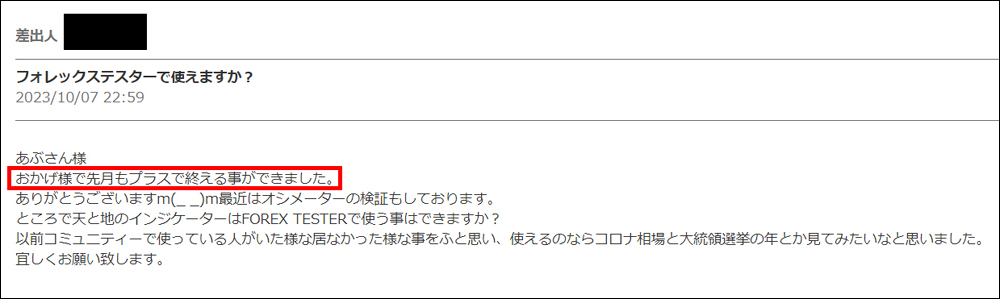
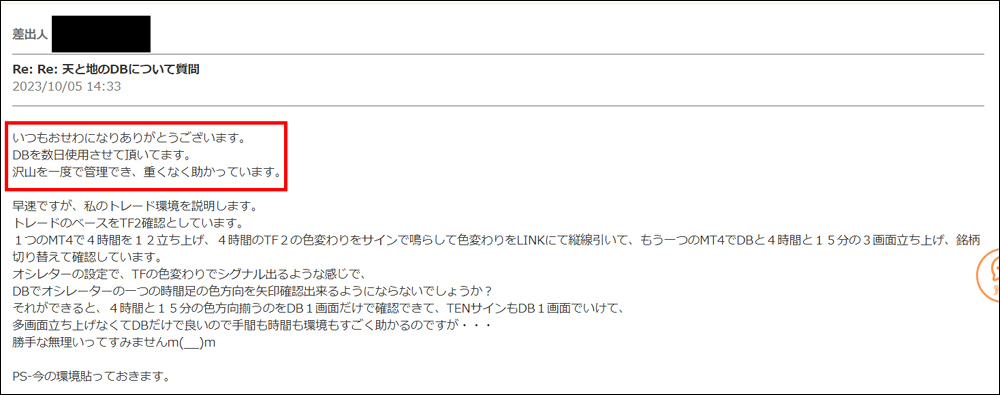
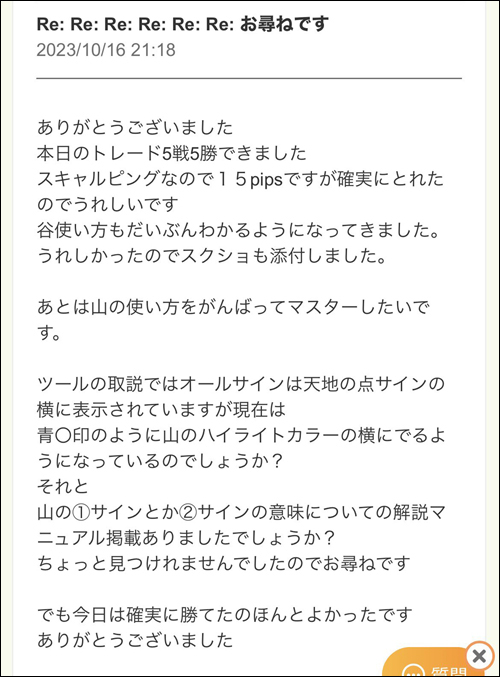
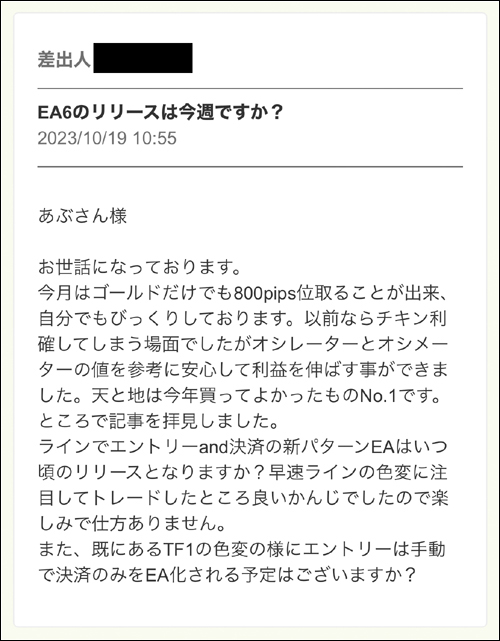
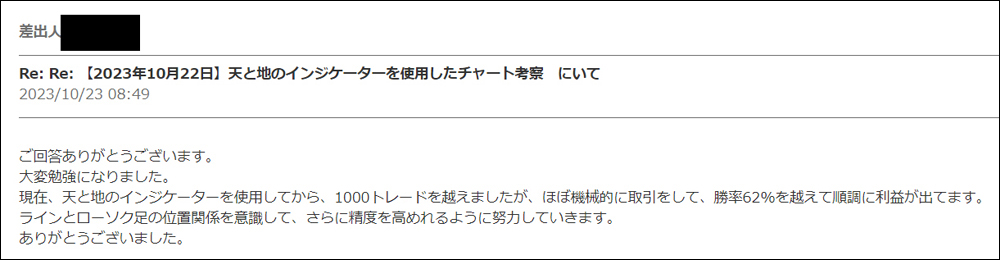
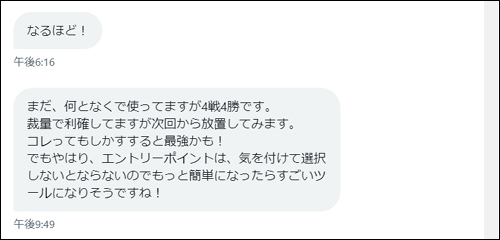
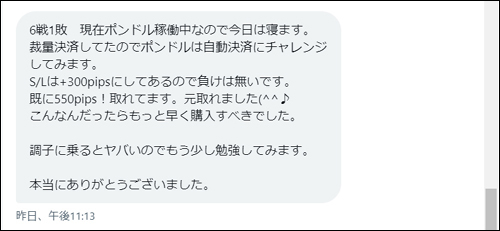
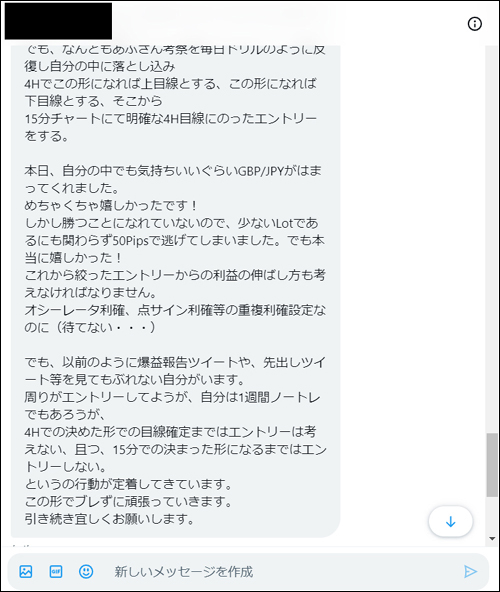
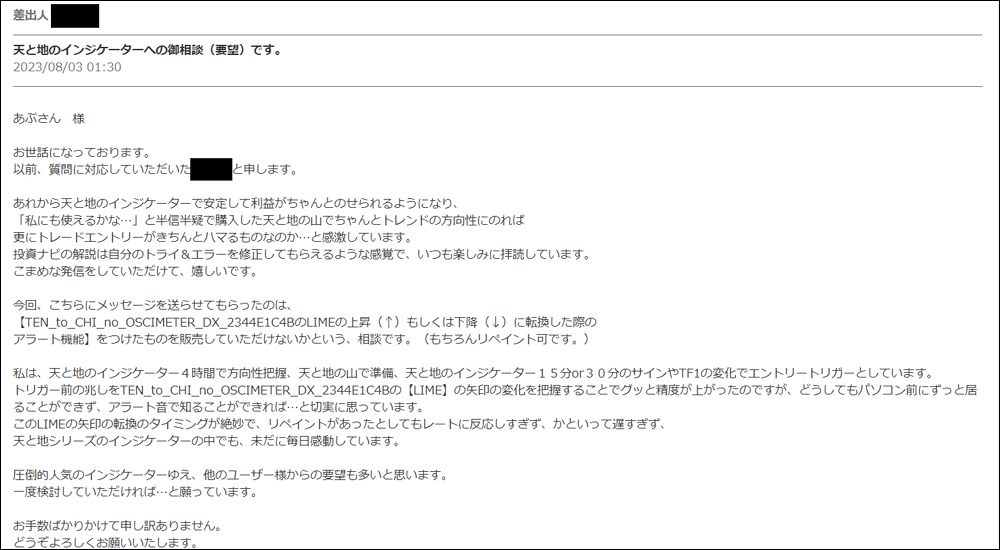
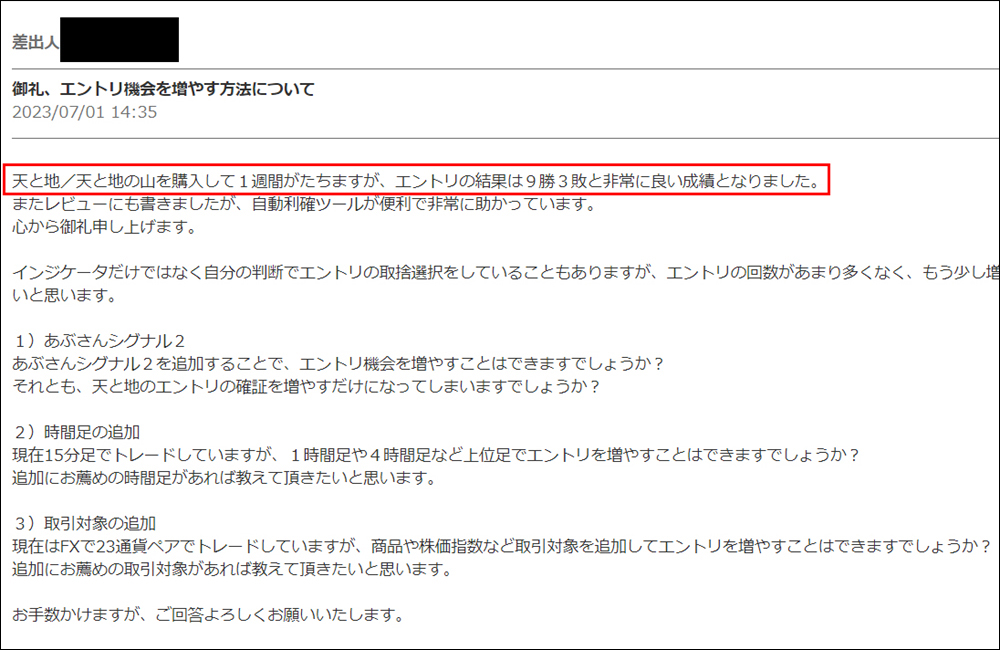
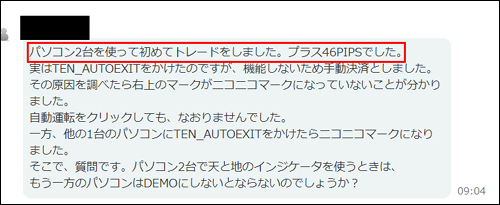
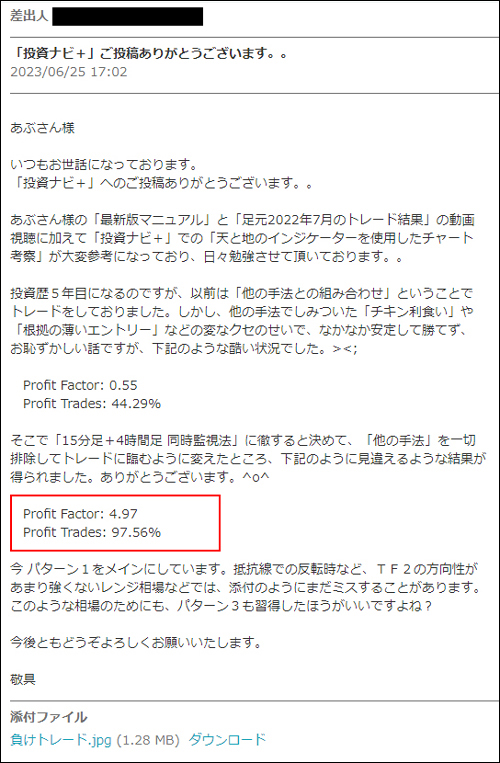
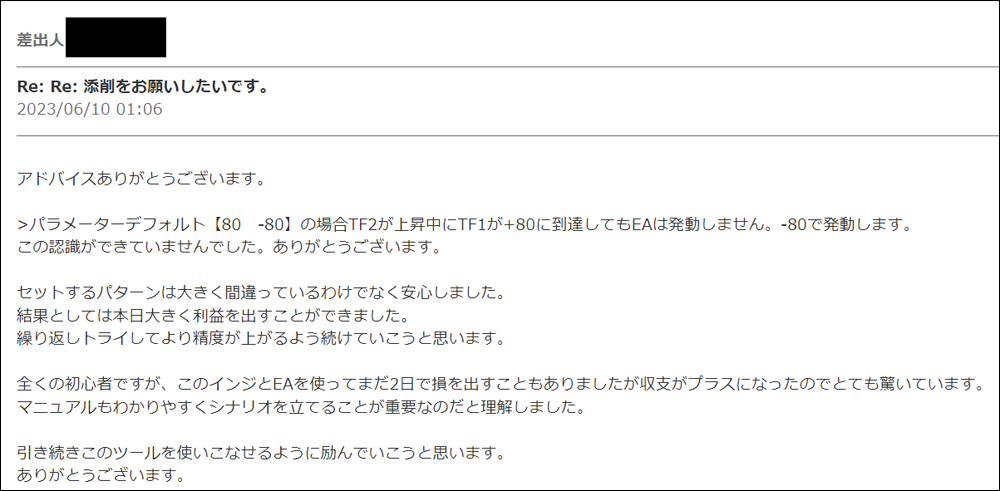
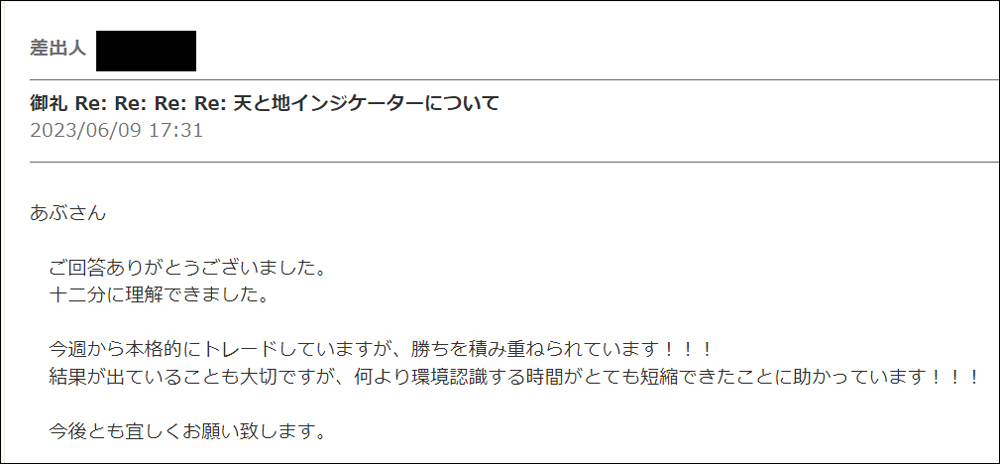
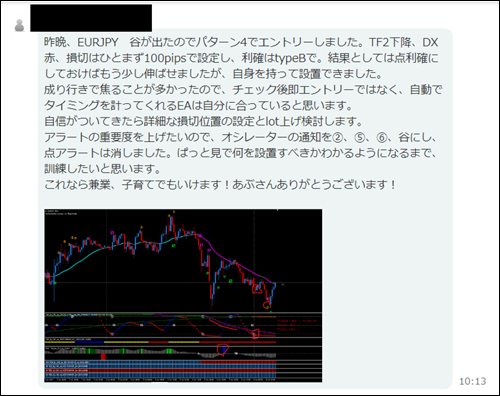
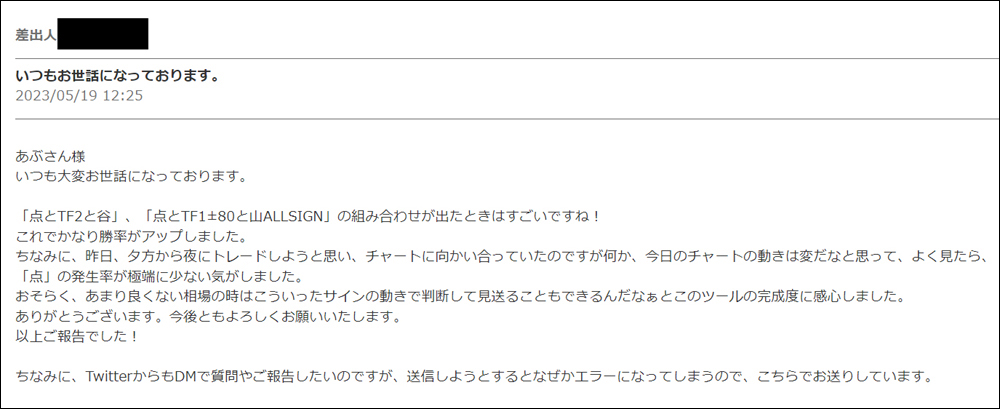
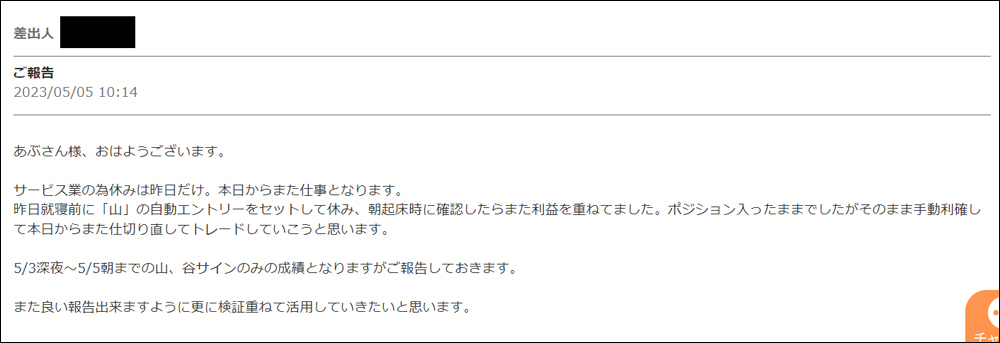
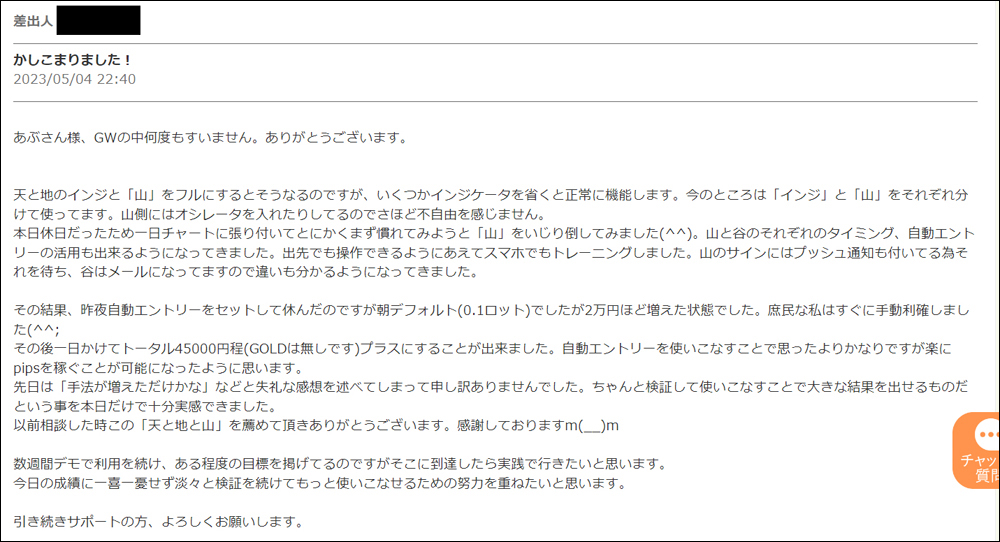
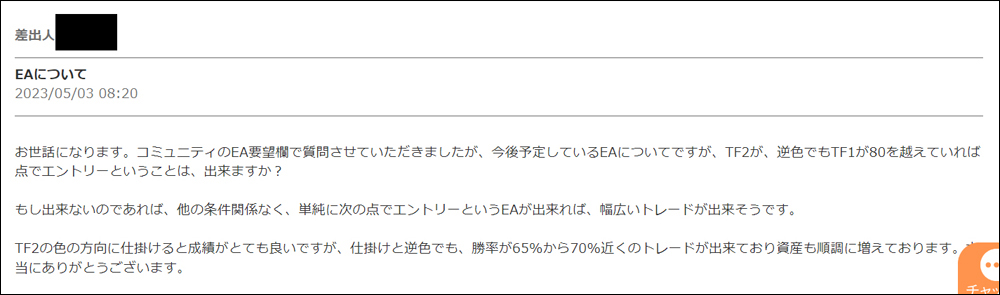
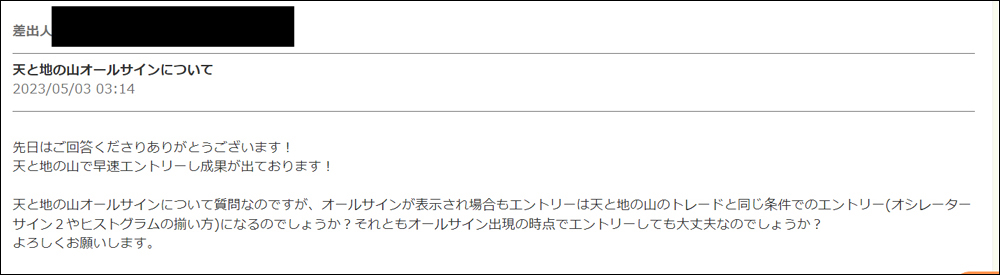
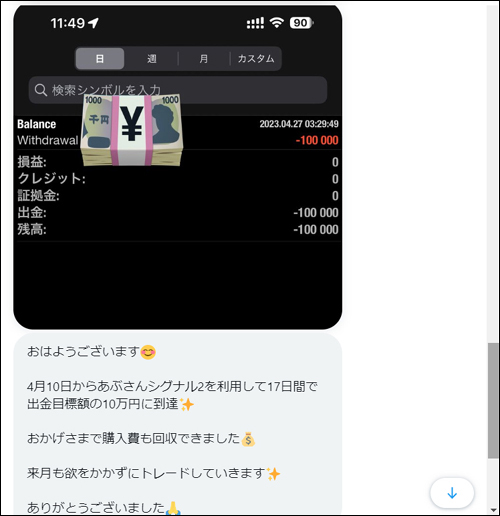
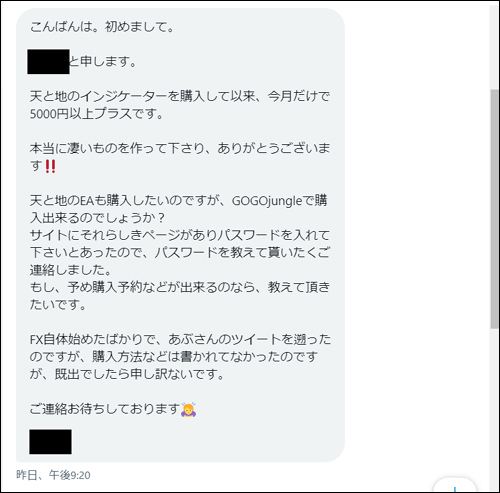
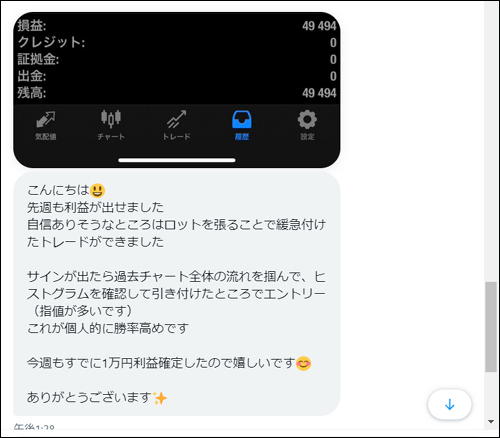
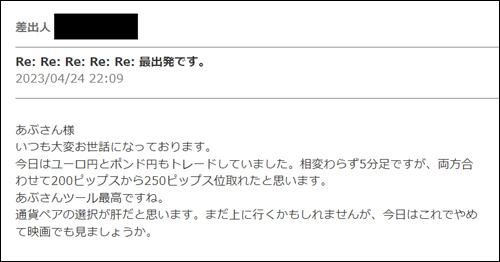
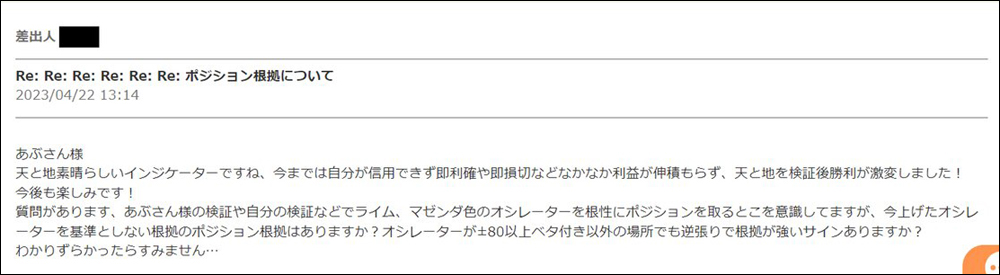
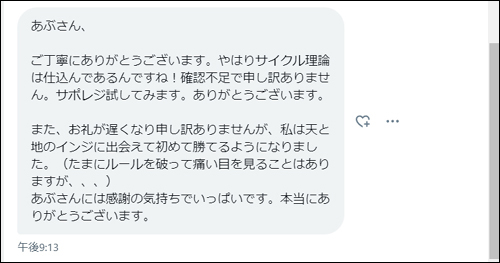
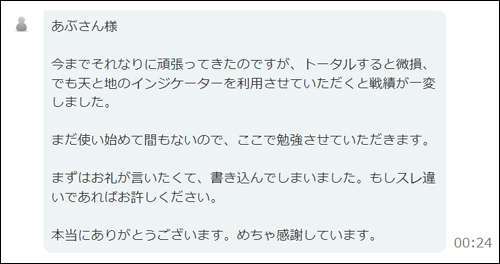
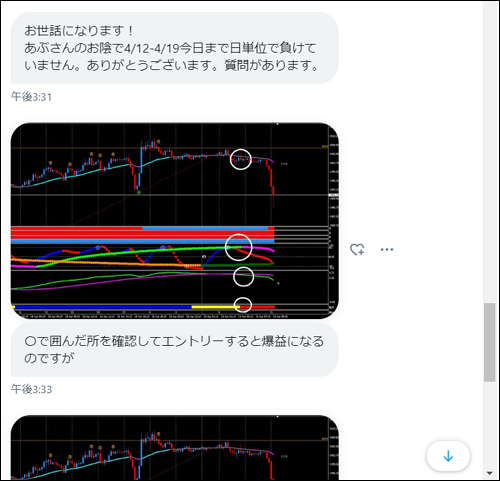
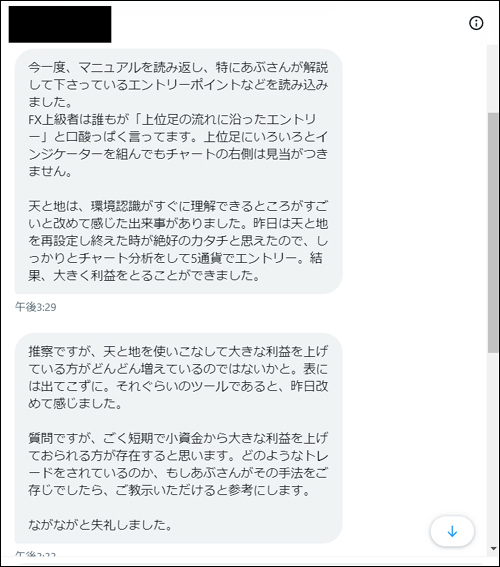
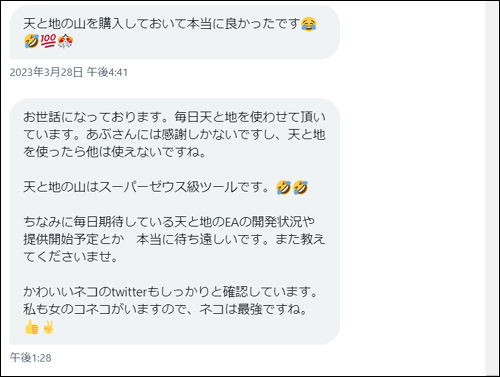
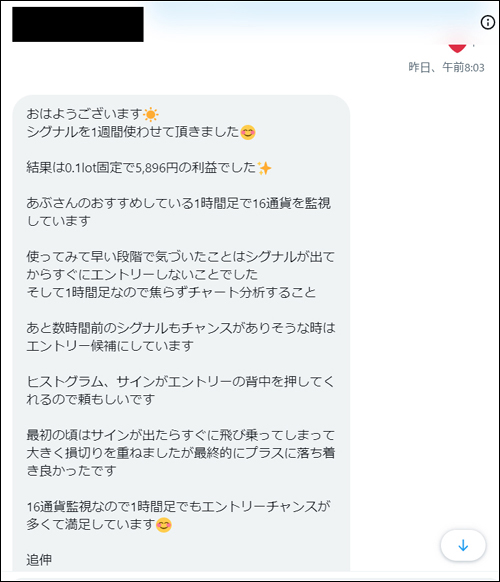
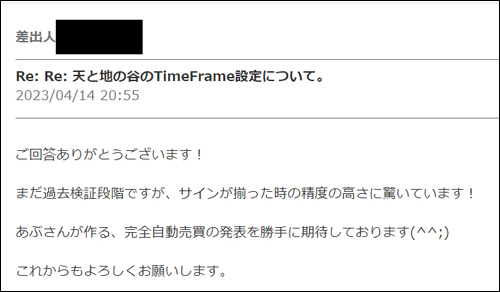
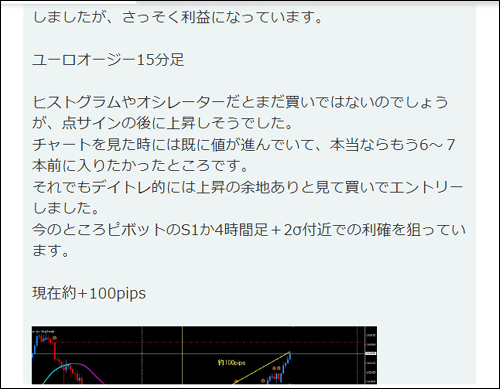
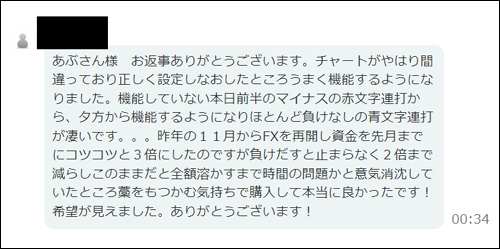
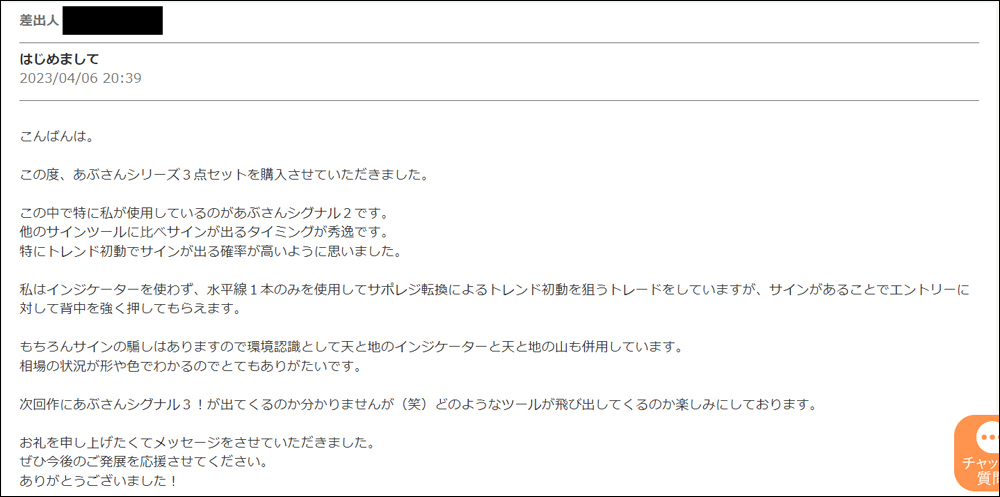
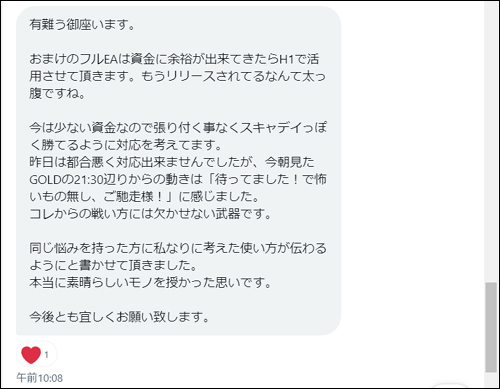
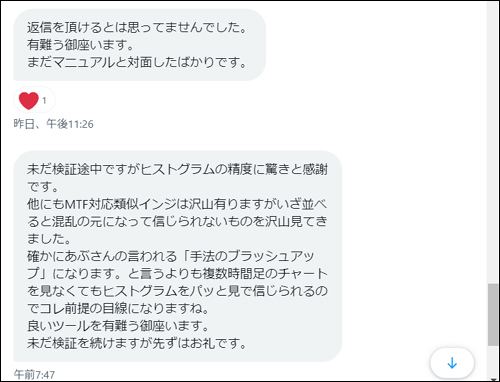
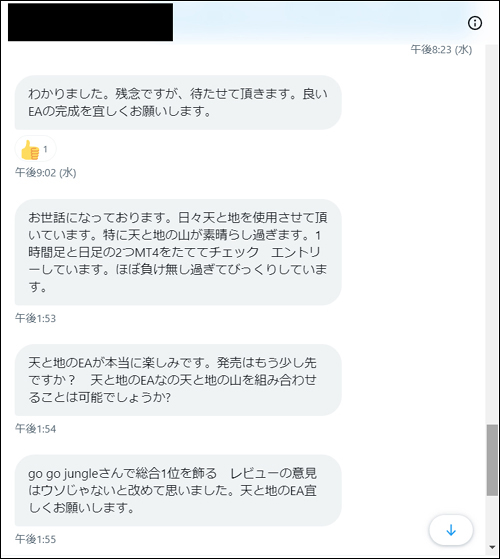


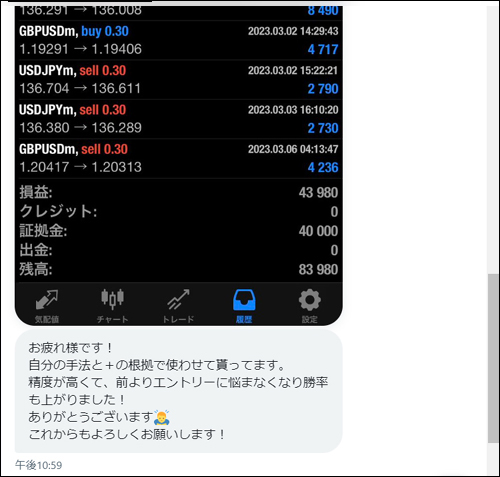
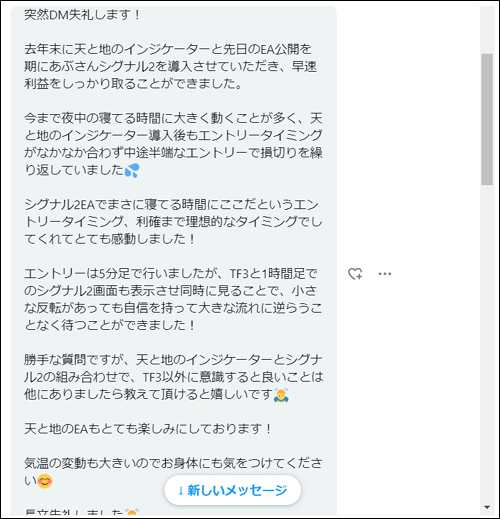
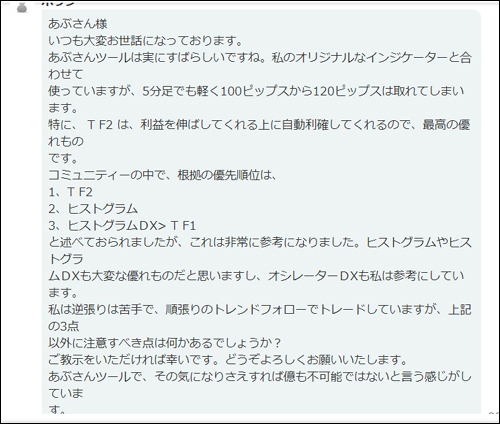
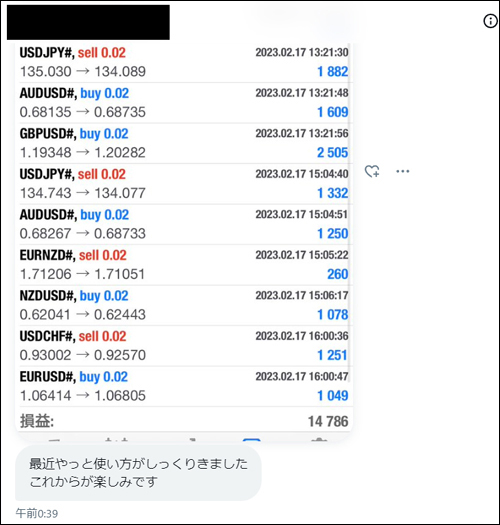
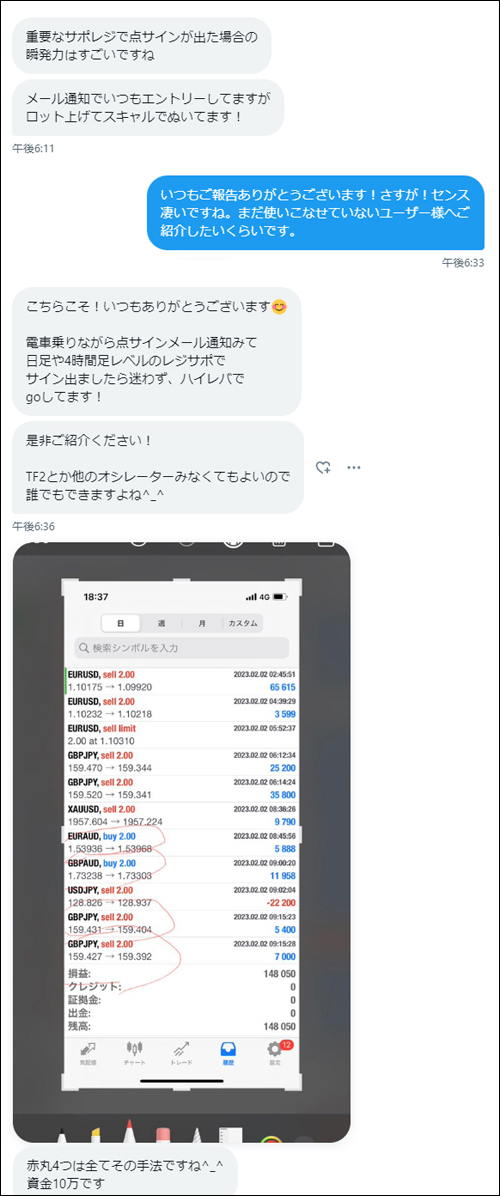
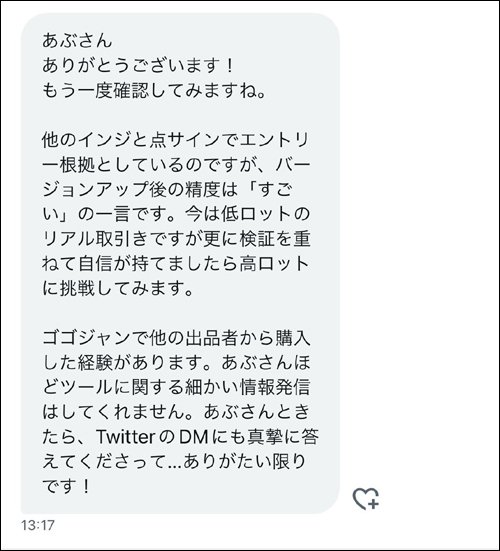
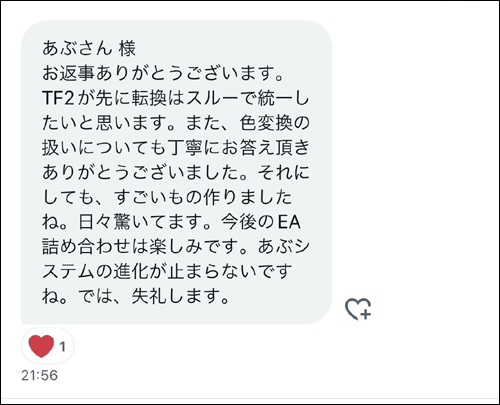
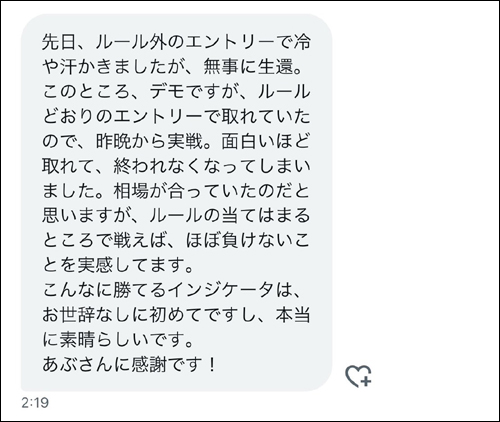
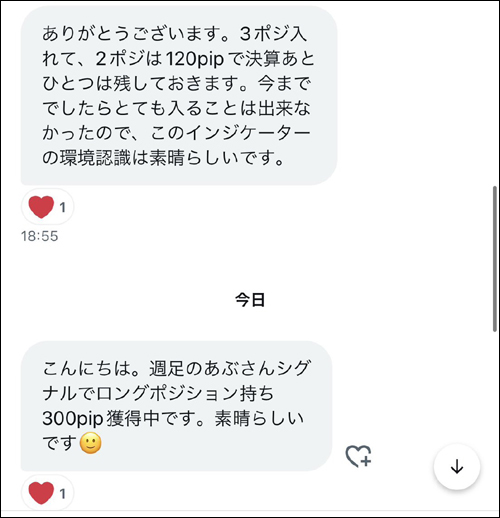
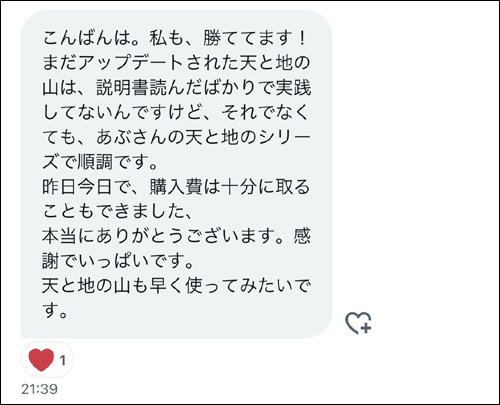
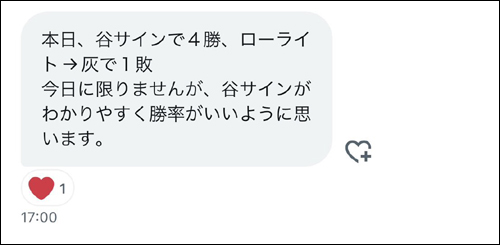
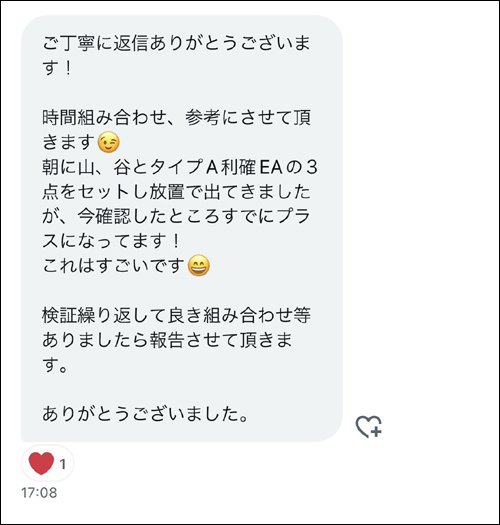
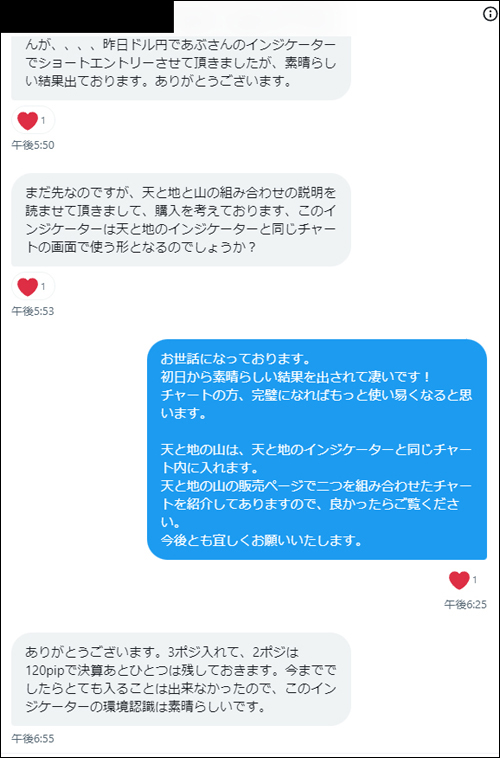
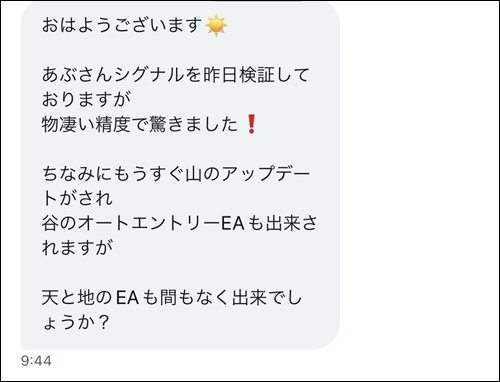
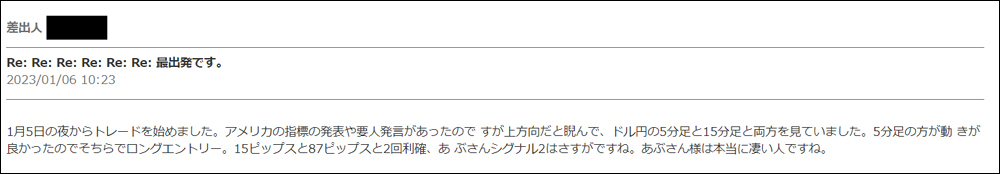
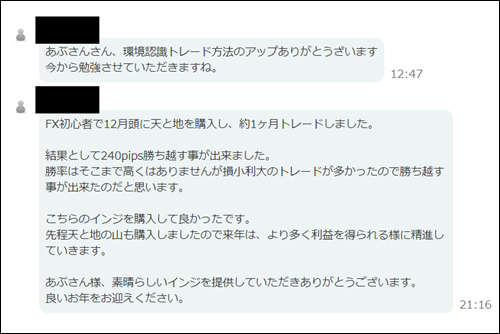
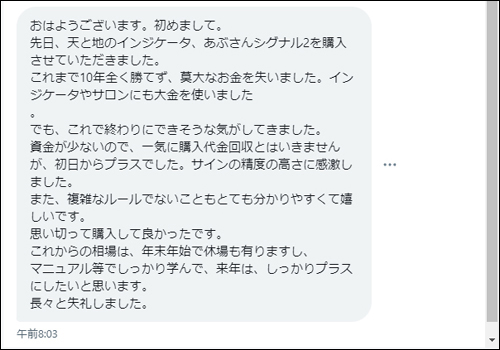
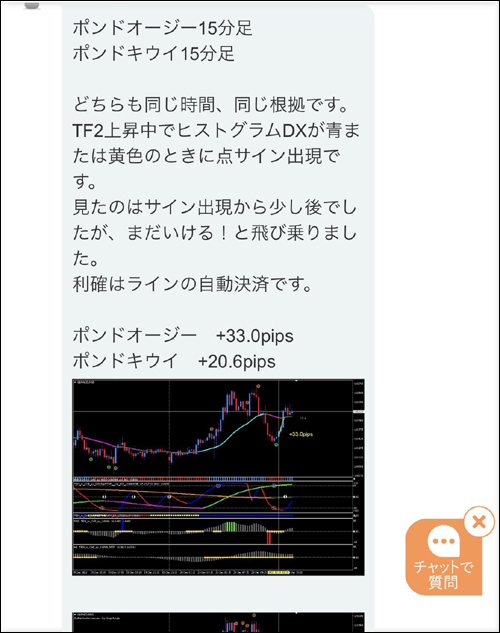
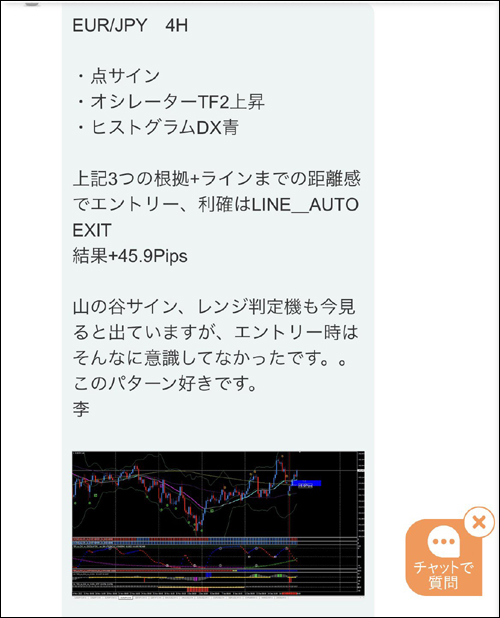
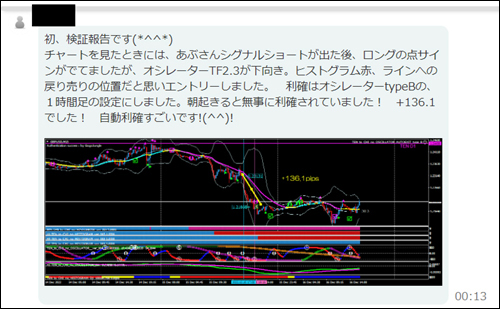
・In the articles linked below, we introduce valuable DMs, reviews, posts, etc. from users and monitors. We carefully select winning reports and other useful messages, so I’m sure it will be helpful to everyone. We update it continuously, so please read it when you have time.
・Impressions from users who actually used the Tenshi-to-Chi indicator (review version)
・Impressions from users who actually used the Tenshi-to-Chi indicator (DM version)
・“I searched for #Tenshi-to-Chi Indicator”
・We introduce monitor posts from those who actually used Tenshi-to-Chi Day Swing
・Impressions from users who actually used Tenshi-to-Chi Day Swing

・Tenshi-to-Chi Indicator is a trading method using an original indicator developed by me, Abusan, released in February 2022.Thanks to everyone's support,“GogoJungle Award 2022, 2023, 2024 has been awarded for three consecutive years.
・In this article,“Tenshi-to-Chi Indicator” is used to validate and discuss the“Tenshi-to-Chi Day Swing” as the method being examined. For the basic trading method of the Tenshi-to-Chi Indicator, please refer to the article before August 2024.【Limited to 20 sets】Tenshi-to-Chi Full Set Details ↓https://www.gogojungle.co.jp/tools/ebooks/59349※Regarding the specialized terms used in this blog, please refer to the image below. (All images can be enlarged by clicking)EURJPY / 1-hour chart + 4-hour chart + daily chart backtest※ Yellow dotted lines are drawn at all timeframes in the same places.※ Yellow circles indicate important points.Click the chart to enlarge.■ 1-hour chart (left: entry chart) Entry・Line touch entry・Oscillator TF2 (upward)・Histogram DX, DX2 (upward) ※ 4 hours■ 4-hour chart (center: market context chart) ※ yellow circle areas・Oscillator TF2 (upward)・Oscillator DX (upward cross) ※ current・Histogram DX, DX2 (upward) ※ current・ABUADX (zero-line cross) ※ current・ABUDMI (upward reversal) ※ current■ Daily chart (right: market context chart) ※ yellow circle areas・Oscillator DX (just before upward cross) ※ current・Histogram DX2 (upper: blue) ※ current■ SummarySince multiple good patterns appeared on the 4-hour chart (yellow dotted areas), I will search for long entry points on the 1-hour chart. Even in a volatile market like this, the indicators on the 1-hour chart are in favorable states, so I can trust the upside. If my view is wrong, I can reset the view by changes in the 1-hour indicators, so there is no big loss (e.g., reset when Oscillator TF2 turns downward).■ If using DSATEASince I determined an uptrend in the yellow dashed area, I will set DSATEA to long-only on the 1-hour chart. With a good pattern on the 4-hour chart, set the 1-hour Oscillator DX and Histogram DX2 filters to 4 hours to avoid being swayed by retracements.==========================================If I were to set DSATEA for this market, I would configure the parameters as follows for your reference.==========================================I hope this is helpful to everyone.If you could press the GOOD mark, it would provide motivation for future efforts. Thank you for your continued support and cooperation in raising our motivation.


【Limited to 20 sets】Tenshi-to-Chi Full Set Details ↓


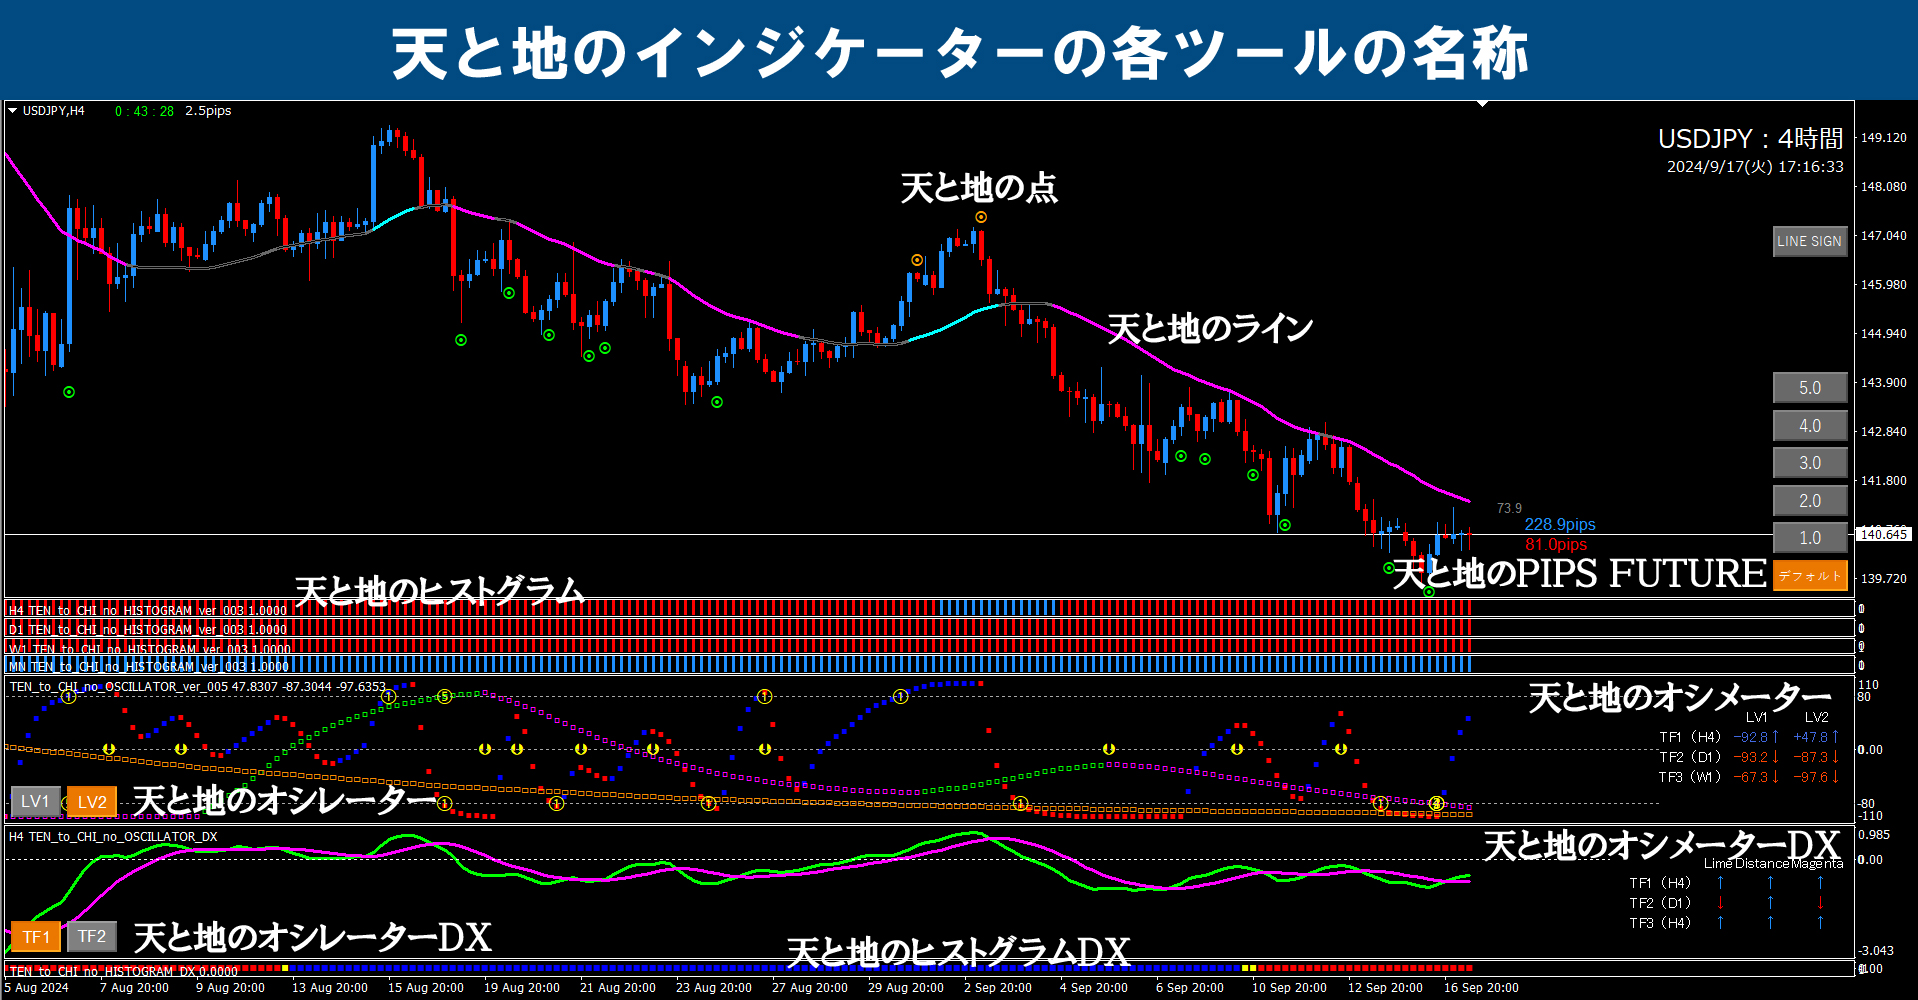
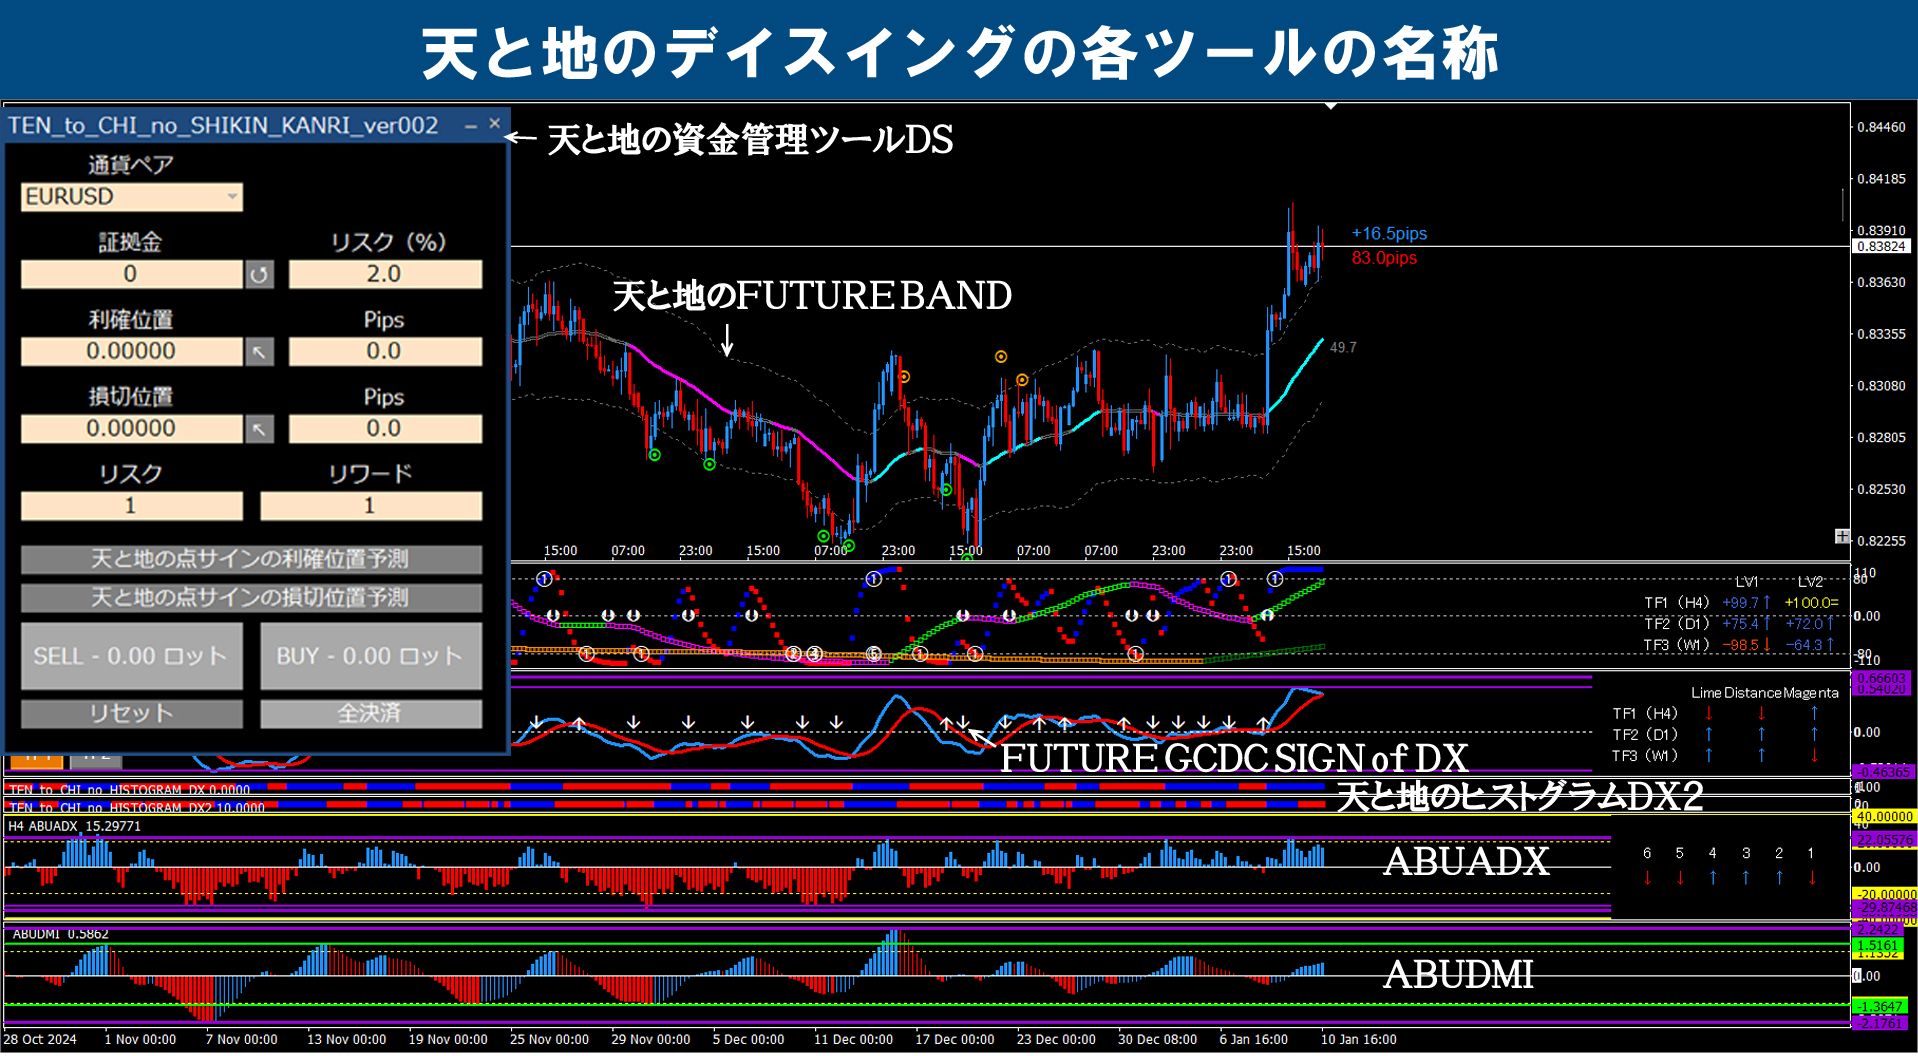
※Regarding the specialized terms used in this blog, please refer to the image below. (All images can be enlarged by clicking)


EURJPY / 1-hour chart + 4-hour chart + daily chart backtest
※ Yellow dotted lines are drawn at all timeframes in the same places.
※ Yellow circles indicate important points.
Click the chart to enlarge.
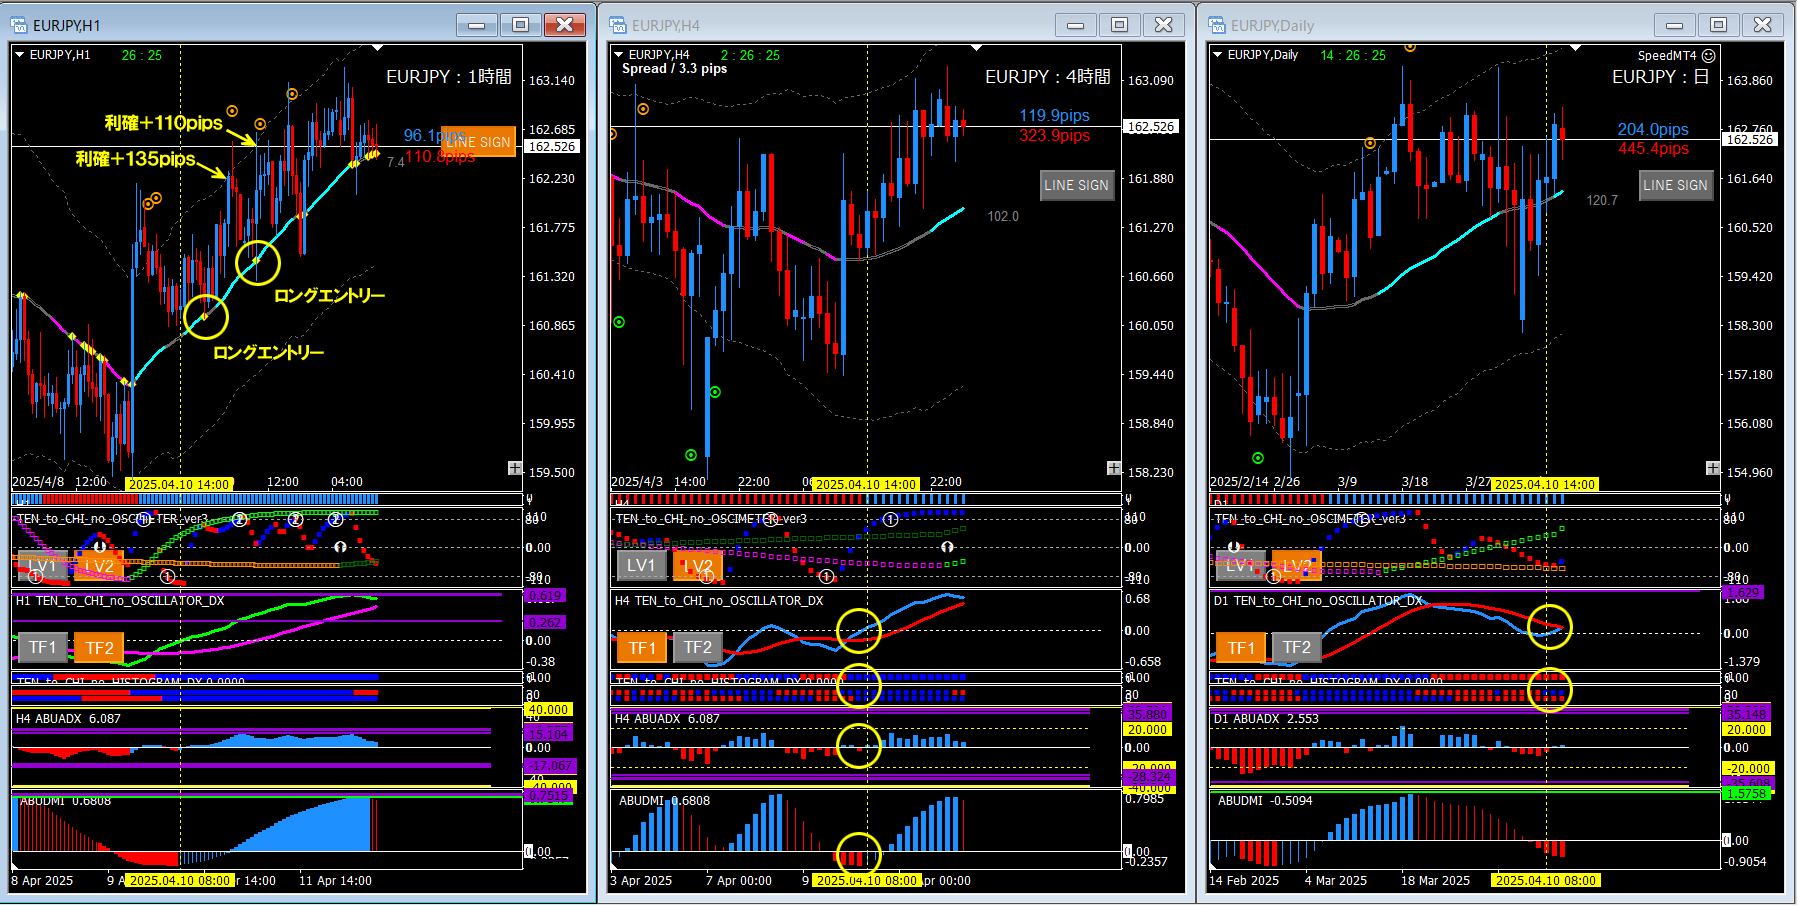
■ 1-hour chart (left: entry chart) Entry
・Line touch entry
・Oscillator TF2 (upward)
・Histogram DX, DX2 (upward) ※ 4 hours
■ 4-hour chart (center: market context chart) ※ yellow circle areas
・Oscillator TF2 (upward)
・Oscillator DX (upward cross) ※ current
・Histogram DX, DX2 (upward) ※ current
・ABUADX (zero-line cross) ※ current
・ABUDMI (upward reversal) ※ current
■ Daily chart (right: market context chart) ※ yellow circle areas
・Oscillator DX (just before upward cross) ※ current
・Histogram DX2 (upper: blue) ※ current
■ Summary
Since multiple good patterns appeared on the 4-hour chart (yellow dotted areas), I will search for long entry points on the 1-hour chart. Even in a volatile market like this, the indicators on the 1-hour chart are in favorable states, so I can trust the upside. If my view is wrong, I can reset the view by changes in the 1-hour indicators, so there is no big loss (e.g., reset when Oscillator TF2 turns downward).
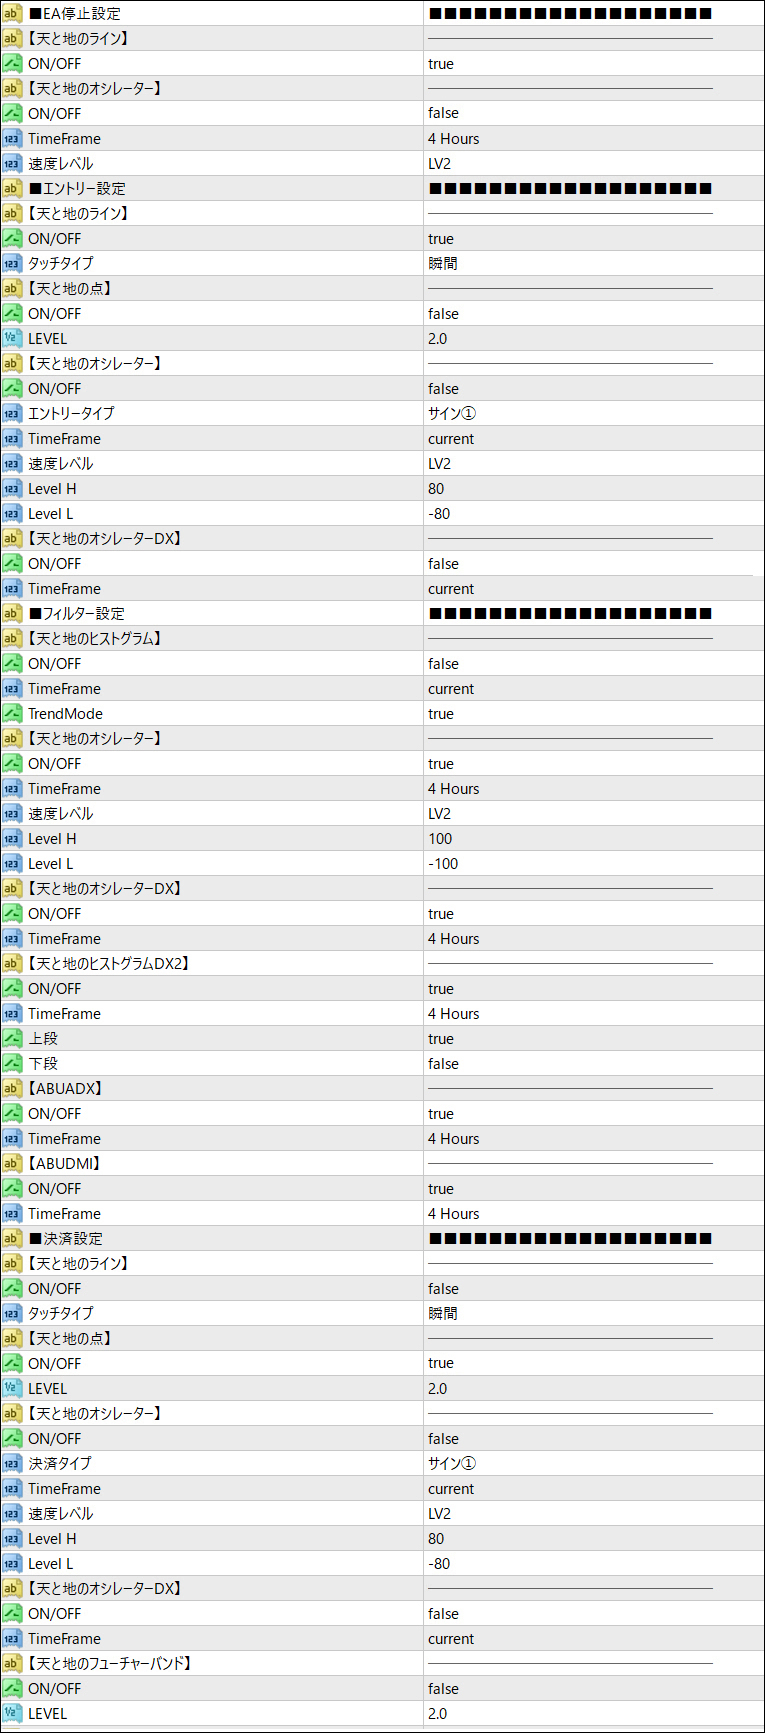
■ If using DSATEA
Since I determined an uptrend in the yellow dashed area, I will set DSATEA to long-only on the 1-hour chart. With a good pattern on the 4-hour chart, set the 1-hour Oscillator DX and Histogram DX2 filters to 4 hours to avoid being swayed by retracements.
==========================================
If I were to set DSATEA for this market, I would configure the parameters as follows for your reference.
==========================================

I hope this is helpful to everyone.
If you could press the GOOD mark, it would provide motivation for future efforts. Thank you for your continued support and cooperation in raising our motivation.
