

Usage of the "Visualization Indicator" (Part 194)
Utilization of the "Visualization Indicator" (its194)
1. Developing the "28 Currency Pairs List Indicator" further into a visualization indicator
“8CPVisualization Indicator”to drawEURUSD.
The “8CPVisualization Indicator” includesOceania version,London version,NewYork version,AnyCP version. This time, theLondon version was used.
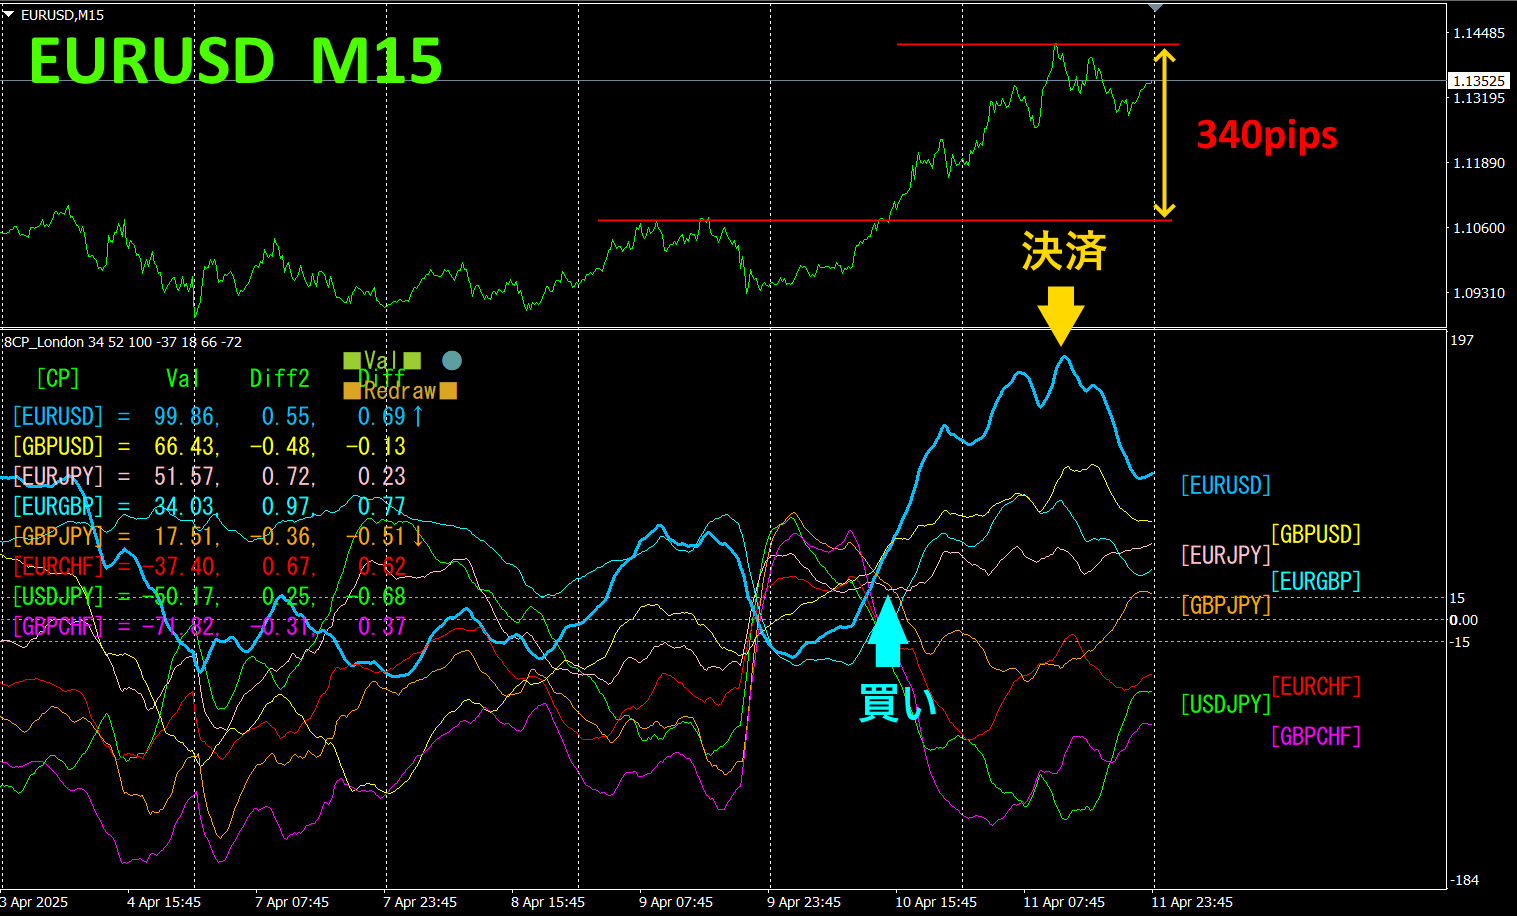
The upper half is the 15-minute chart of EURUSD. The lower half is from the “8CPVisualization Indicator.” The light blue thick line graph corresponds to EURUSD.
There was a buying opportunity on Thursday. The point where the indicator’s graph group broke upward and the most recent high exceeded occurred at the same spot. Buy here and exit at the chart's peak. Approximately340pips of profit was made. The idea of “taking profits only when a trend is present” provides sufficient profit.
If you use “TrendLine-EX,” you can automate entry and exit by breaking the diagonal trend line. It can be left as is for easy trading. “TrendLine-EX is a semi-automatic EA that can automatically sell when the trend line breaks below and automatically exit when it breaks above.
2. Best SelectTry the Indicator
The following figure is a screenshot taken onApril 9, 2025 03:15 (JST).
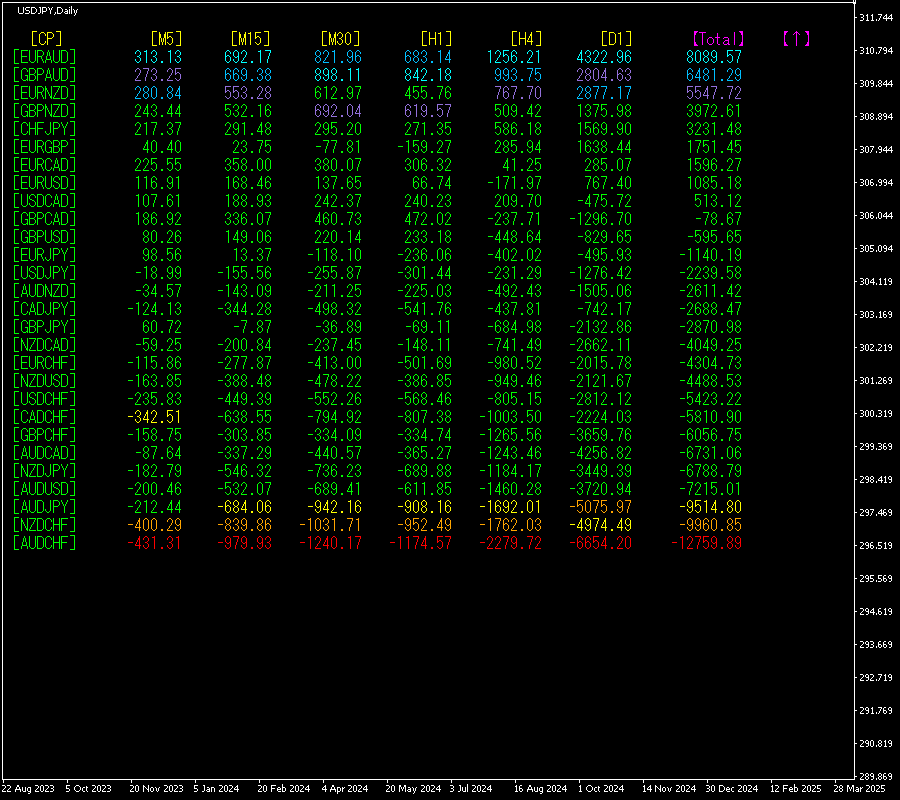
[Total]The numbers are arranged in descending order. At the very bottom,AUDCHF appears in red across all timeframes.Total value is-12759.89, indicating a large negative figure. This suggests a strong downtrend forAUDCHF.
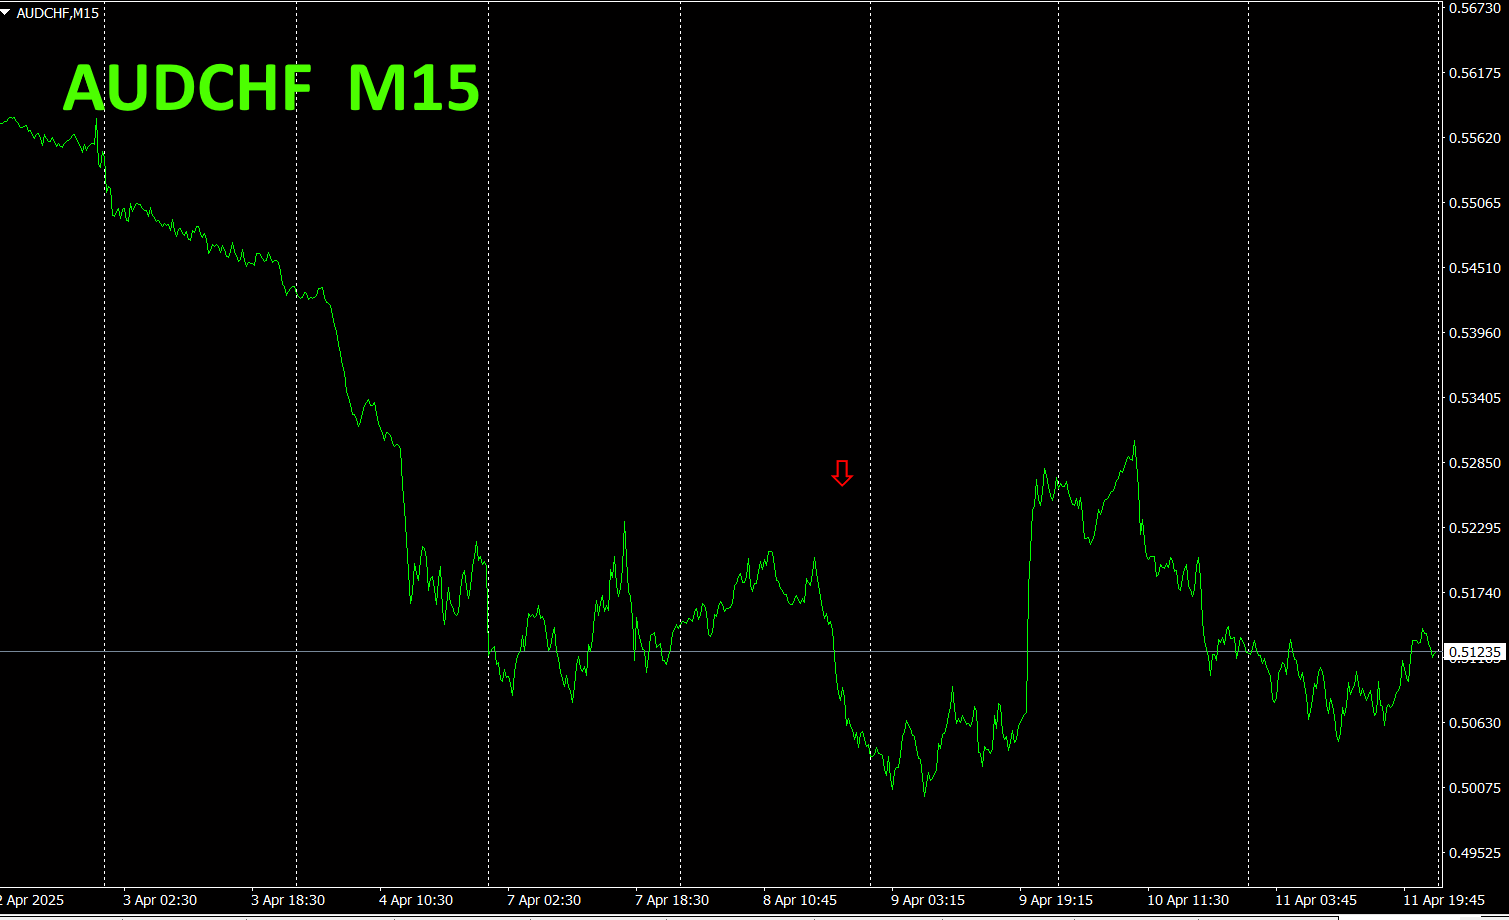
Next, let's look at theAUDCHF chart.
The red arrows indicate the points where the screenshot was taken. It captures the moment of a sharp drop during a downtrend.
“28 currency pairsBest Select indicator” can easily identify which currency among the 28 pairs is exhibiting the strongest trend. It also tells you, with numbers and colors, whether you should trade now. It’s an excellent indicator for assessing all currency pairs at a glance.
“28 currency pairsBest Select

https://www.gogojungle.co.jp/tools/indicators/35128
3. 2021年5月から追っているEURJPYの動きはどうなった?
Since2021 year 5 EURJPY has been tracked.
To see the overall trend, the last approximately30 minutes are drawn for about the last3 weeks.
Last time I wrote the following.
Pink isEUR, green isJPY. In the currency strength chart, bothJPY andEUR are slightly downward, but the angle isEUR>JPY. Therefore, EURJPY is expected to move slightly upward.
As predicted, it has tended to rise slightly.
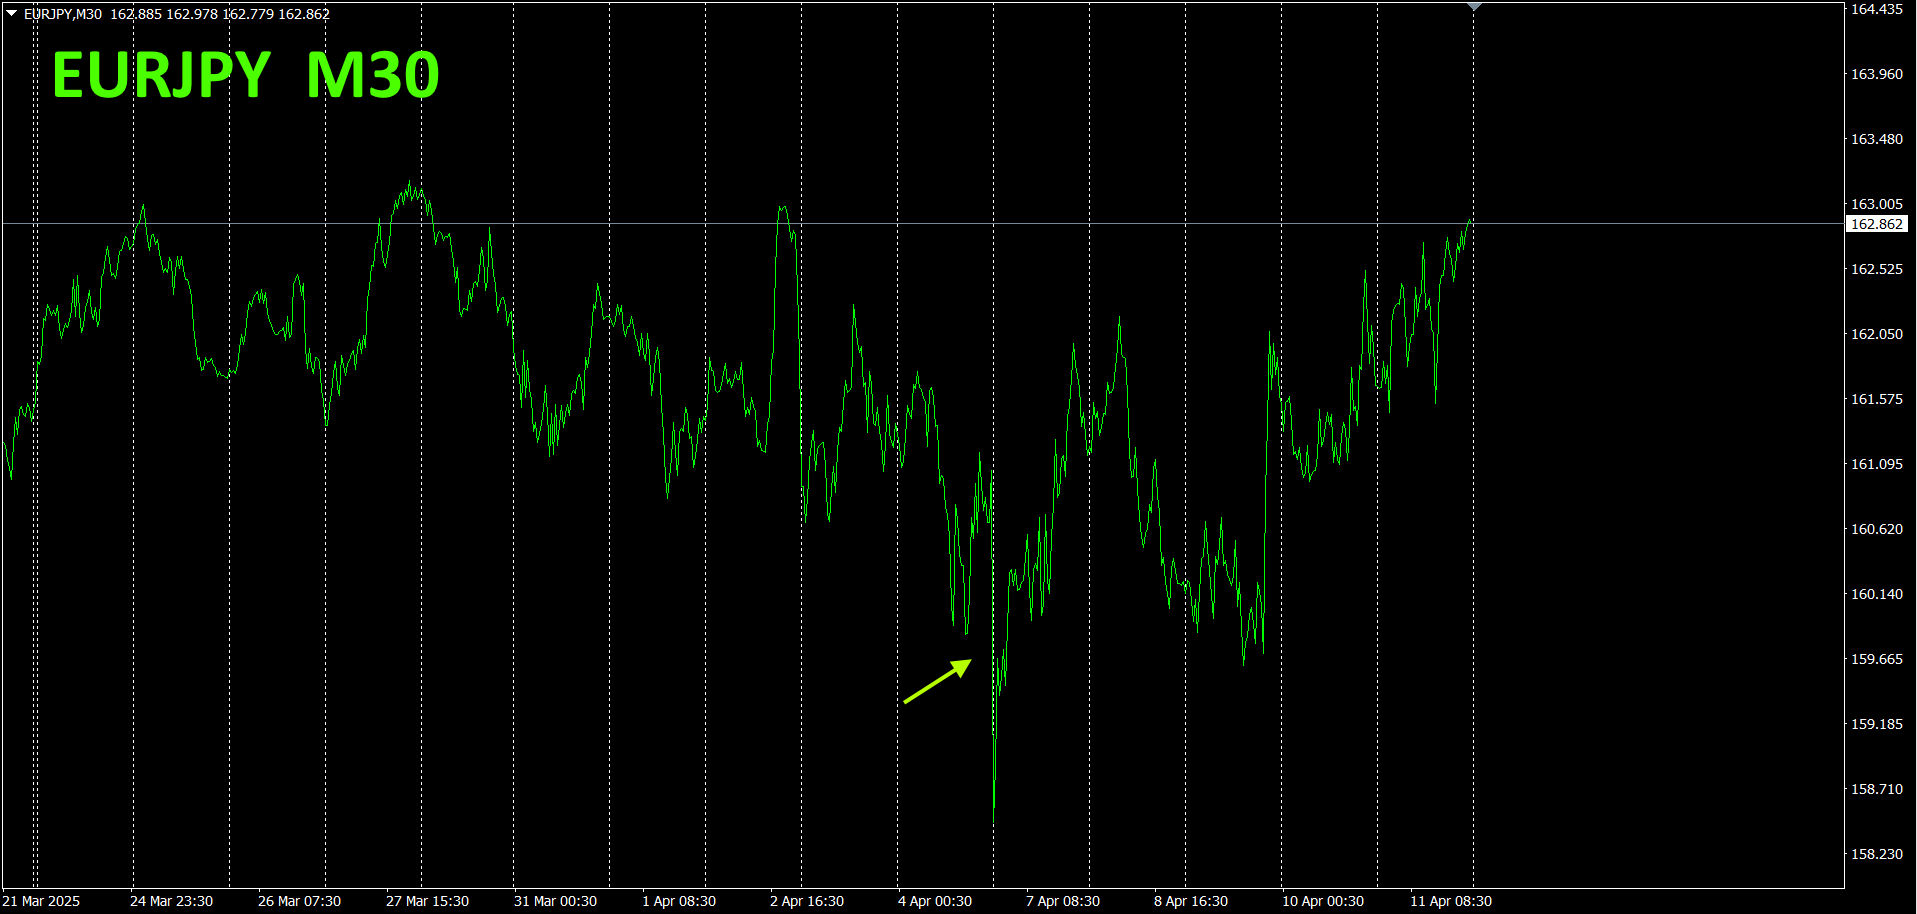
30 minutes of currency strength chart.
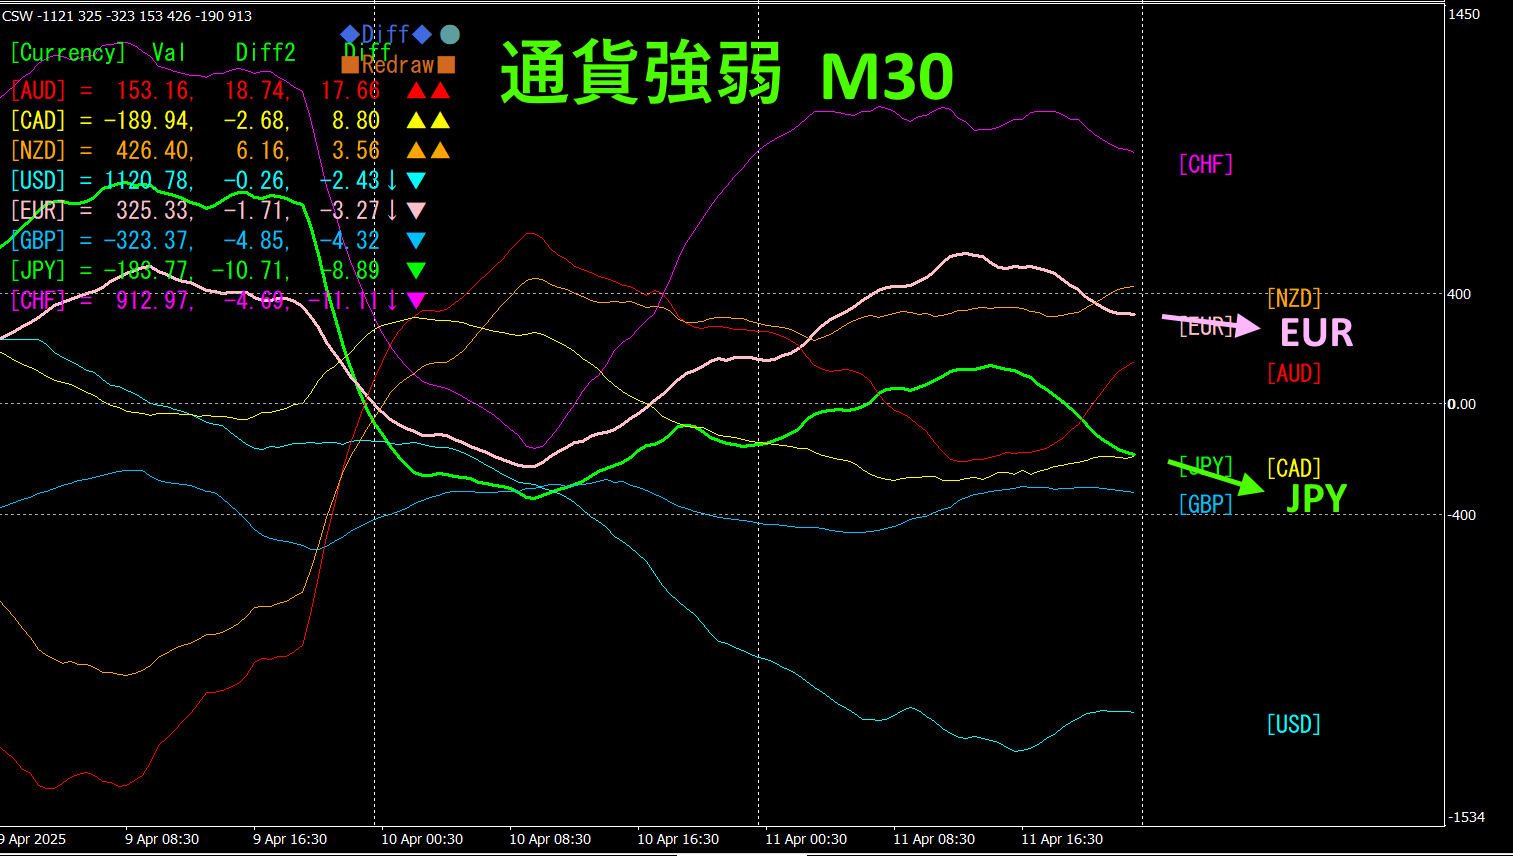
Pink isEUR, green isJPY. In the currency strength chart, both andEUR are slightly downward, butJPY faces a greater downward tilt.EURJPY
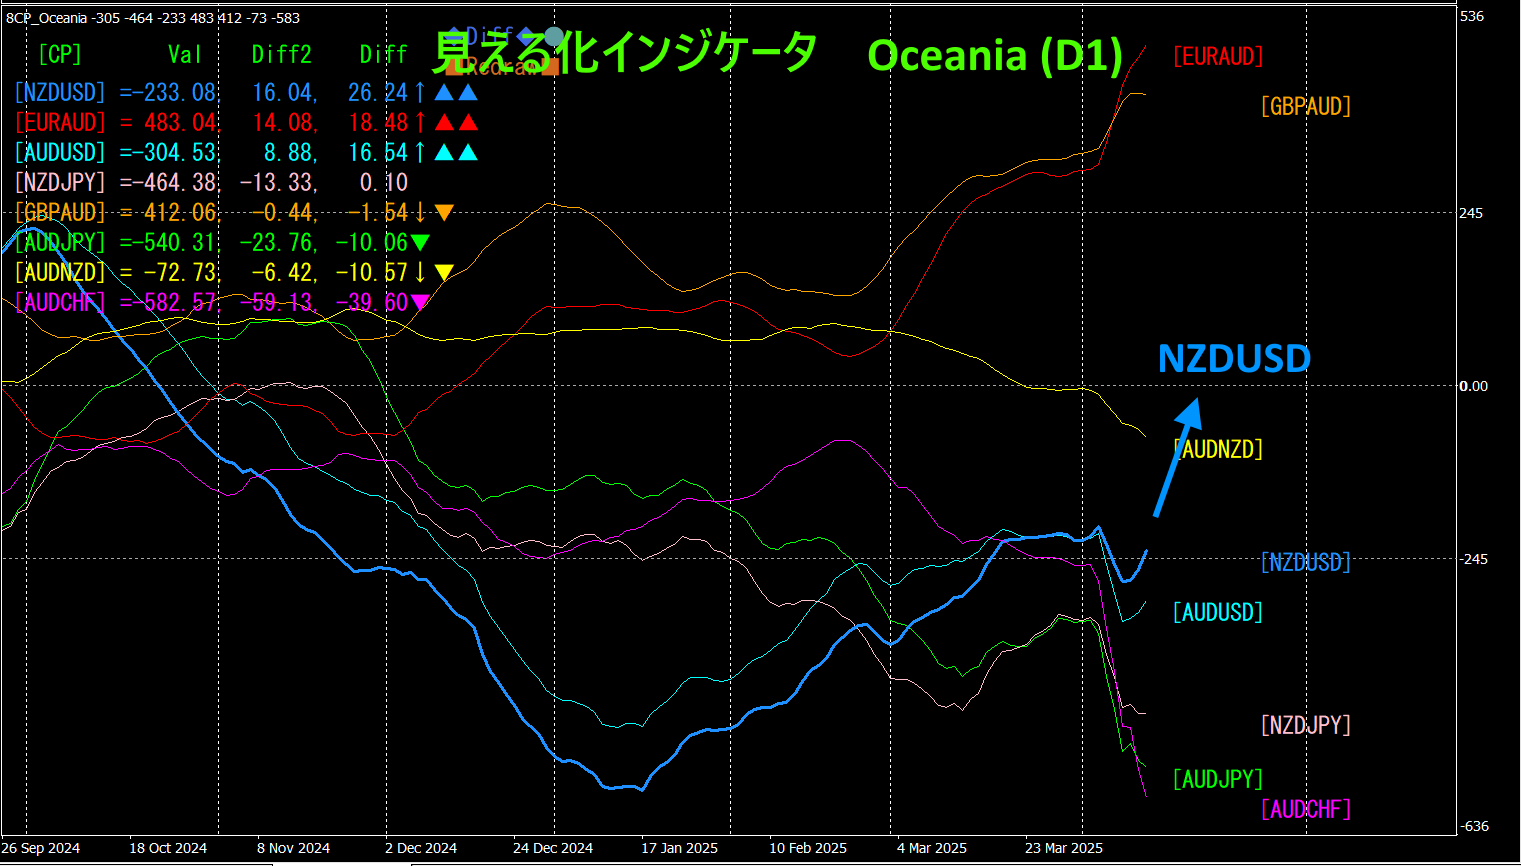
4. Using Visualization Indicators on a daily chart
The figure below displays the “8CP Visualization Indicator” Oceania version on a daily chart.
NZDUSD shows a pullback on the daily basis and has begun to reverse upward. Buying from here should yield good results.
Recommended indicators
“Toretore Indicator”
https://www.gogojungle.co.jp/tools/indicators/50115
“TrendLine-EX”
https://www.gogojungle.co.jp/tools/indicators/42257

“8C Currency Strength Visualization Indicator” is described on the following page.

MT4 version https://www.gogojungle.co.jp/tools/indicators/39150
version https://www.gogojungle.co.jp/tools/indicators/39159
【My listed products】


