

In the end, sold at the top

Get 3000 yen, 4000 yen, and 5000 yen coupons and shop smartly!!

Please find it useful for your own trading activities.
■■■■■■■■■■■■■■■■■■
Good morning everyone.
Yesterday's USD/JPY moved back to the top after the tariff revision, liquidating the entire move.
With the weekly low near, I would like to reach there and see a breakdown if possible.
The Nikkei stayed around 33,000 yen, so normal operation, I suppose.
Yesterday I watched the drop during Tokyo time with my finger on standby, so once movement started from London, I planned to actively enter trades.
USD/JPY 1-minute chart
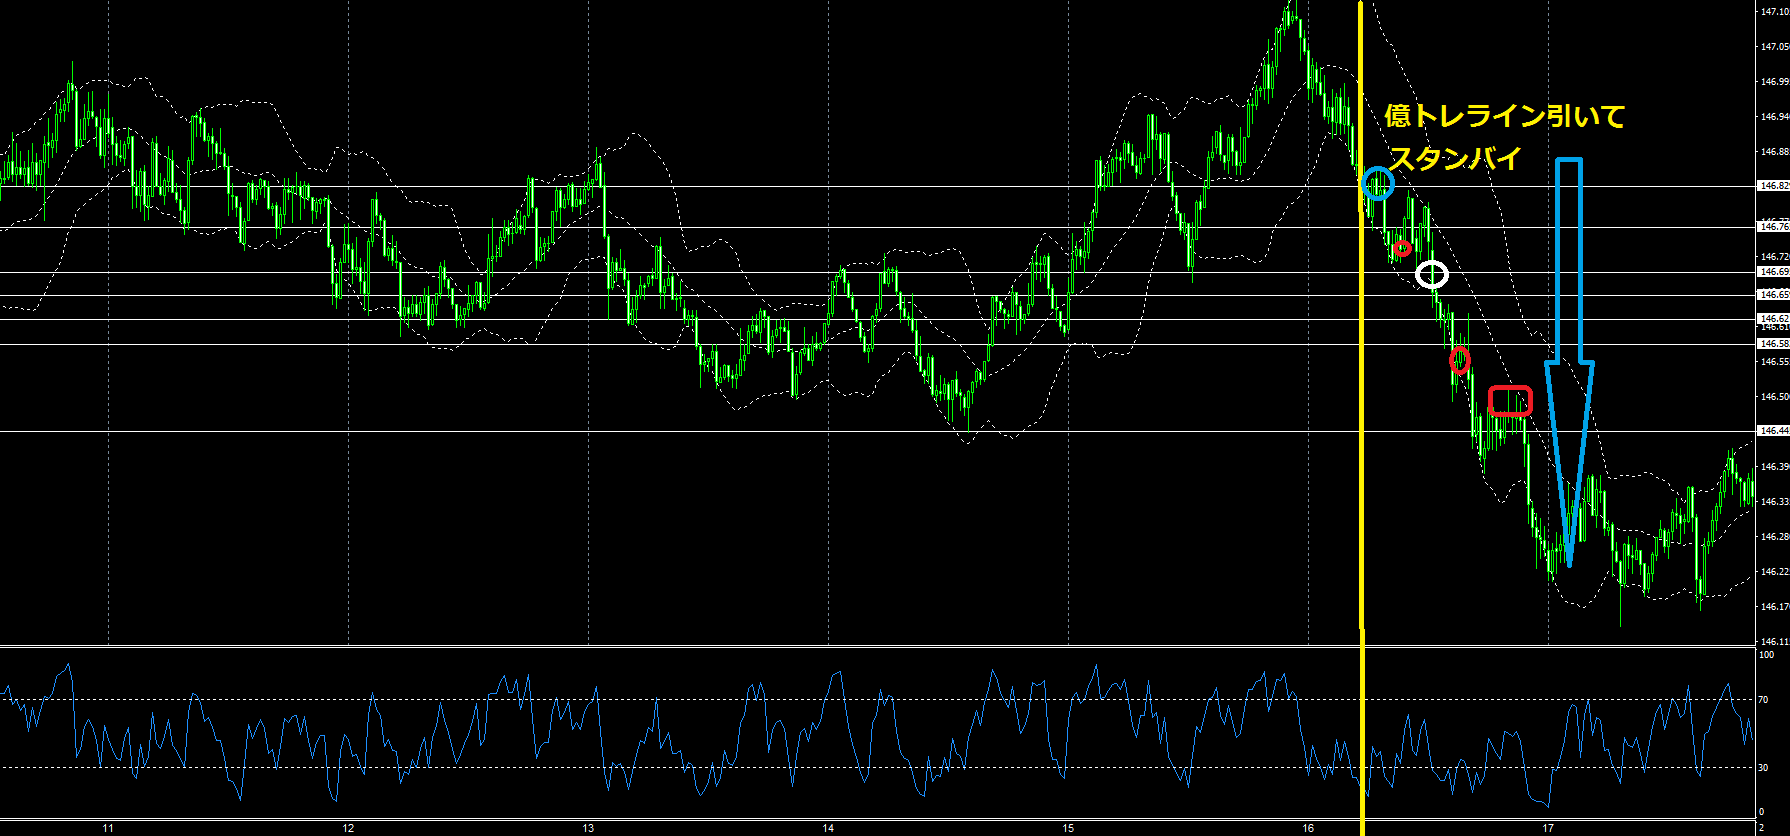
Right after London opened at 16:00, the Billionaire Trader chart turned to sell on the yellow horizontal line.
At the same time, draw the Billionaire Trader short line.
This is my specialty pattern.
Pullback blue circle 1,000,000 units short with profit in red circle.
White circle Billionaire Trader short break, 500,000 units position with profit in red circle.
The reason for using 500,000 was to prepare adding 500,000 for averaging if a quick retrace occurred.
This time it ended as a profit with 500,000 units.
It was painful that I couldn't sell on the retracement near the red □ zone's wick.
I was on the defensive after two wins.
In the end, Trump is the one driving the market and causing it to swing wildly.
If you don't rush and carefully watch the Billionaire Trader chart, you can identify market reversal moments and take positions on retracements, pullbacks, and breakouts without missing them.
Domestic BO participants have very cheap distant settings, but since low leverage is cheap, GMO is expected to move, so taking positions easily can result in being hunted.
We will take positions while watching the remaining time.
Today as well, there is a US economic indicator at 21:30, as last night.
I think it will be a trading opportunity, so check the movement up to that point with the Billionaire Trader chart.
Announcement
Currently, I am developing a product that “indicatorizes” my trading image.
Did I catch the peak and trough?
↓
Monitoring system signal on
↓
Trading signals
In simple terms, this is what the image looks like.
Even though it’s expensive, I have purchased the “indicator product” sold on GoGoJian, reviewed the community, and confirmed user complaints.
Those complaints are only natural, to be expected.
They are mainly comments about my warning in Investment Navi articles that “indicators cannot be relied on.”
Well, it’s obvious, yet everyone buys it.
Truly a “mystery.”
Indicators require discretion, which both sellers and buyers don’t seem to understand.
My product resolves that blind spot.
Which should you learn first: how to read indicators or how to exercise discretion?
Which comes first, the chicken or the egg?
I believe this product can solve both at once.
Prepare for the upcoming XX shock and please improve your trading skills.
I appreciate your continued support today as well.