

Use of “Visual Indicator” (Part 193)
“Visualization Indicator” usage (part193)
1. Further evolve the “28 Currency Pairs List Indicator” into an indicator“8CPVisualization Indicator”that drawsAUDJPY.
The “8CPVisualization Indicator” comes in Oceania,Oceania version,London version,NewYorkAnyCP version. This time, theOceania version was used.
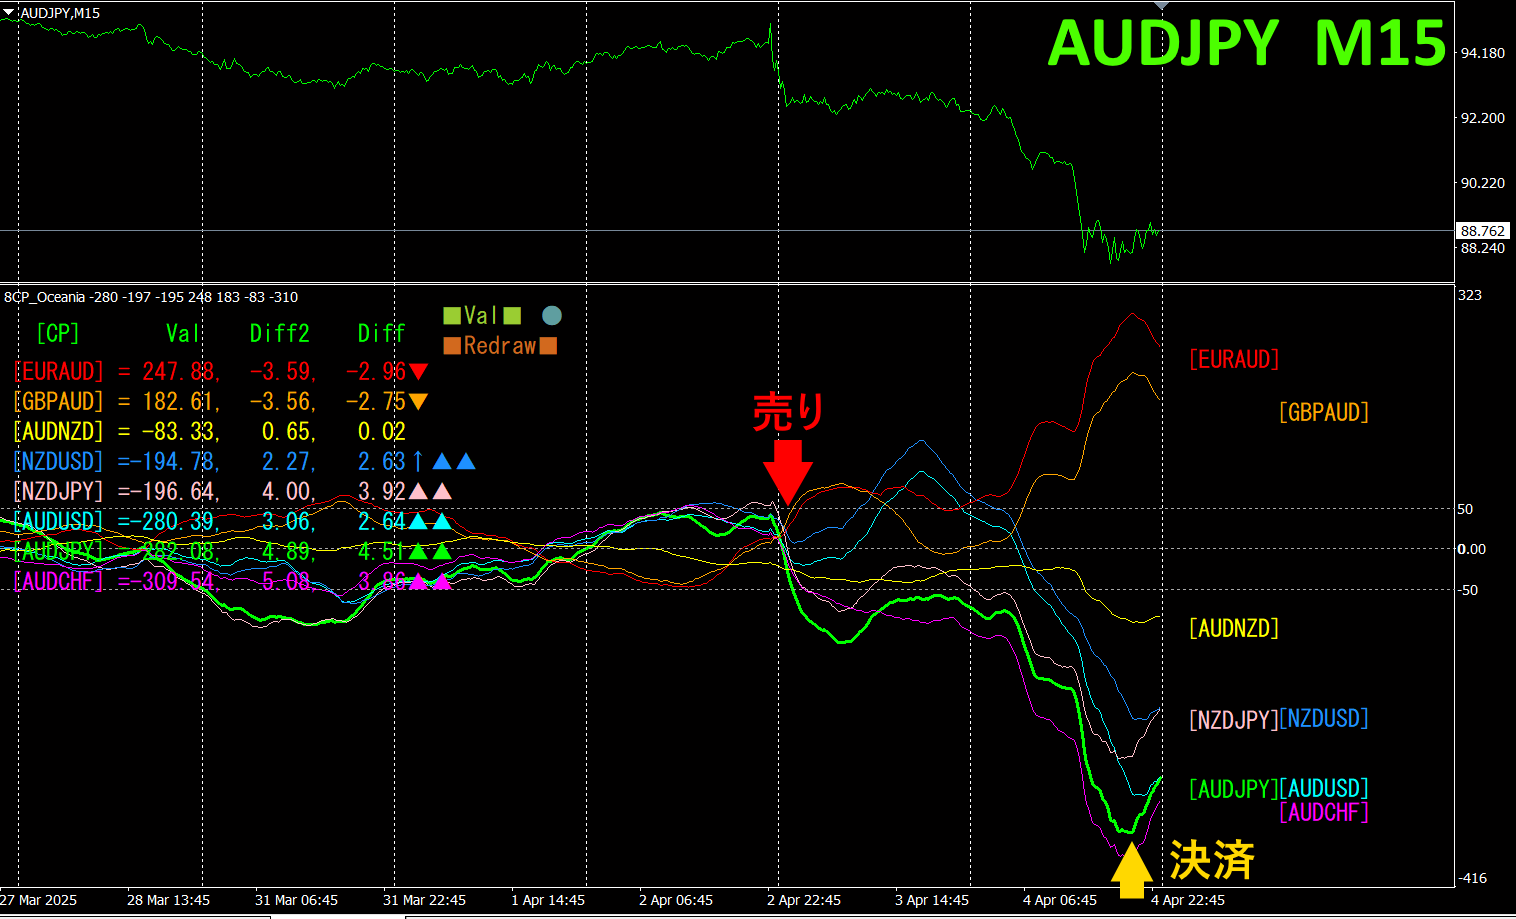
The upper half is theAUDJPY 15-minute chart. The lower half is from the “8CP Visualization Indicator”; the green thick line graph corresponds toAUDJPY.
There was a selling opportunity on Thursday. Sell when the indicator graph cluster breaks below, and close at the bottom. About460pips of profit was realized. The idea of “take only when a trend exists” yields sufficient profit.
If you use the “TrendLine-EX,” you can automate entries and exits by diagonal trendline breaks. You can leave it as is for easy trading. “TrendLine-EX is a semi-automatic EA that sells automatically on a trendline break below and closes automatically on a trendline break above.
2. Best SelectUse the indicator
The figure below is a screenshot fromApril,2025, day44,12:3112:31 ( (JSTJST) .) のヒストリ
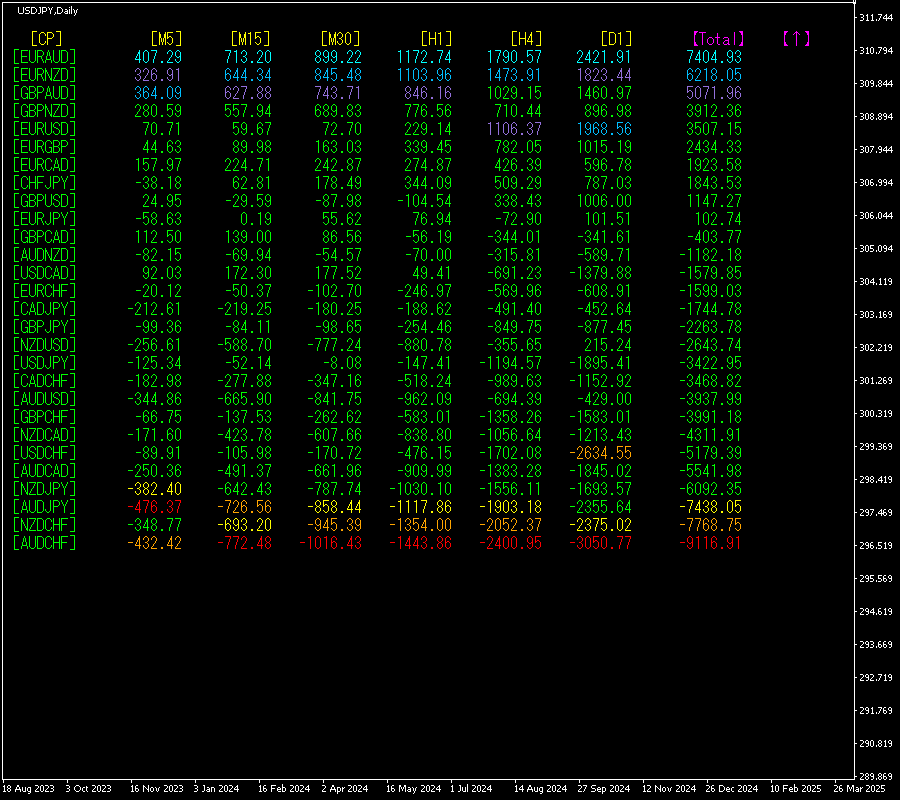
[Total]The numbers are sorted in descending order. At the very top, EURAUD shows blue display in all time frames.Total value is7404.93, a large positive figure.EURAUD indicates a significant uptrend.
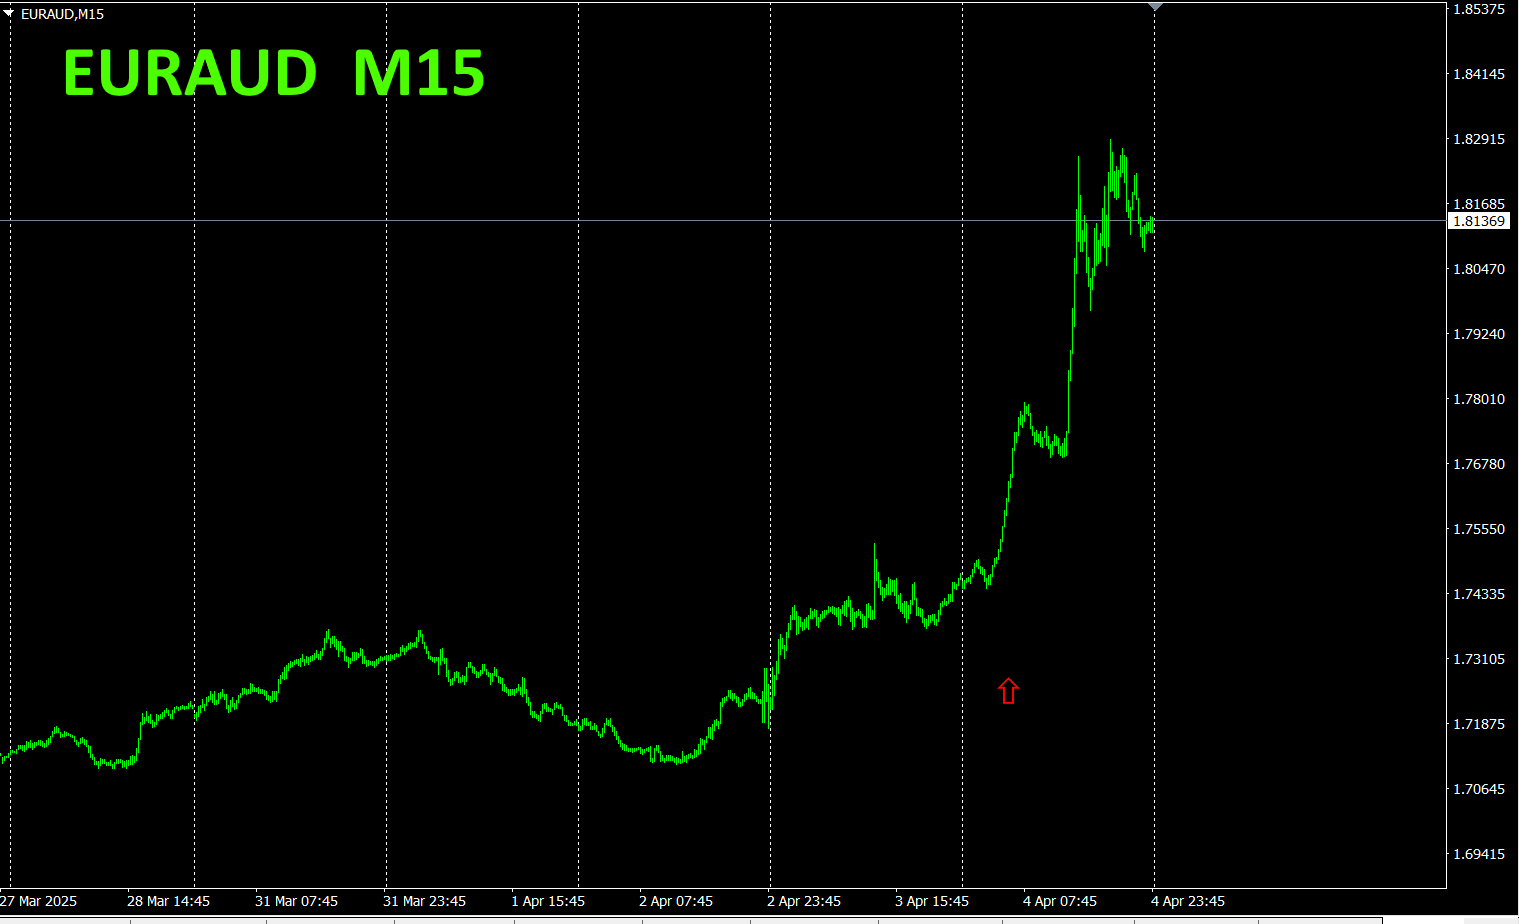
Now, let’s look at the EURAUD chart.
The red arrows mark the point where the screenshot was taken. It captures the surge in the middle of an uptrend.
“28 currency pairs Best Select indicator shows which currency among the 28 pairs is exhibiting the strongest trend, and whether you should trade now using numerical and color cues. It enables an at-a-glance assessment of all currency pairs’ movements.
“28 currency pairs Best Select indicator”
https://www.gogojungle.co.jp/tools/indicators/35128

3. 2021 year5月
2021 year5月5EURJPY monthからの動きを追っています。
To see the overall trend, we draw about30 minutes of the most recent3 weeks on the 30-minute chart.
Last time I wrote the following.
Pink isEUR, green isJPY andEUR both trend upward, but the angle isJPY>EUR. Therefore, EURJPY is expected to move slightly downward.
It is slightly downward, but trading within a range.
30 minutes currency strength chart.
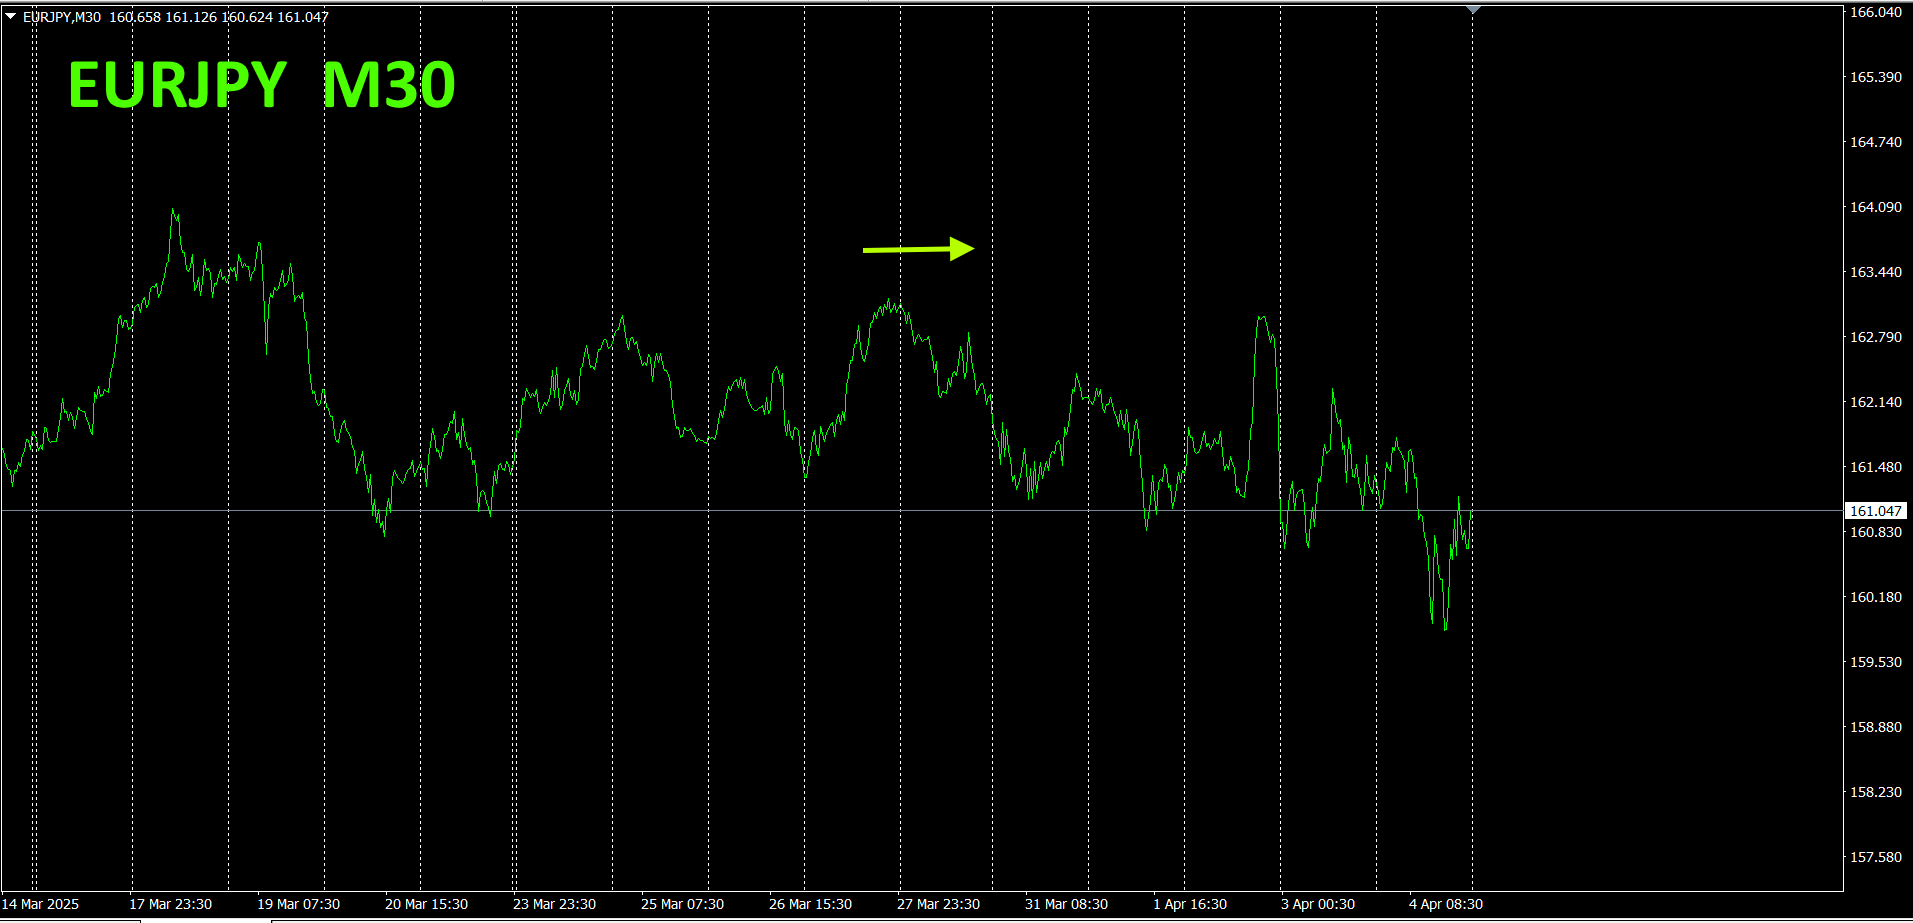
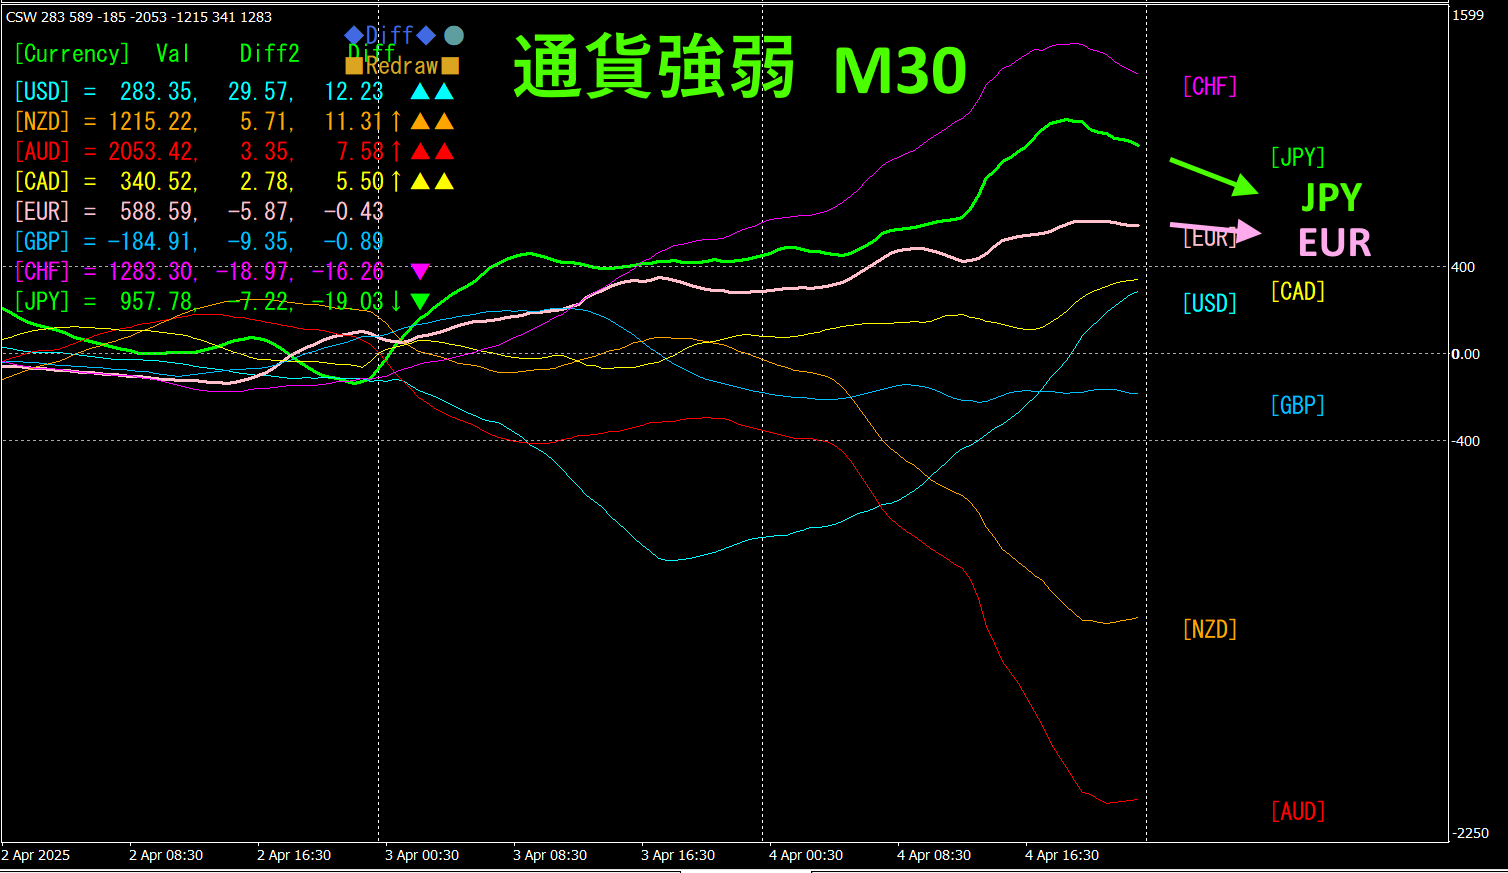
Pink isEUR, green isJPY. In the currency strength chart,JPY andEUR are both slightly downward, but the angle isEUR>JPY. Therefore, EURJPY is expected to move slightly upward.
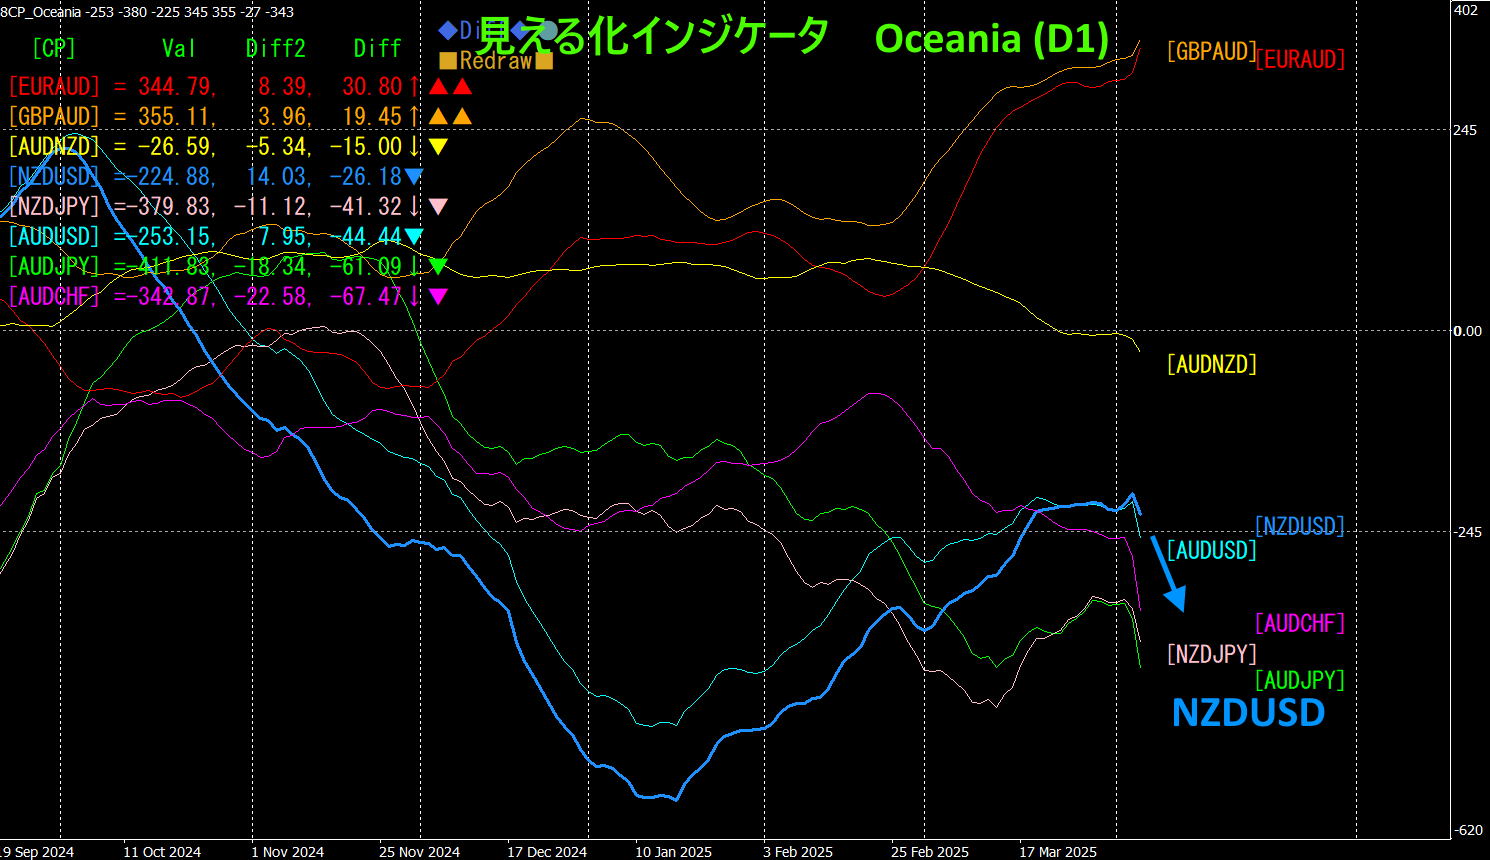
4. Try the Visualization Indicator on the daily chart
The figure below shows the “8CP Visualization Indicator” version on the daily chart. Oceania
In the last time, NZDUSD has been slightly downward, but this time it has clearly turned downward. It seems to be forming a pullback on the daily chart.NZDUSD graph should wait for reversal upward before considering a buy.
Recommended indicators
“Toretore Indicator”
https://www.gogojungle.co.jp/tools/indicators/50115
“TrendLine-EX”
https://www.gogojungle.co.jp/tools/indicators/42257

“8C Currency Strength Visualization Indicator” please refer to the following page.

MT4 version https://www.gogojungle.co.jp/tools/indicators/39150
version https://www.gogojungle.co.jp/tools/indicators/39159
【My current products for sale】


