
All about price action trading
Hello, this is Kuroshiba.
This time, I would like to write out everything about the trading flow and mindset that I usually follow.
I trade without using indicators, relying only on zones and price action.
Among these, time and MTF are particularly important, so I hope to convey that.
Now, let's write it down. (There is also an explanatory video)
1. Directional recognition on the higher time frame
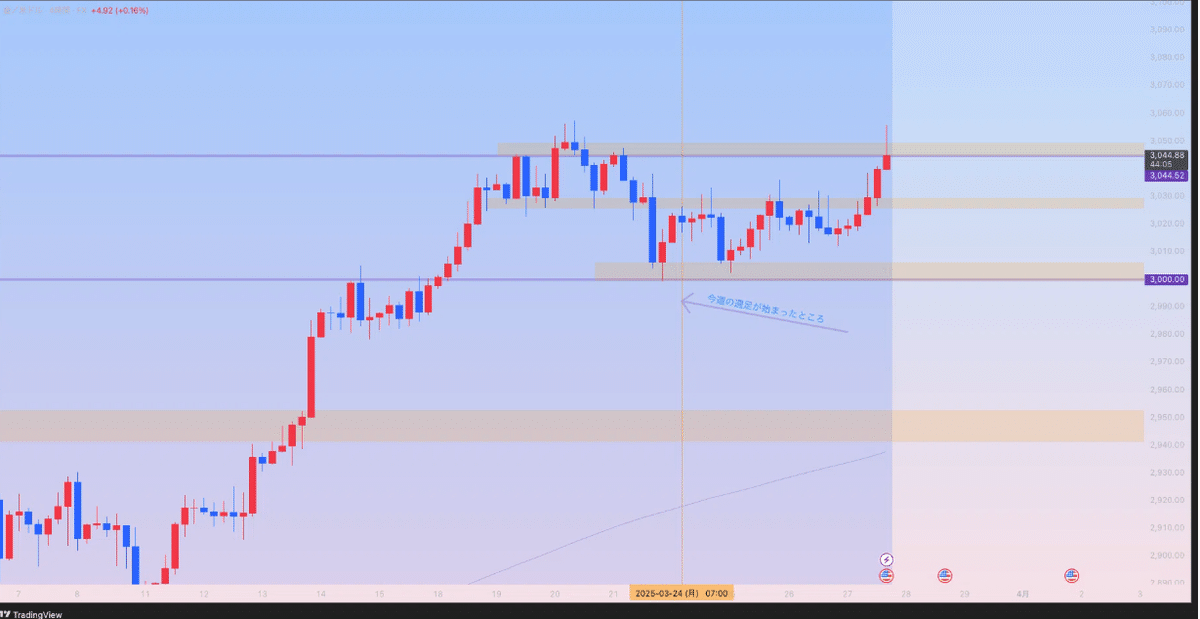
First, at the start of the week or when checking the chart, I begin by checking the highest time frame.
In my case, I look at the weekly and daily charts.
What’s important here is predicting whether the one-candle will be bullish or bearish.
At the weekly/daily level, one candle can have enough of a price range.
For example, in the image below, the candles from the week before last and last week show a range break and ATH continuing, right?
In this situation, the current week’s (latest candle) likelihood of turning bearish is low.
Even if it turns bearish, it’s unlikely to be a big drop, so the thinking is “I won’t be taking shorts this week.”
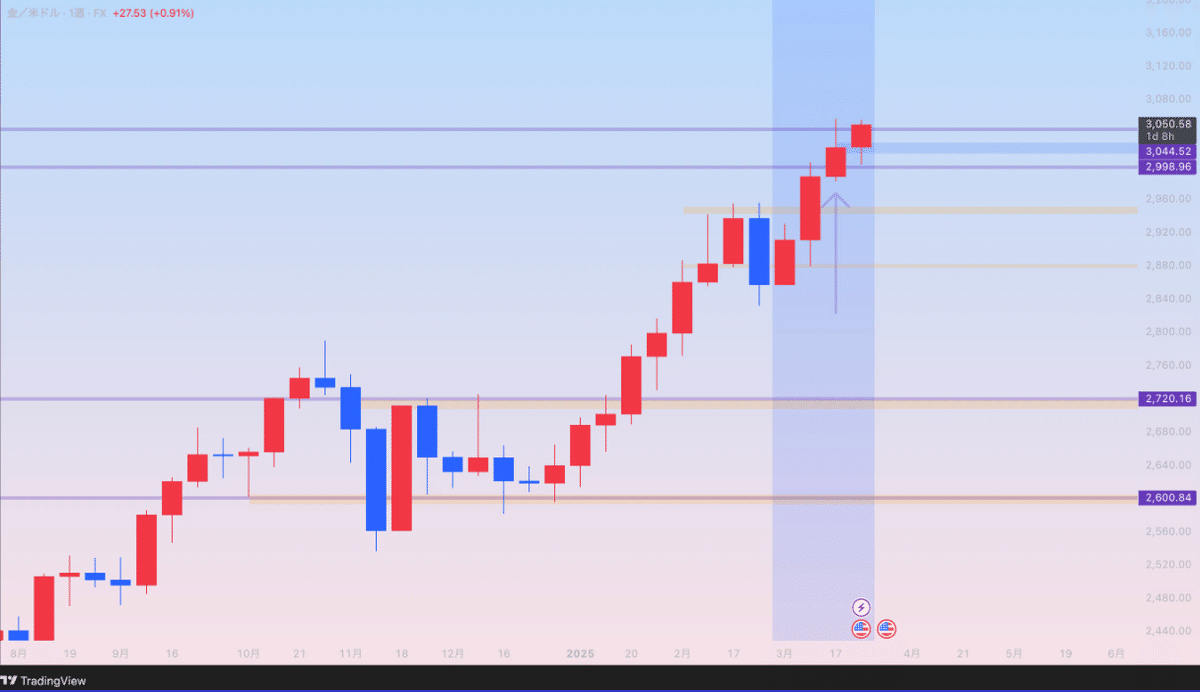
In this way, on the higher time frame I roughly predict whether it will be bullish or bearish, only the directional sense.
Also, something to keep in mind roughly is seasonality.
The blue vertical zone in the figure below indicates the same month in past years on the indicator.
Just by looking at this, you start thinking, “March tends to go up, maybe.”
Being able to understand that alone is a big advantage.
By the way, you can also check seasonality on TradingView.
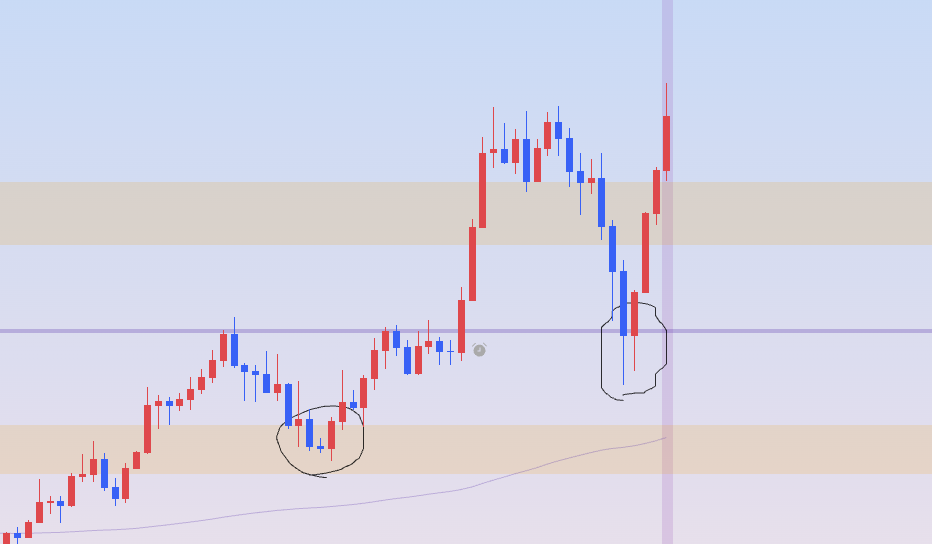
2. Drawing zones on the 4-hour chart
Next, I draw zones on the 4-hour chart.
I think this step is the most important.
Becauseentries are generally only within the zones.
Zones are price levels that people watch (horizontal) and the places where wicks accumulate, so they are the edges of ranges or support/resistance.
This is the most critical part when entering a trade.
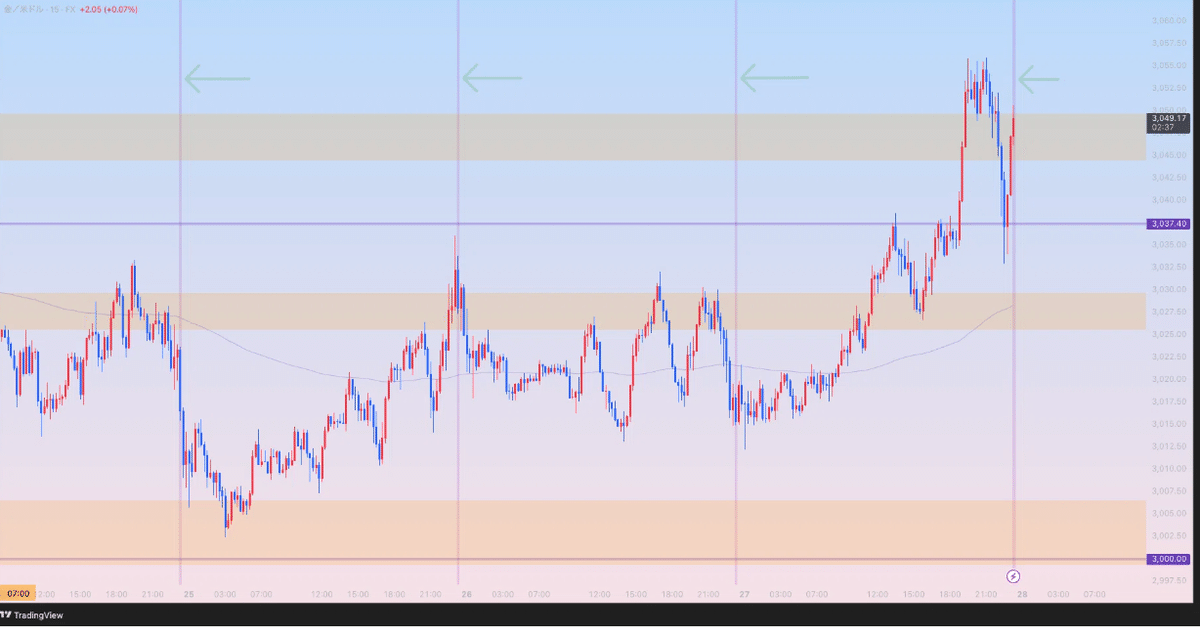
When drawn, it looks like the figure below.
Three zones can be drawn.
From the higher time frame environment recognition,there is no short, so entries within zones are long only. In other words, the week’s entry would be from the moment the weekly chart started, and would be at one of the green lines below.
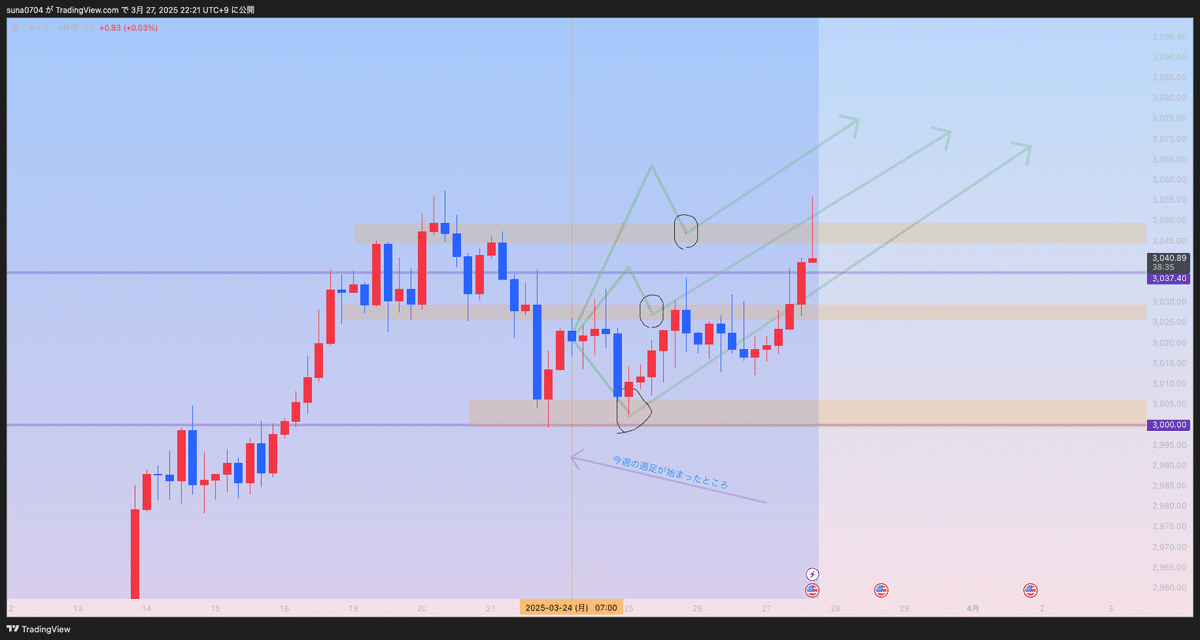
The location itself is arbitrary, but in all casesyou enter the zone from above and then look at the lower time frames to enter long.
3. Timing on the lower time frame and entry
When the price enters the zone on the 4-hour chart, drop to the 15-minute chart to measure timing.
What’s important here is
・the low is no longer being broken
・the horizontal axis is established
・not being overly influenced by Dow theory
These are the points. There are videos on each theme, so please check them out.
If you enter on the 4-hour chart into the zone and switch to the 15-minute chart to enter, it would be at the black circles below.
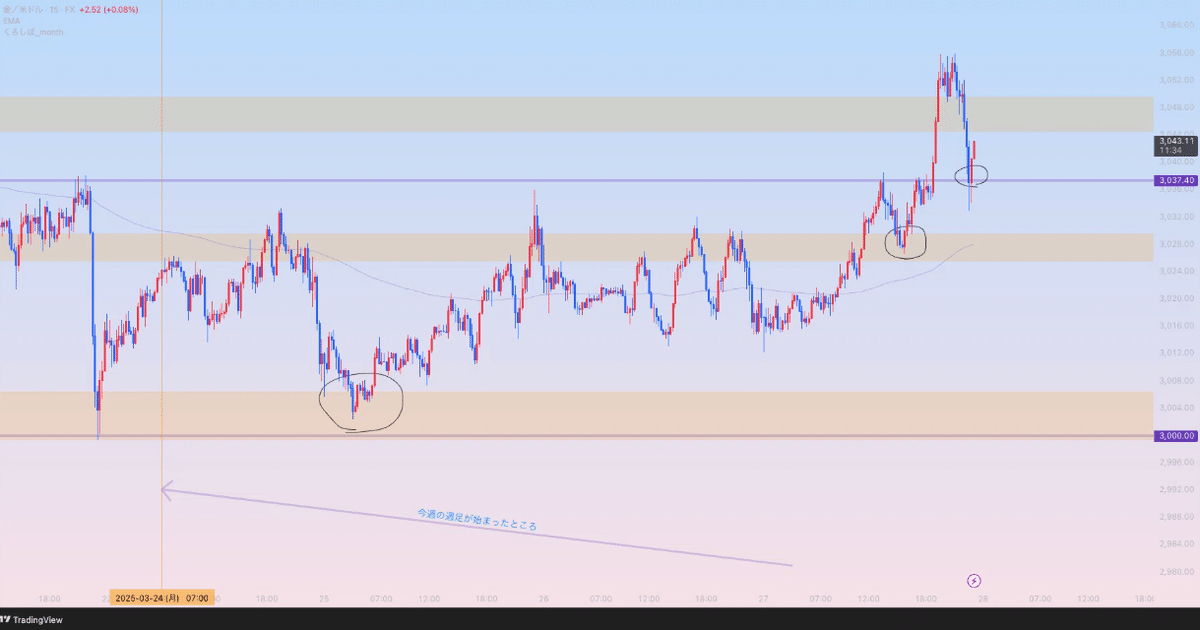
・First black circle
This one is fine to take a long without waiting for the horizontal axis.
It’s a round number of 3000 dollars, clearly indicating a rebound, so you can back it.
・Second black circle
This is a retest after a range breakout, so enter on the upper end of the range within the zone with horizontal axis or a strong candle.
・Third black circle
This isn’t within a zone, but if you’re watching in real time, there is a point where you can enter by looking at price action. A bit more challenging.
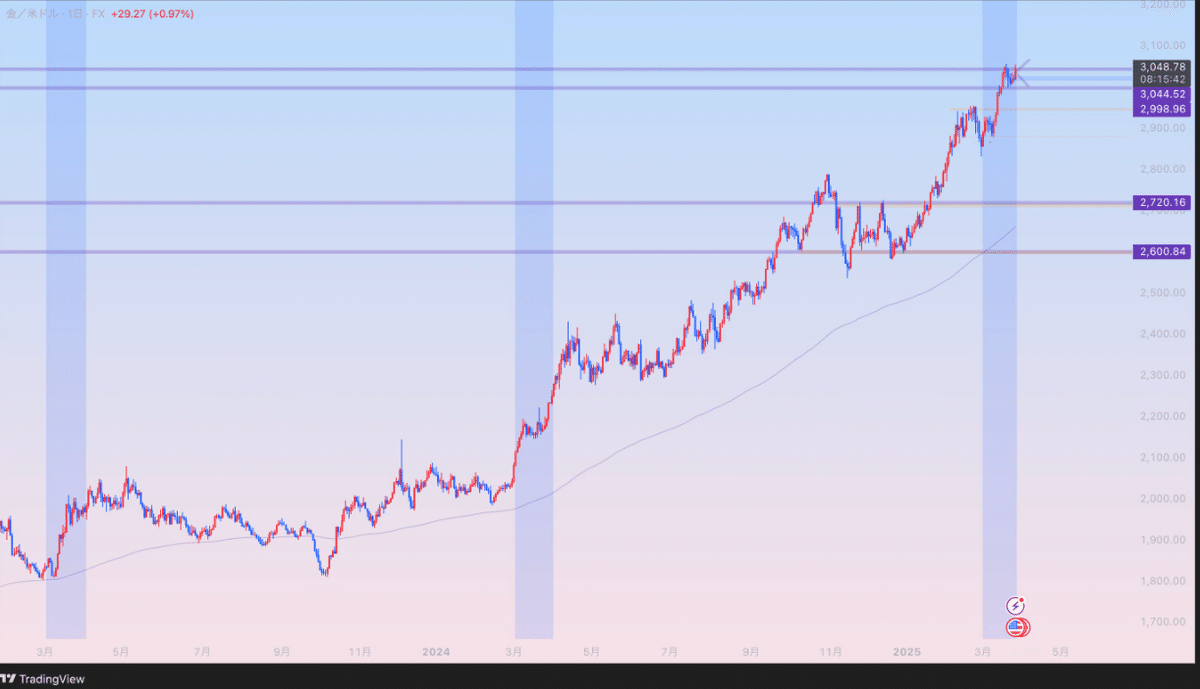
That's about it. While writing this article, I could ride the second and third circles.
I dealt with the top two at 3050.
Digressing, but profit-taking and stop-loss are good to keep in mind as key levels.
Because those are places where orders cluster.
Time and the 1-minute chart
I’ve explained the entry, but there are other aspects I’m mindful of. They aretime-based tendenciesand entries on the 1-minute chart.
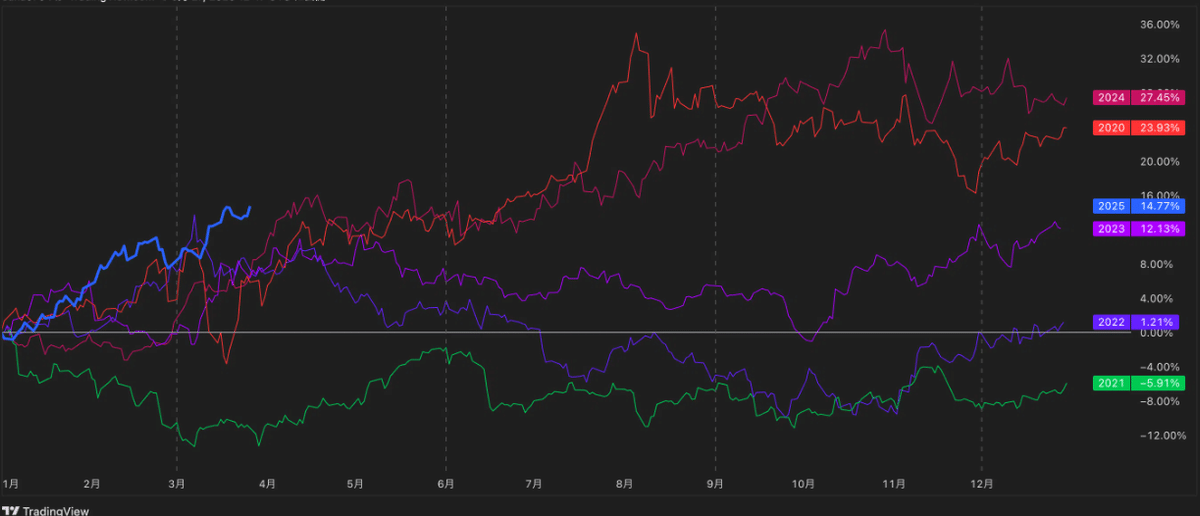
⚫︎Time-based Tendencies
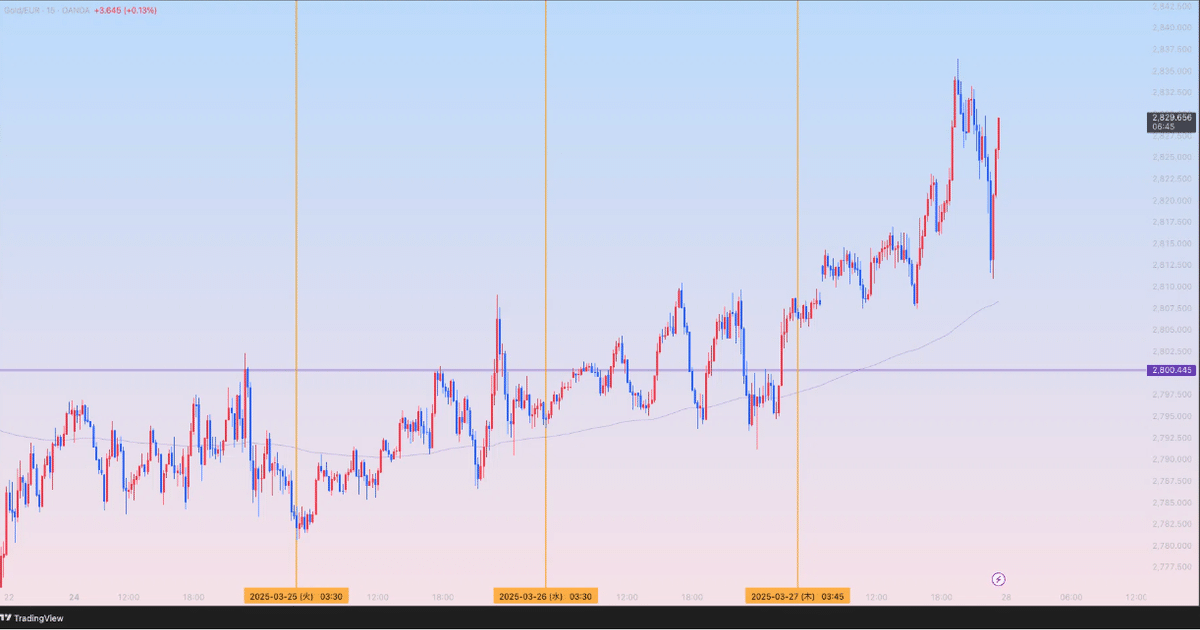
Currency pairs change, but it’s the same as before, the gold priced in EUR.
The orange vertical line is around 3:30 AM this week.
After each vertical line, there is an upward tendency visible.
Finding such tendencies is extremely important, and you can win even without a steady week-to-week technical analysis. This is real.
However, on Fridays, positions for the week close, so the tendency often breaks, so be careful. By the way, I value this tendency very much, soI use an indicator that automatically draws vertical lines at the same time each week..
It’s incredibly convenient. Haha
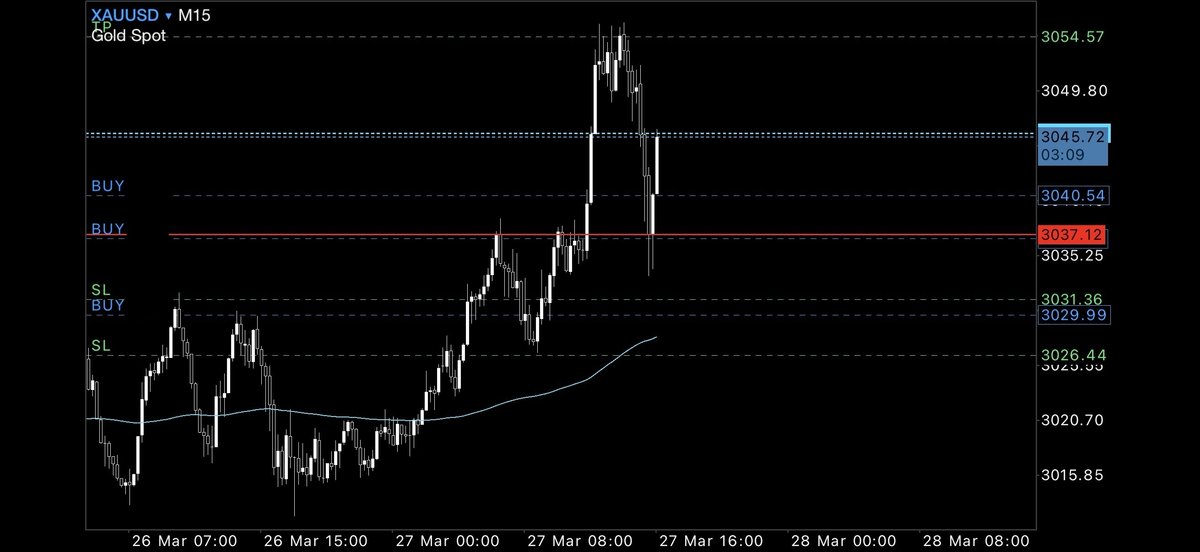
⚫︎Entry on the 1-minute chart
This is used when actually entering tofind slightly more favorable spotsand toenter as soon as possible into a profitable position.
For example, the third black circle above looked at on the 1-minute chart as in the figure below.
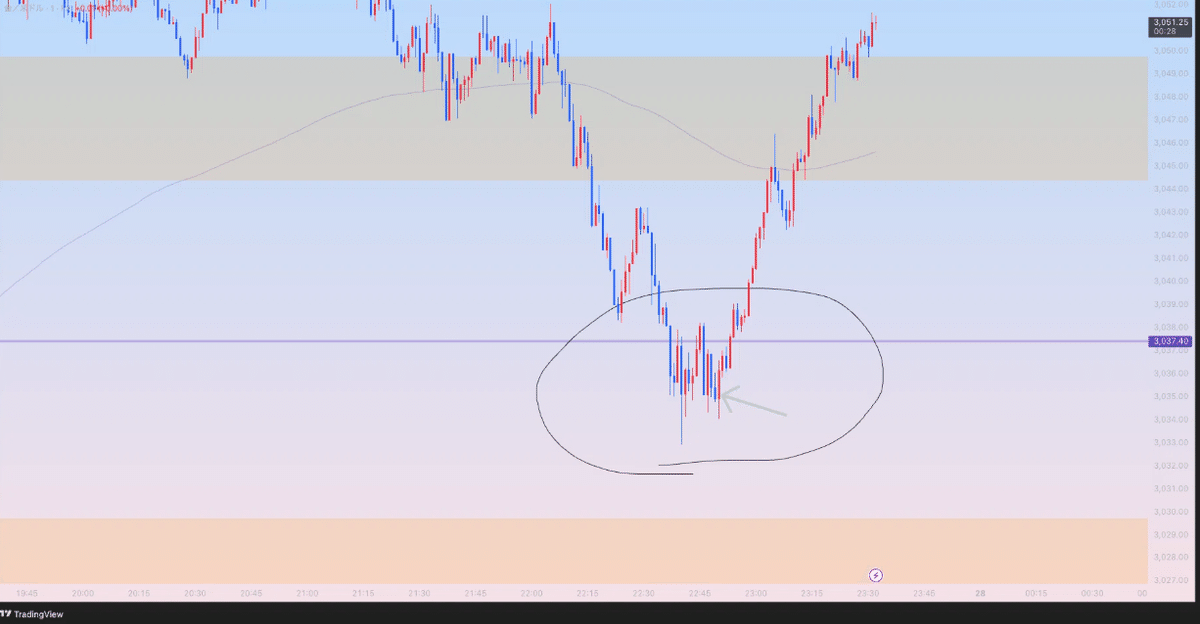
When the price reaches the watchline, you wait for a long, butthe place where the low stops updating & reversal signal
Yes, I think I’ve covered all of my trading explanations like this.
There isn’t a fixed procedure like a method, but it’s about integrating multiple elements.
Lastly, it may feel like promotion, butI have already written a text that completely explains entry using price action with candlesticks alone or chart patterns.
It’s over 10,000 words and uses dozens of images, so please give it a read!
If you can hold off on one deposit and read it, I believe it will help you all.
Oh, and for purchasers, if you wish, I can give you the source code for the aforementioned“indicator that automatically draws vertical lines at the same time each week”.
It’s just a bonus, so I can’t guarantee perfect operation. Haha