

Use of the "Visualization Indicator" (Part 192)
“Visualization Indicator” usage (part192)
1. Further evolve the “28 Currency Pairs List Indicator” into an indicator
“8CPVisualization Indicator”to drawGBPJPY on the chart
There are versions of the “8CPVisualization Indicator”Oceania版,London版,NewYork版,AnyCP版があります。 This time,London版を使用しました。
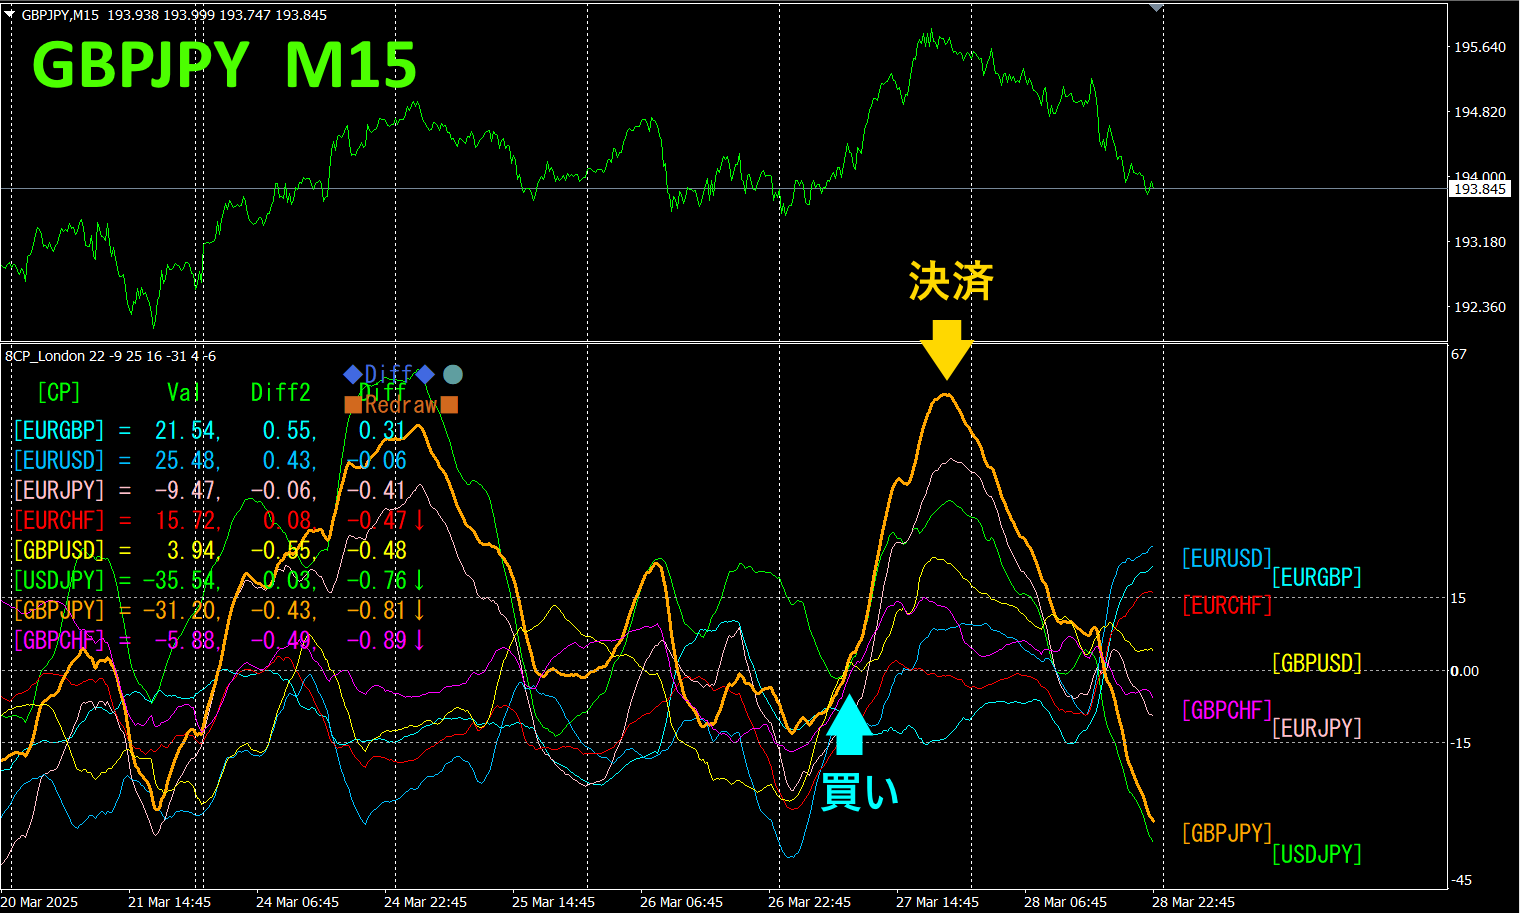
The top half is a 15-minute chart ofGBPNZD. The bottom half is from the “8CPVisualization Indicator,” and the orange solid line graph corresponds toGBPJPY.
There was a buying opportunity on Thursday. Buy when the indicator graphs break upward, and close at the top. About180pips of profit was earned. The idea of “take only when a trend is present” yields ample profit.
If you use “TrendLine-EX, you can automate entries and exits on diagonal trend line breaks. You can simply leave it, enabling easy trading. “TrendLine-EX is a semi-automatic EA that executes automatic selling on a trend line break below and automatic closing on a trend line break above.
2. Best SelectTry the Indicator
The figure below is a screenshot taken on2025 year3月27日日(JST)
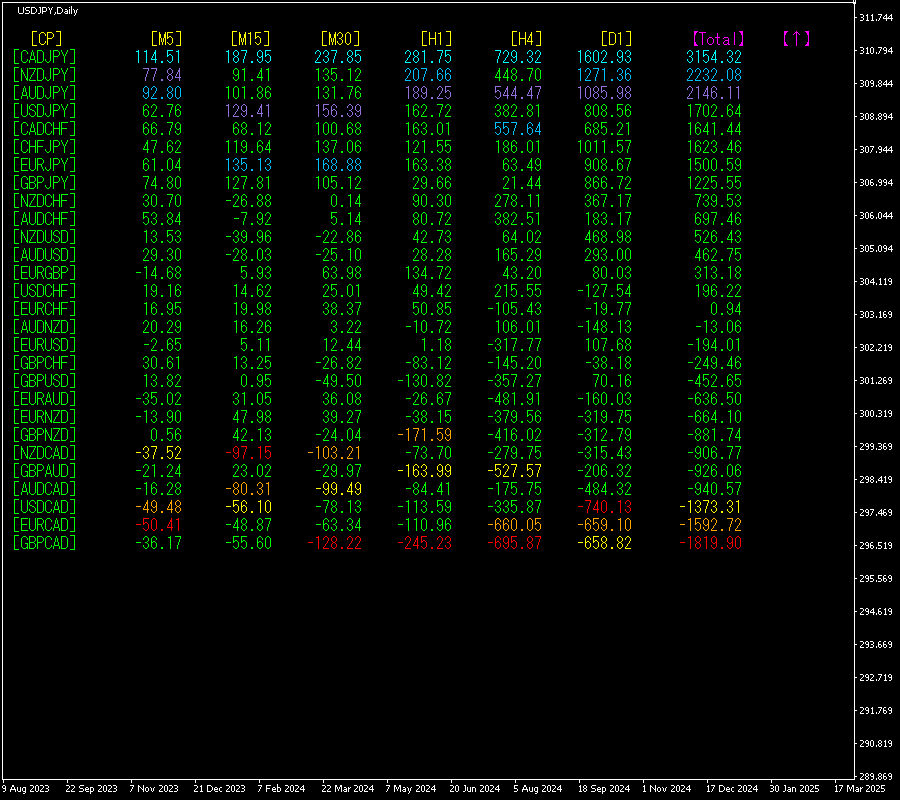
[Total]The numbers are sorted in descending order. At the very top,CADJPY shows blue hues on all timeframes. value is3154.32, a large positive number. indicates an uptrend is developing.
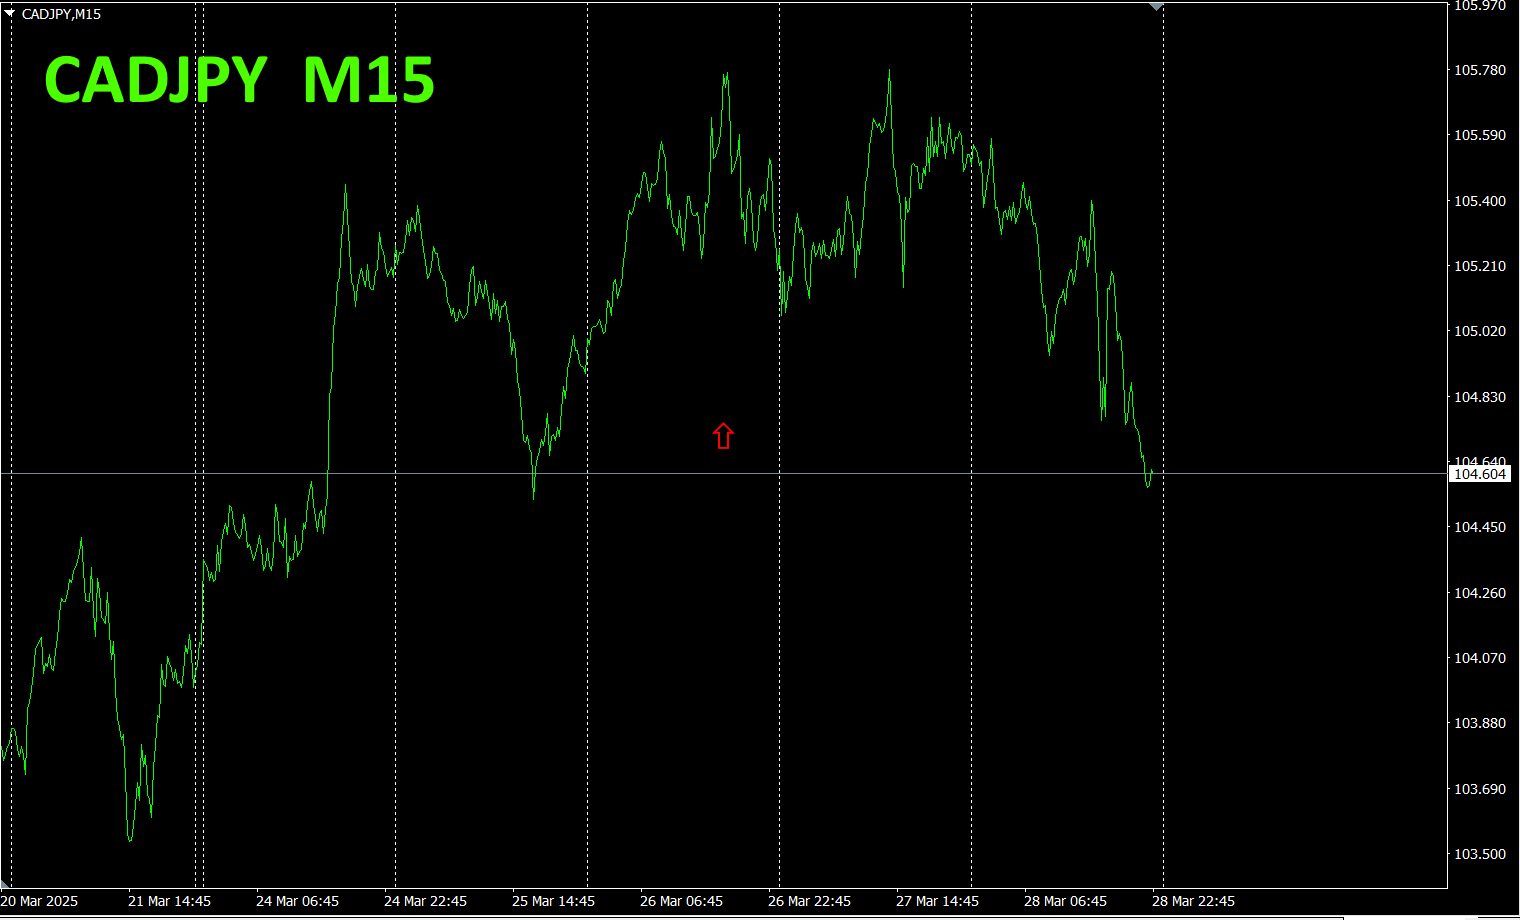
Now, let’s look at the chart ofCADJPY.
The red arrows mark where the screenshot was taken. It captures a rapid rise in the midst of an uptrend.
The “28 currency pairsBest Select indicator allows you to easily identify which currency has the strongest trend among 28 currency pairs. It also tells you whether you should trade now with numerical and color cues. It provides an at-a-glance view of all currency pairs’ movements.
“28 currency pairsBest Select indicator”

https://www.gogojungle.co.jp/tools/indicators/35128
3. 2021年5月から追っているEURJPYの動きはどうなった?
From year5月からEURJPY is being tracked.
To understand the overall trend, a30-minute chart covering roughly the last3 weeks is drawn.
Last time, I wrote as follows.
Pink showsEUR, green shows. In the currency strength chart, and are both pointing downward, with nearly the same angle. In currency strength, is indicated. A clear directional bias has not emerged.
It seems to be ranging again.
30-minute chart of currency strength
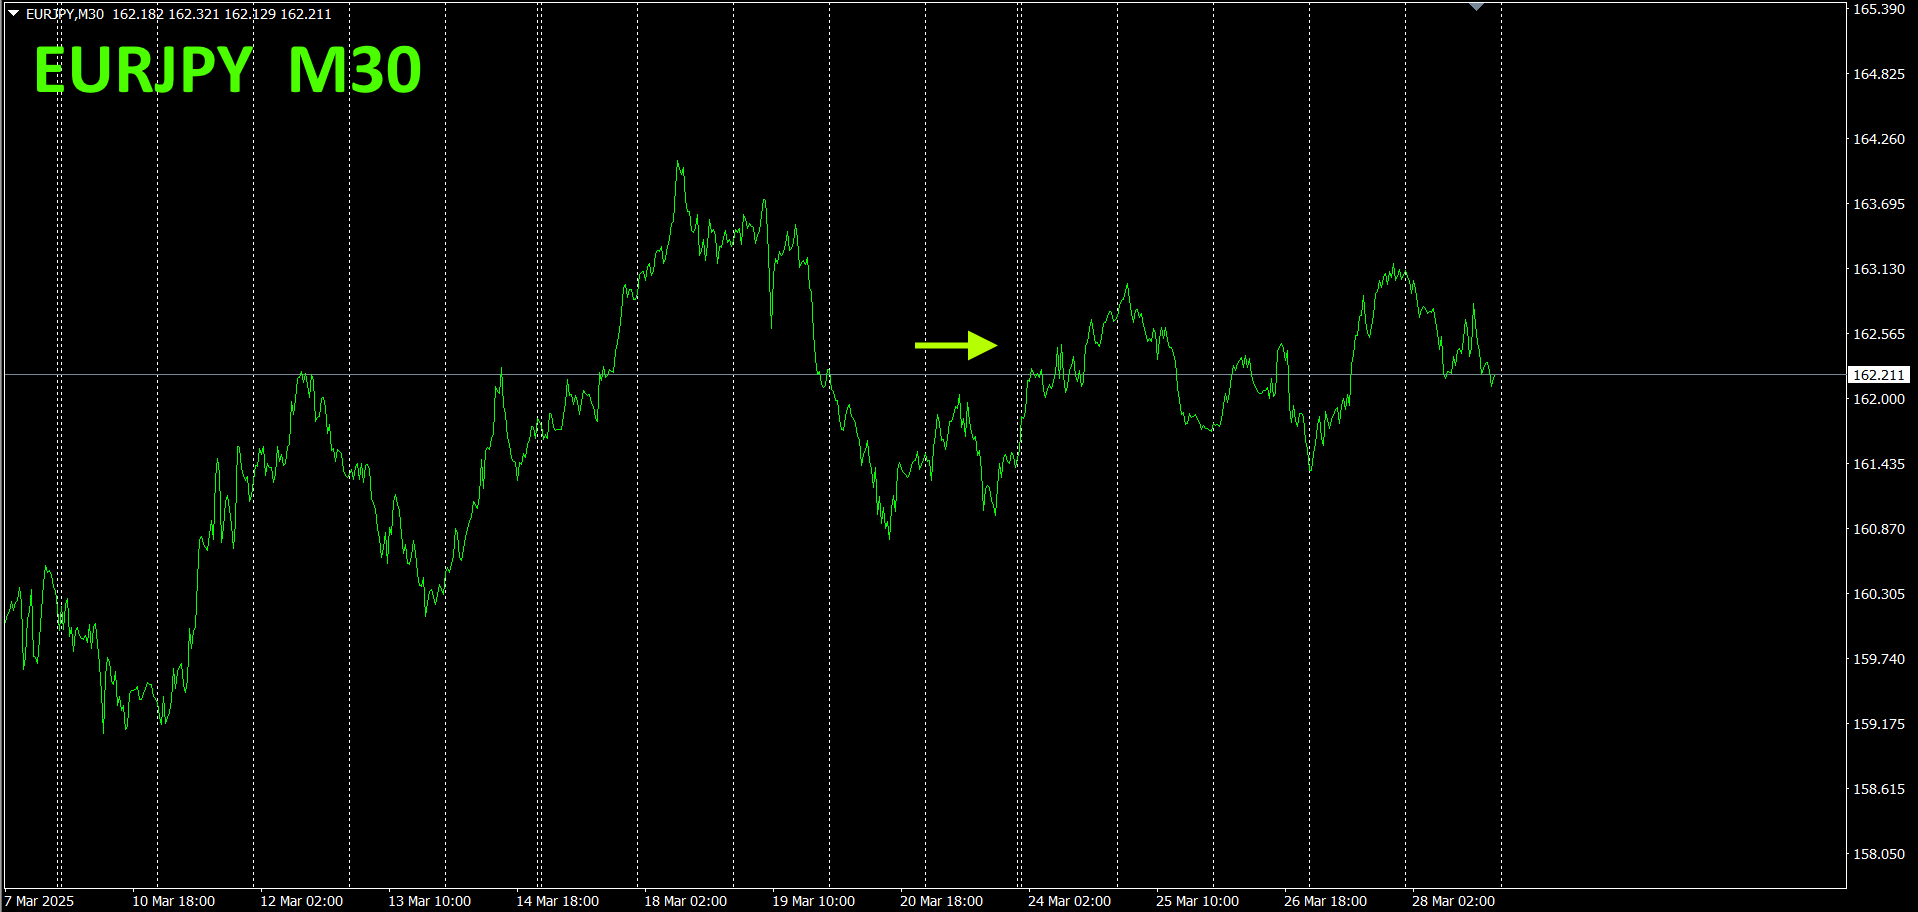
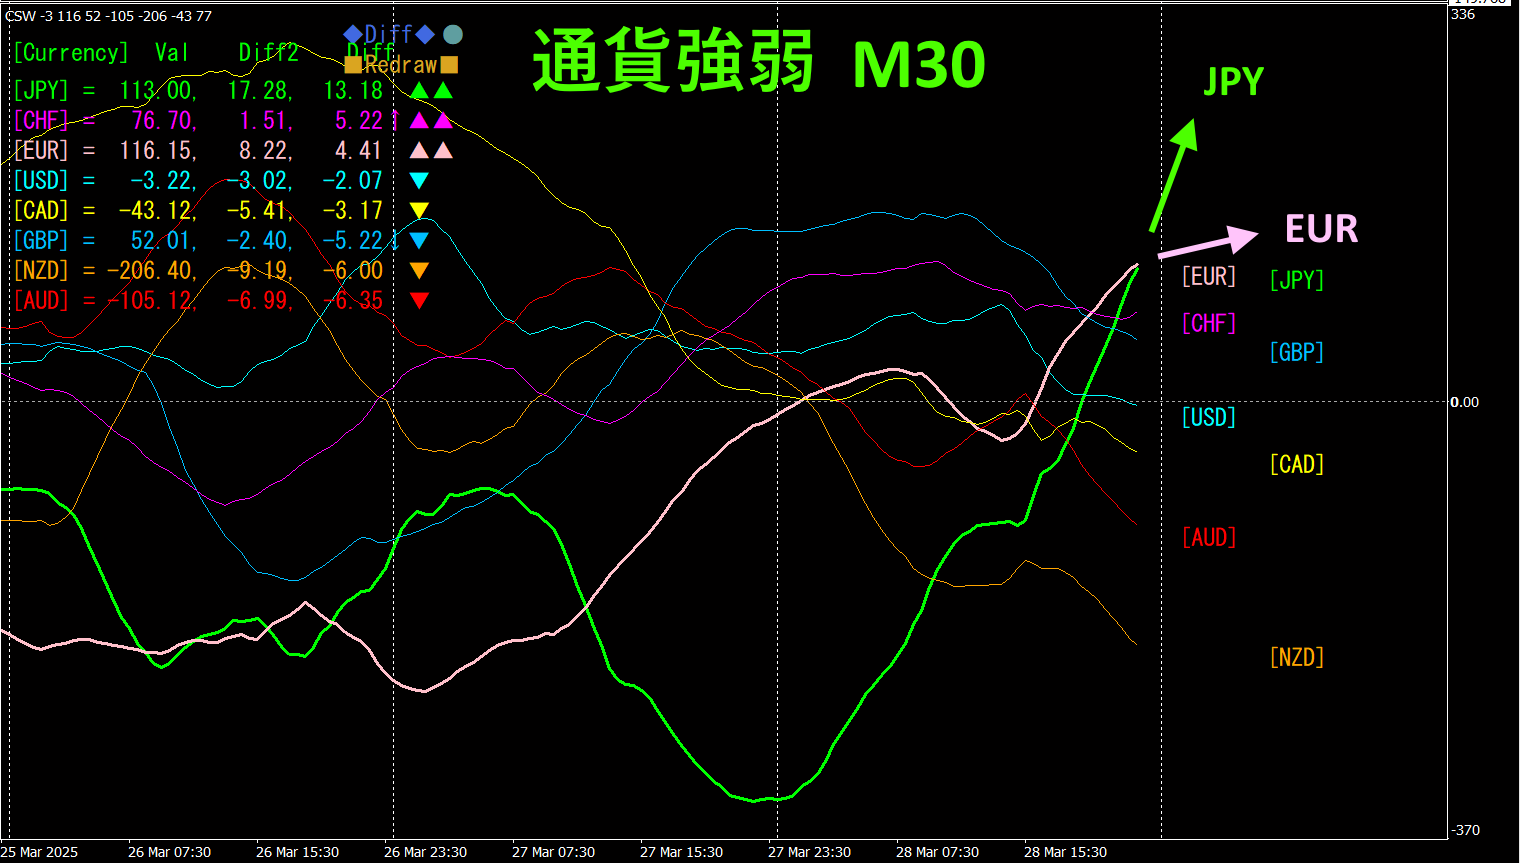
Pink showsEUR, green shows. In the currency strength chart, andEUR are both moving upward, but the angle is. Therefore, EURJPY is expected to trend slightly downward.
4. Using the Visualization Indicator on the daily chart
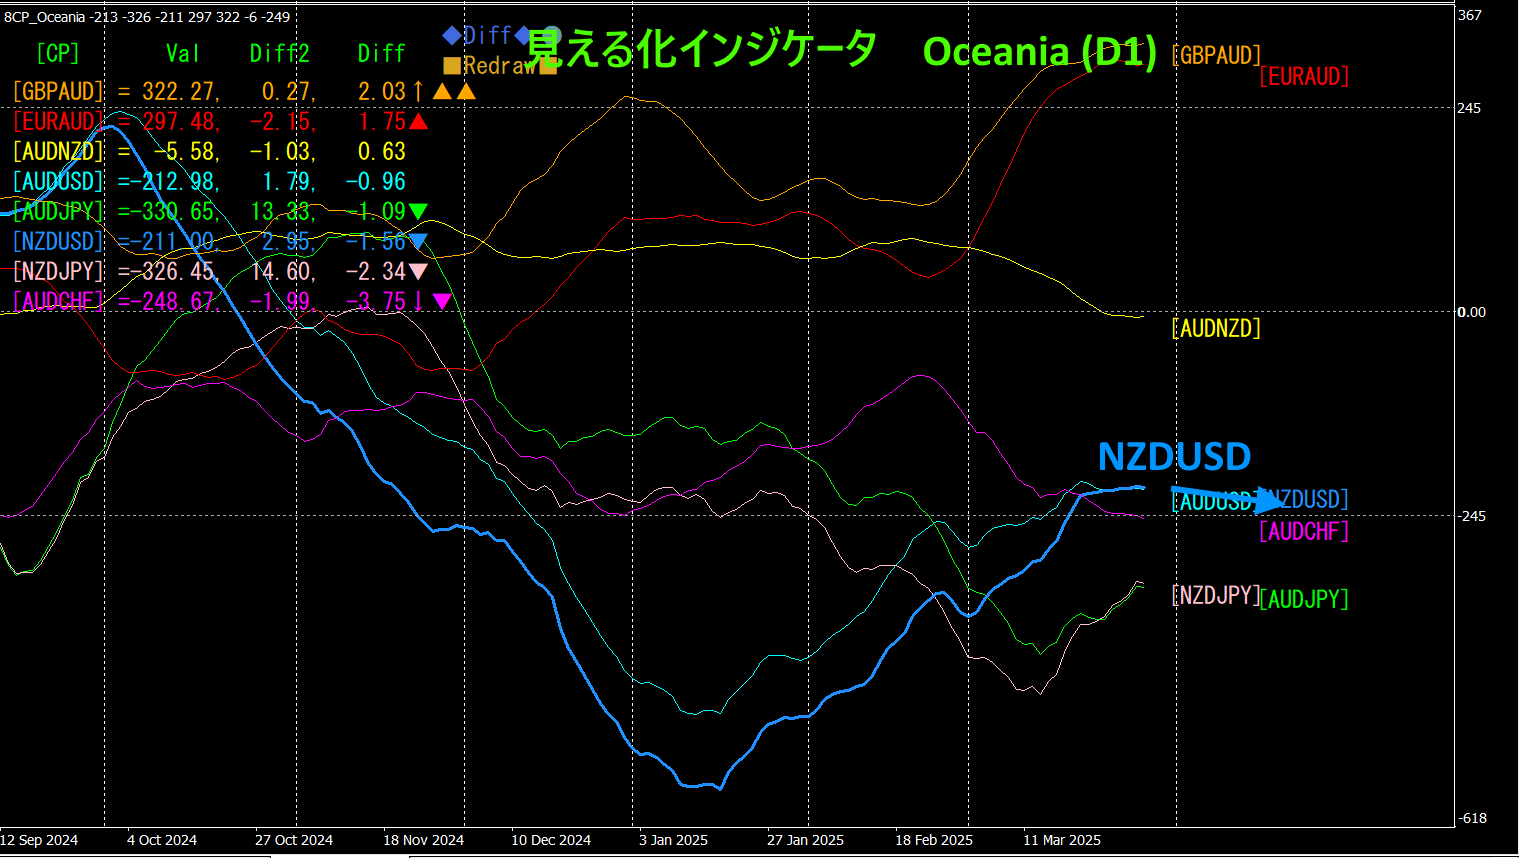
The figure below shows the “8CP Visualization IndicatorOceania version on the daily chart.
Previously, NZDUSD was turning upward, but this time it has turned slightly downward. It is expected to continue rising to the zero line, but the upside is having difficulty.If you hold a long position, you may consider closing it for now.
Recommended indicators
“Swaptargeting indicator”

“Toretore Indicator”
“TrendLine-EX”

The “8Currency Strength Visualization Indicator” is described on the following page.

MT4 version https://www.gogojungle.co.jp/tools/indicators/39150
MT5 version https://www.gogojungle.co.jp/tools/indicators/39159
【My Products for Sale】


