

【MochiPoyo Alert】Past Chart Examples
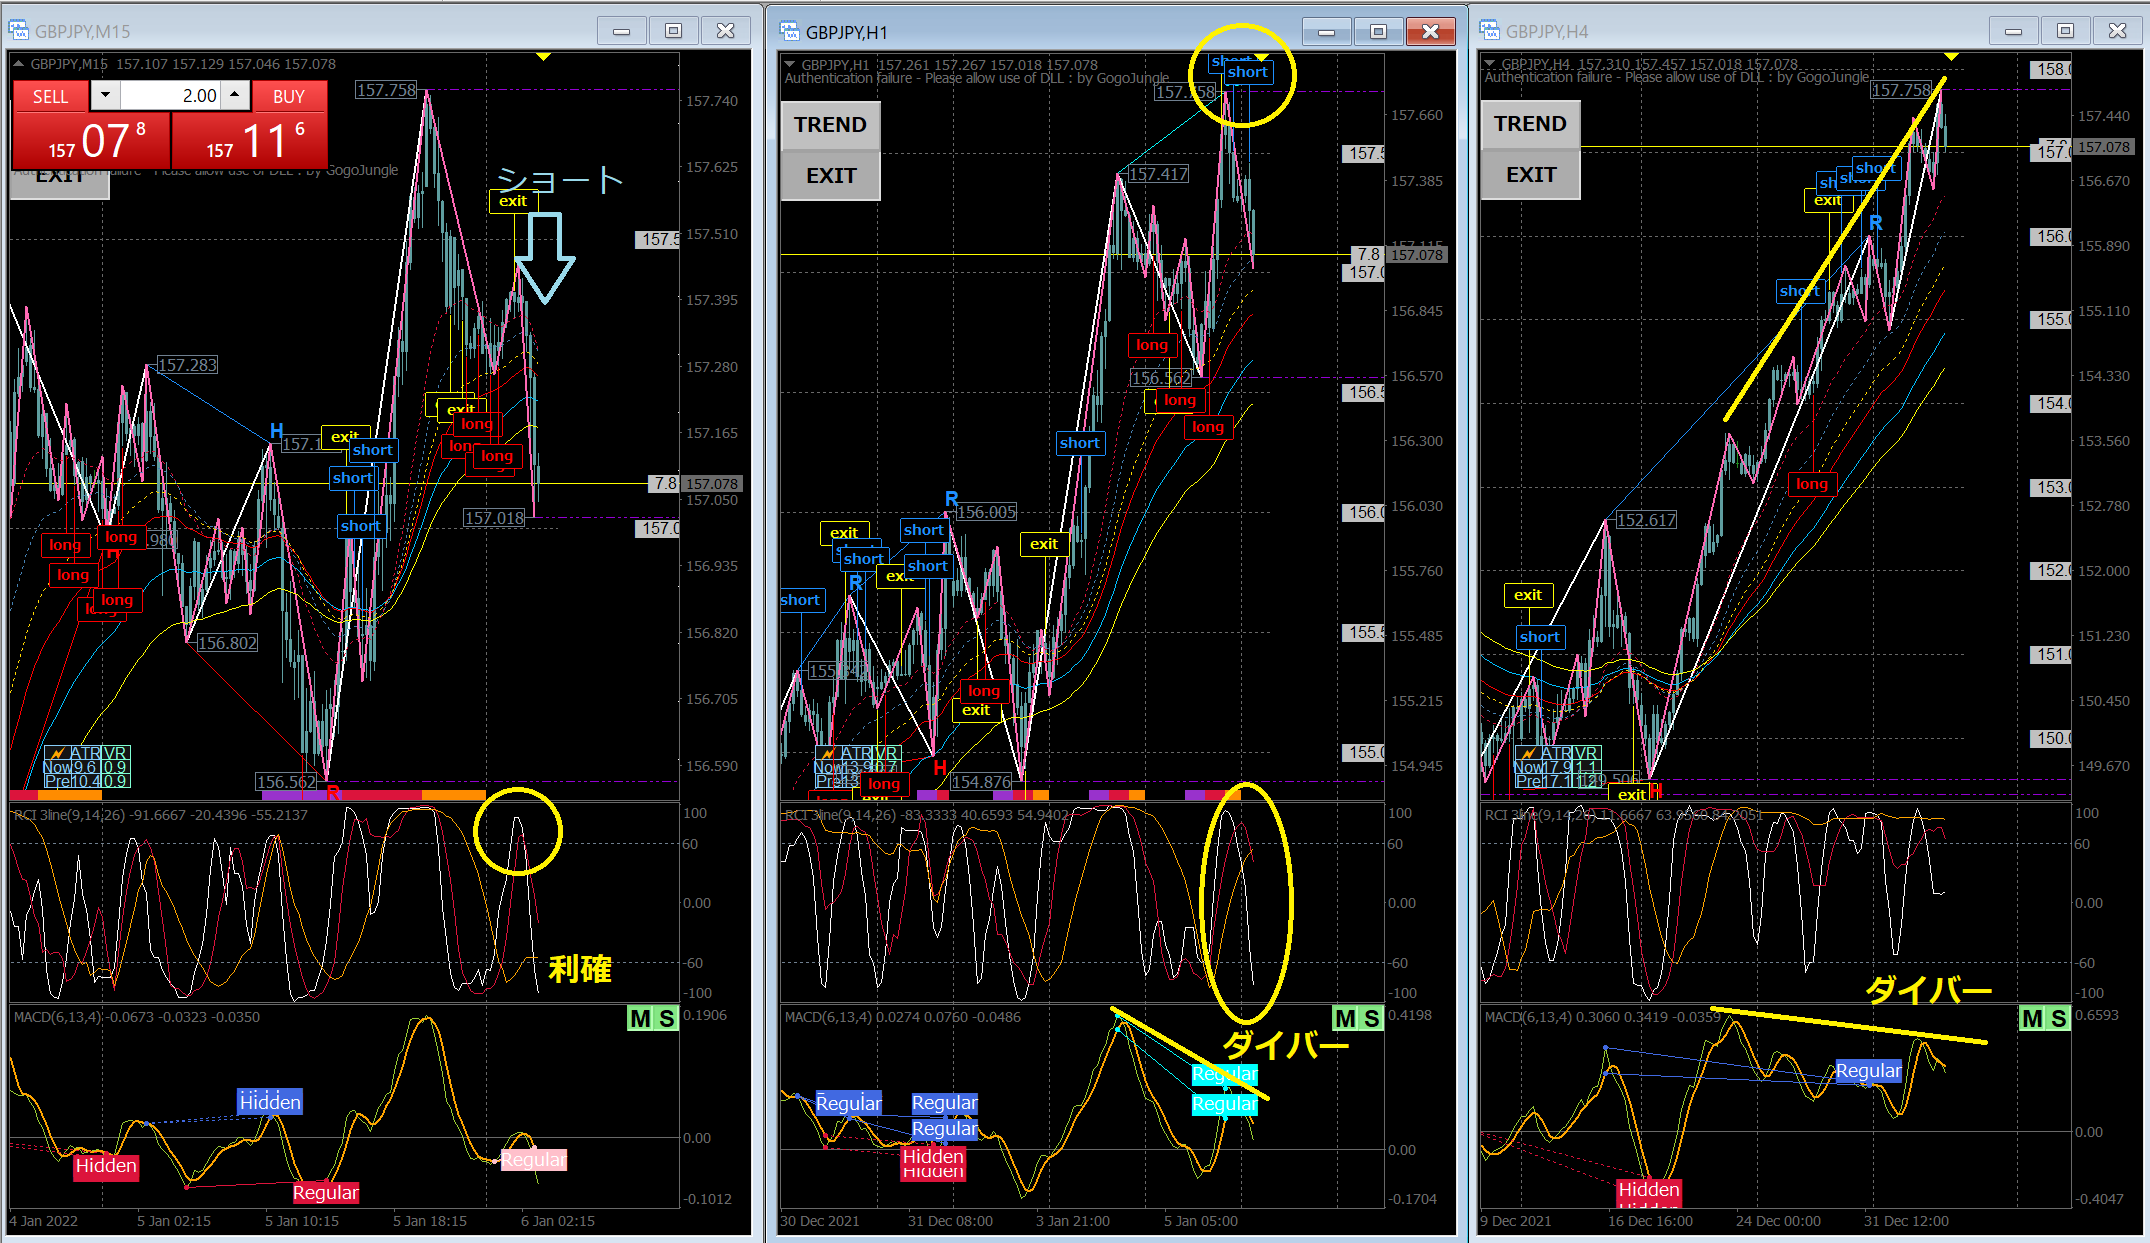
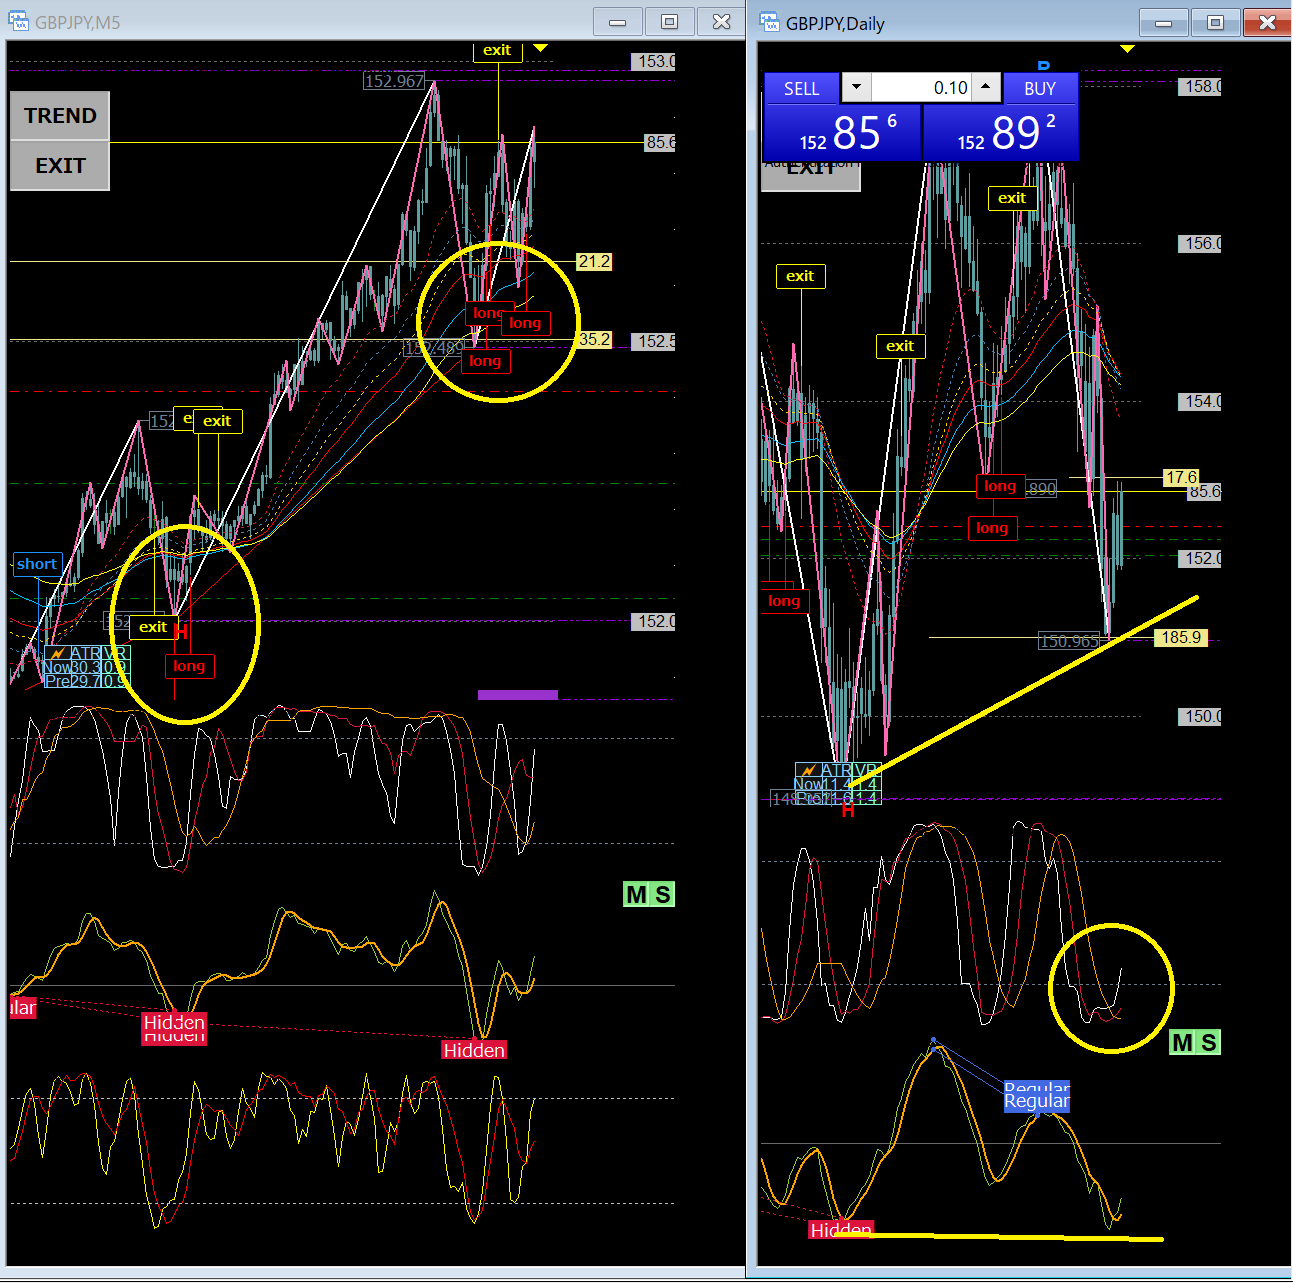
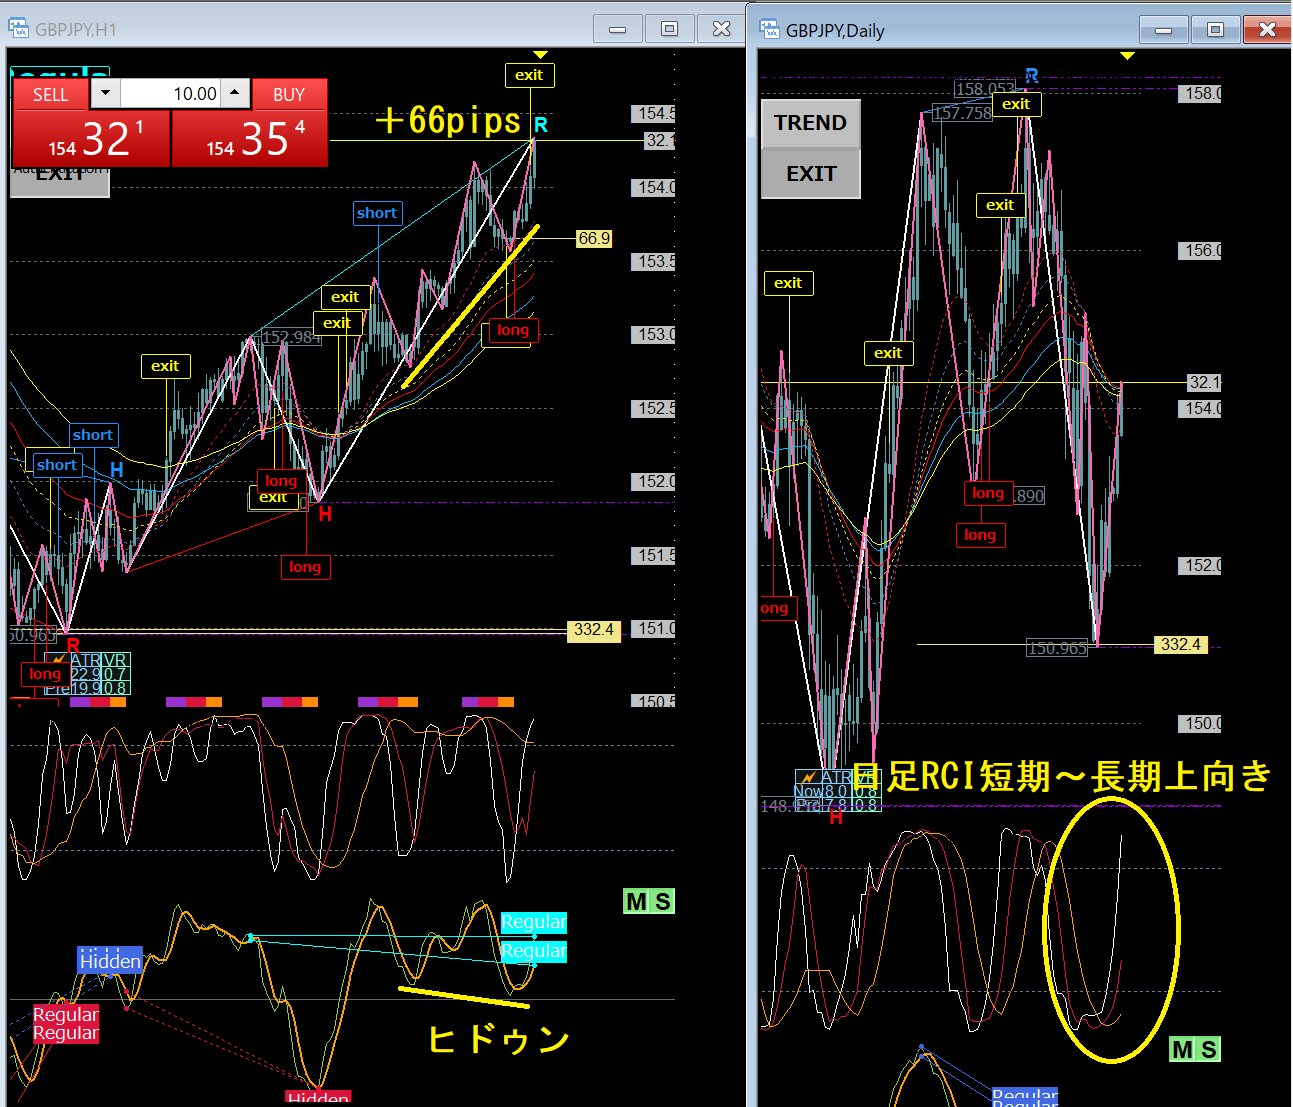
【GBPJPY】 1-hour chart + 4-hour chart divergence as the basis 15-minute chart scalper short from the 15-minute RCI upper band ※On the 1-hour chart there are also short signals
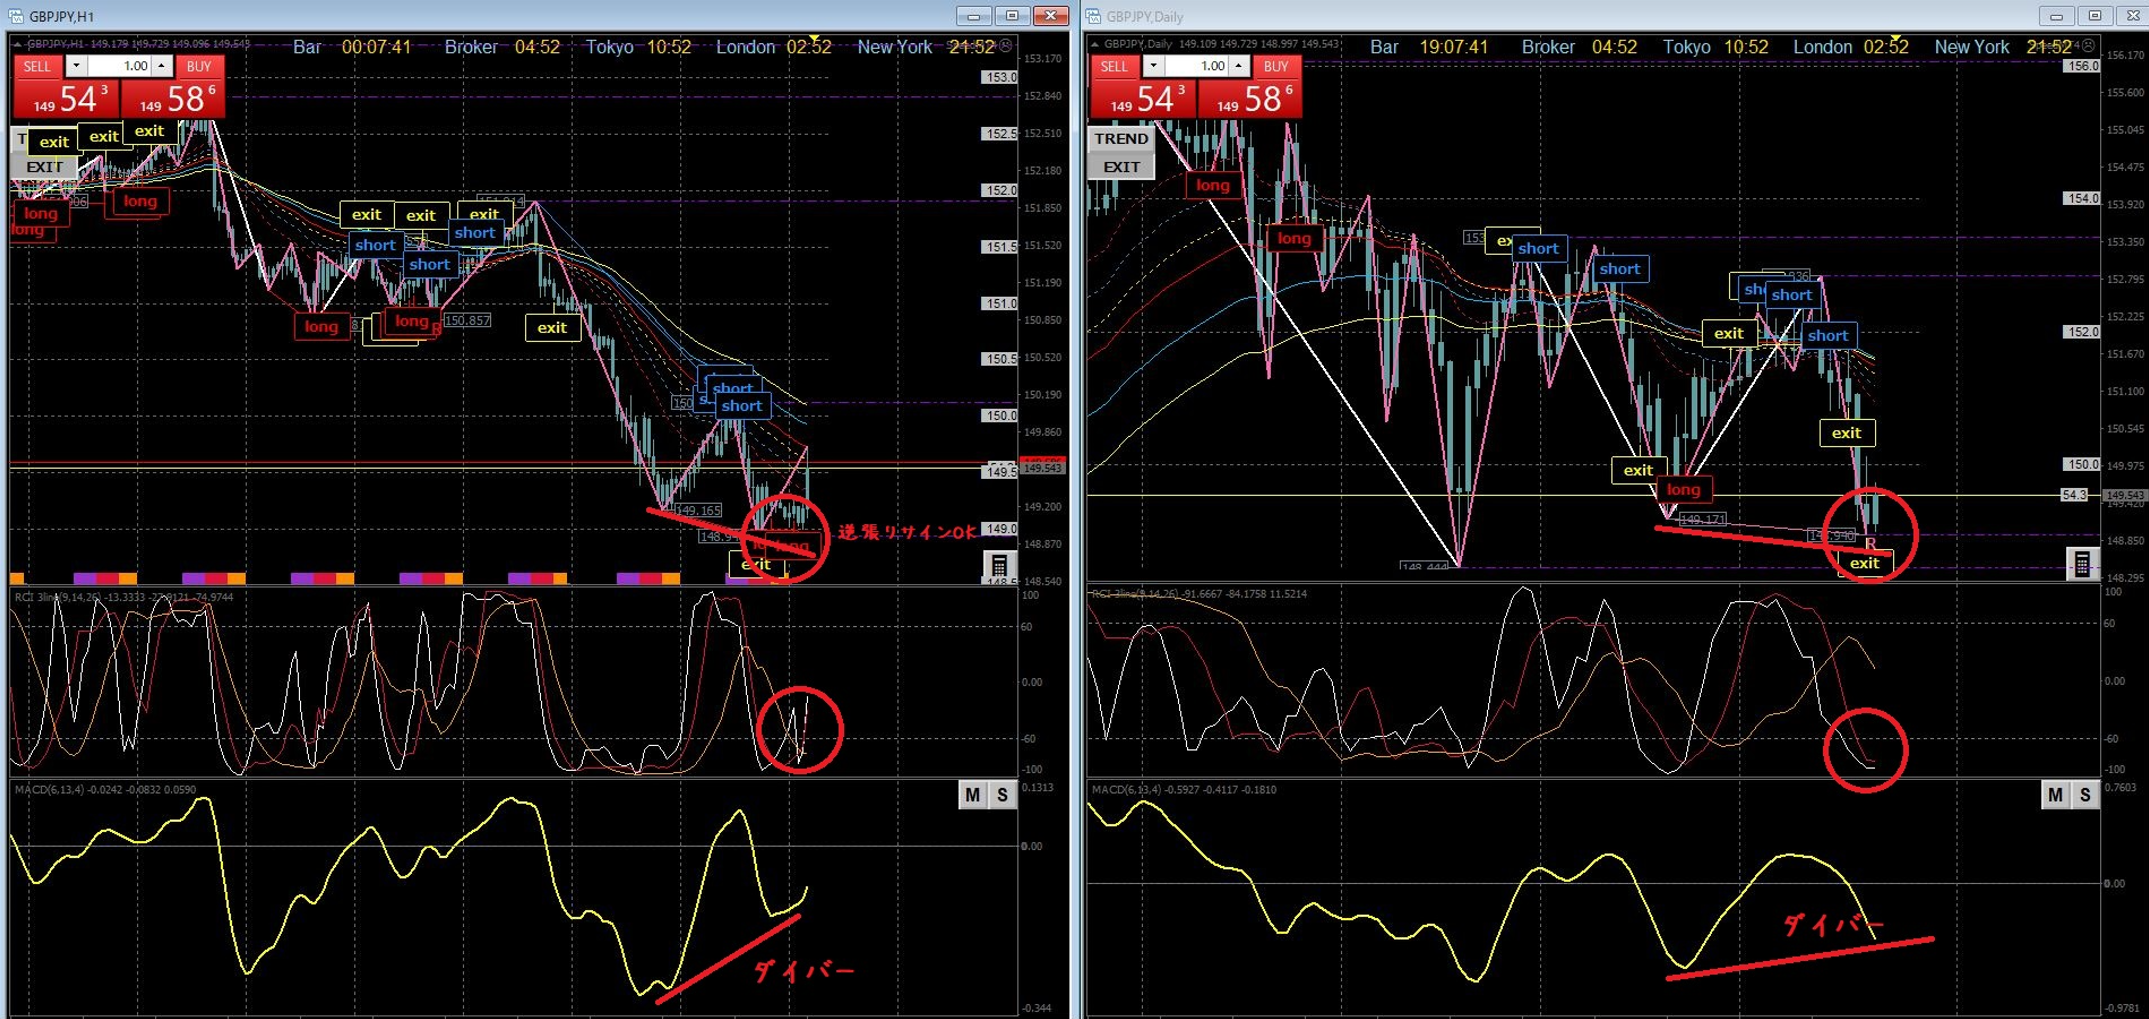
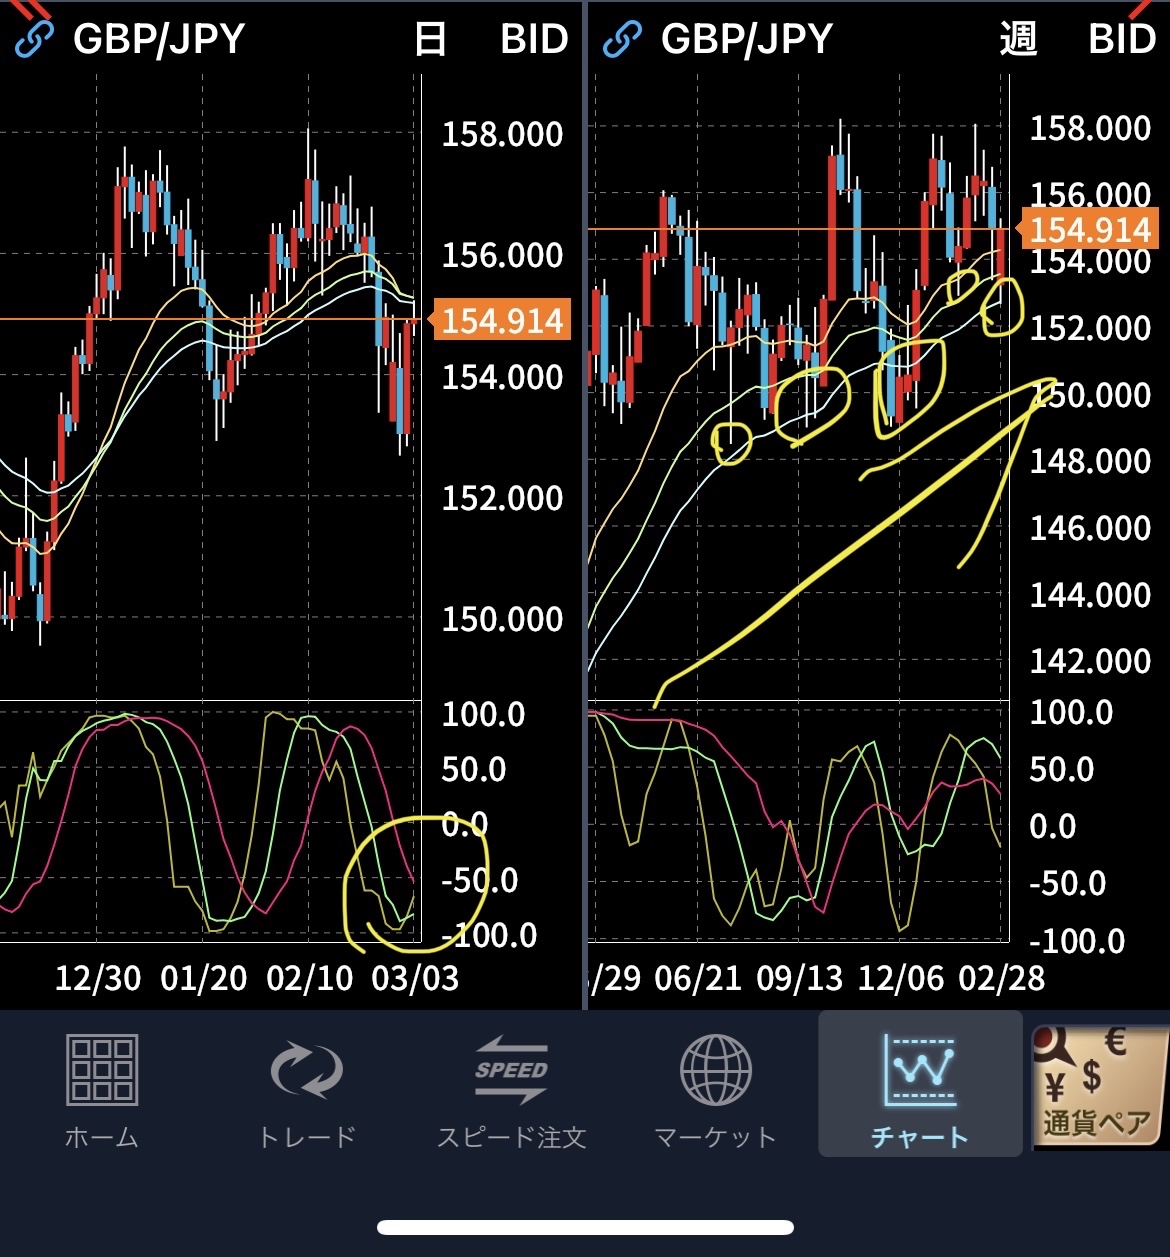
【GBPJPY】 Diagram showing that a contrarian buy signal is OK on the daily and 1-hour charts. ① Deviating as much as possible from the EMA ② Recent price action, large declines or advances (steep angles and straight waves) are important
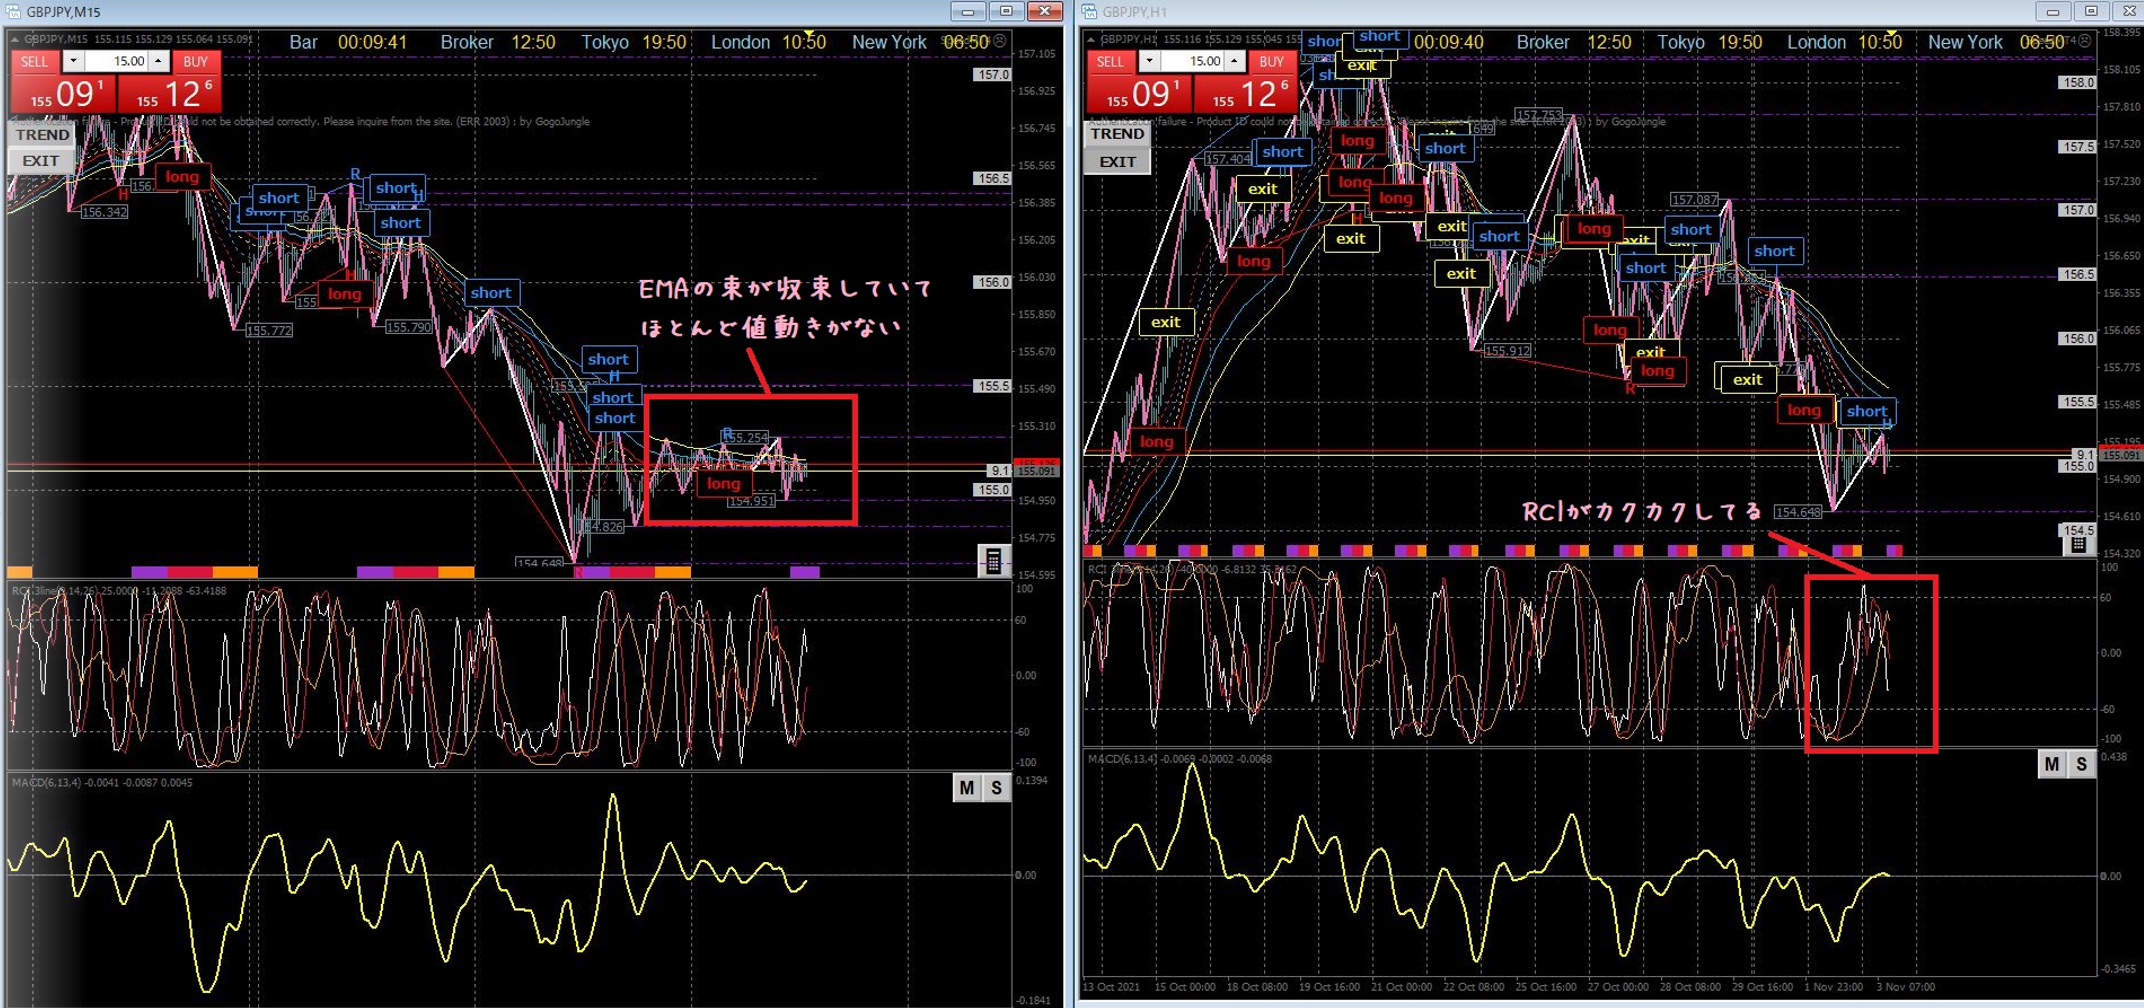
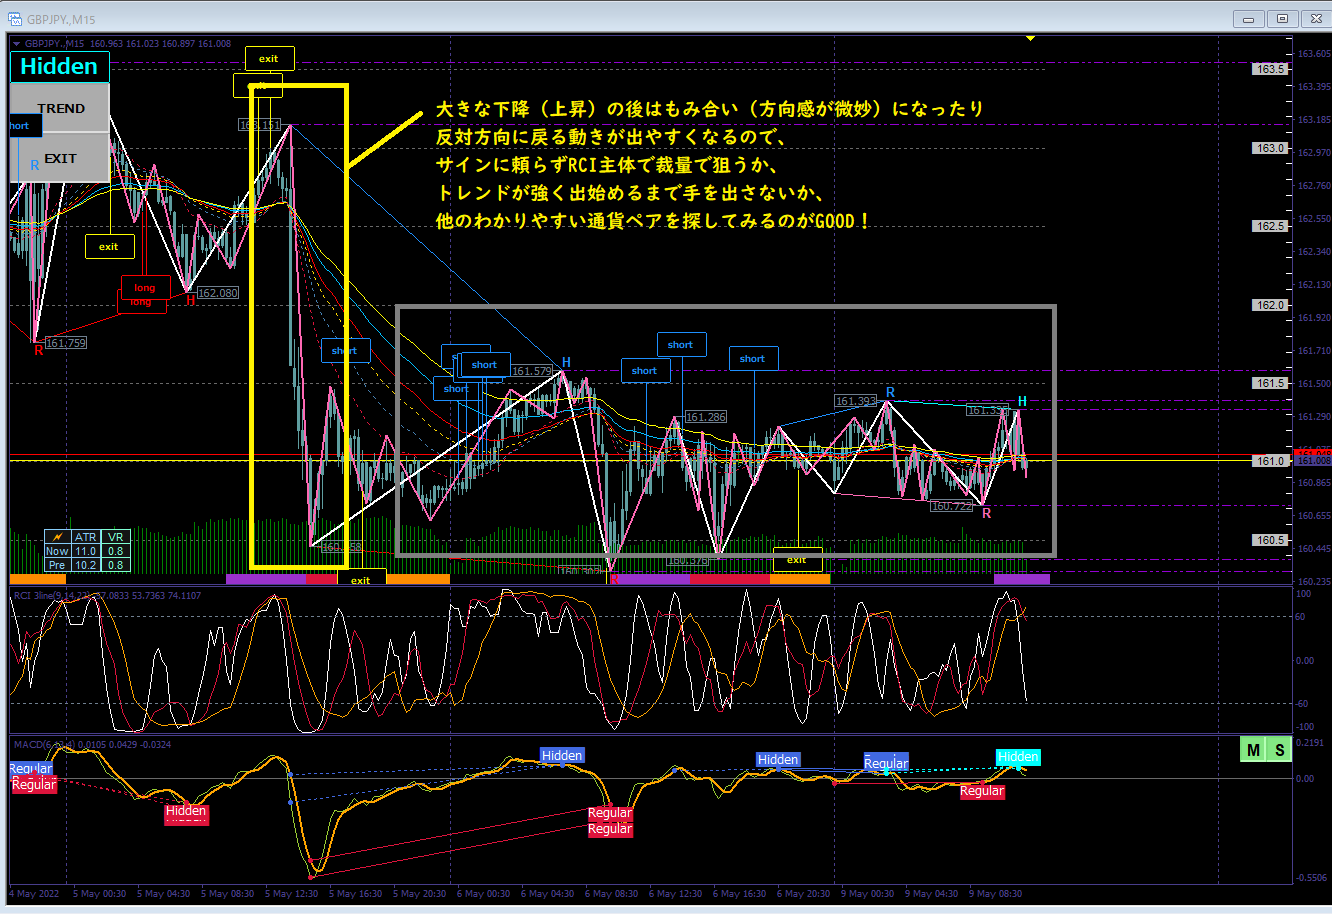
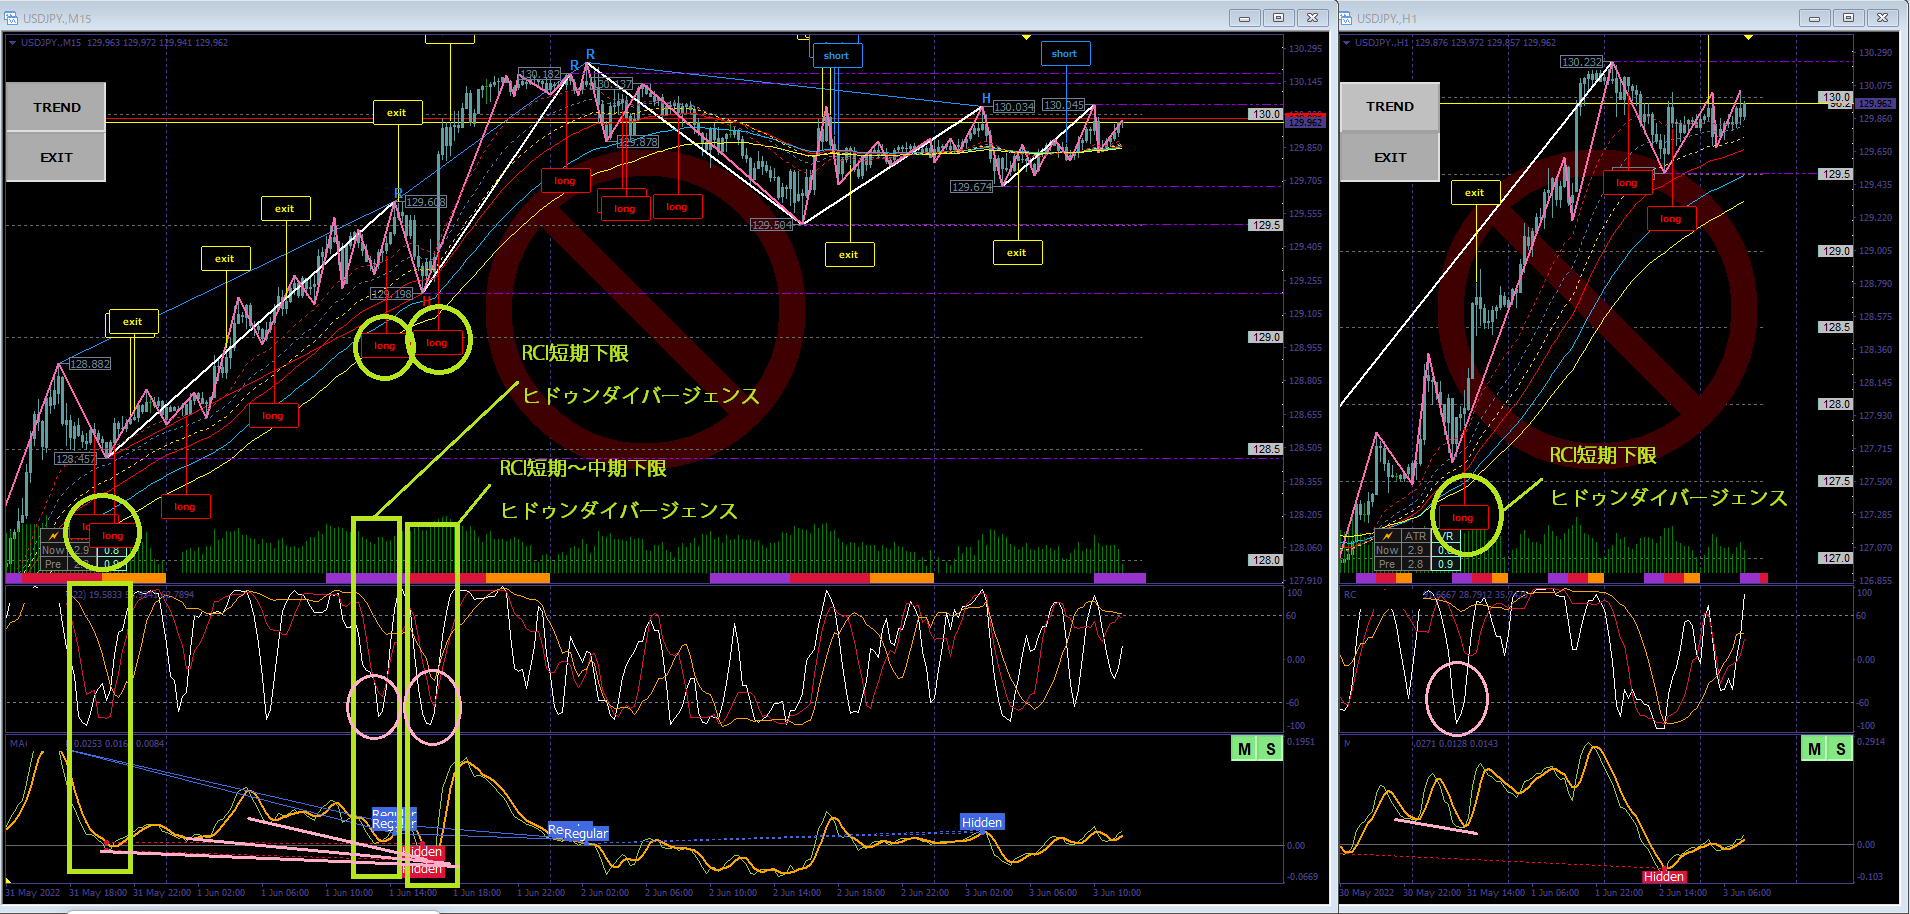
【GBPJPY】 In such market conditions, it is safer to avoid trading. If you rush to make money every day, some people force trades even in subtle areas, but not losing money in odd places is key to making money quickly, so please inspect past charts for similar areas and verify
【GBPJPY】
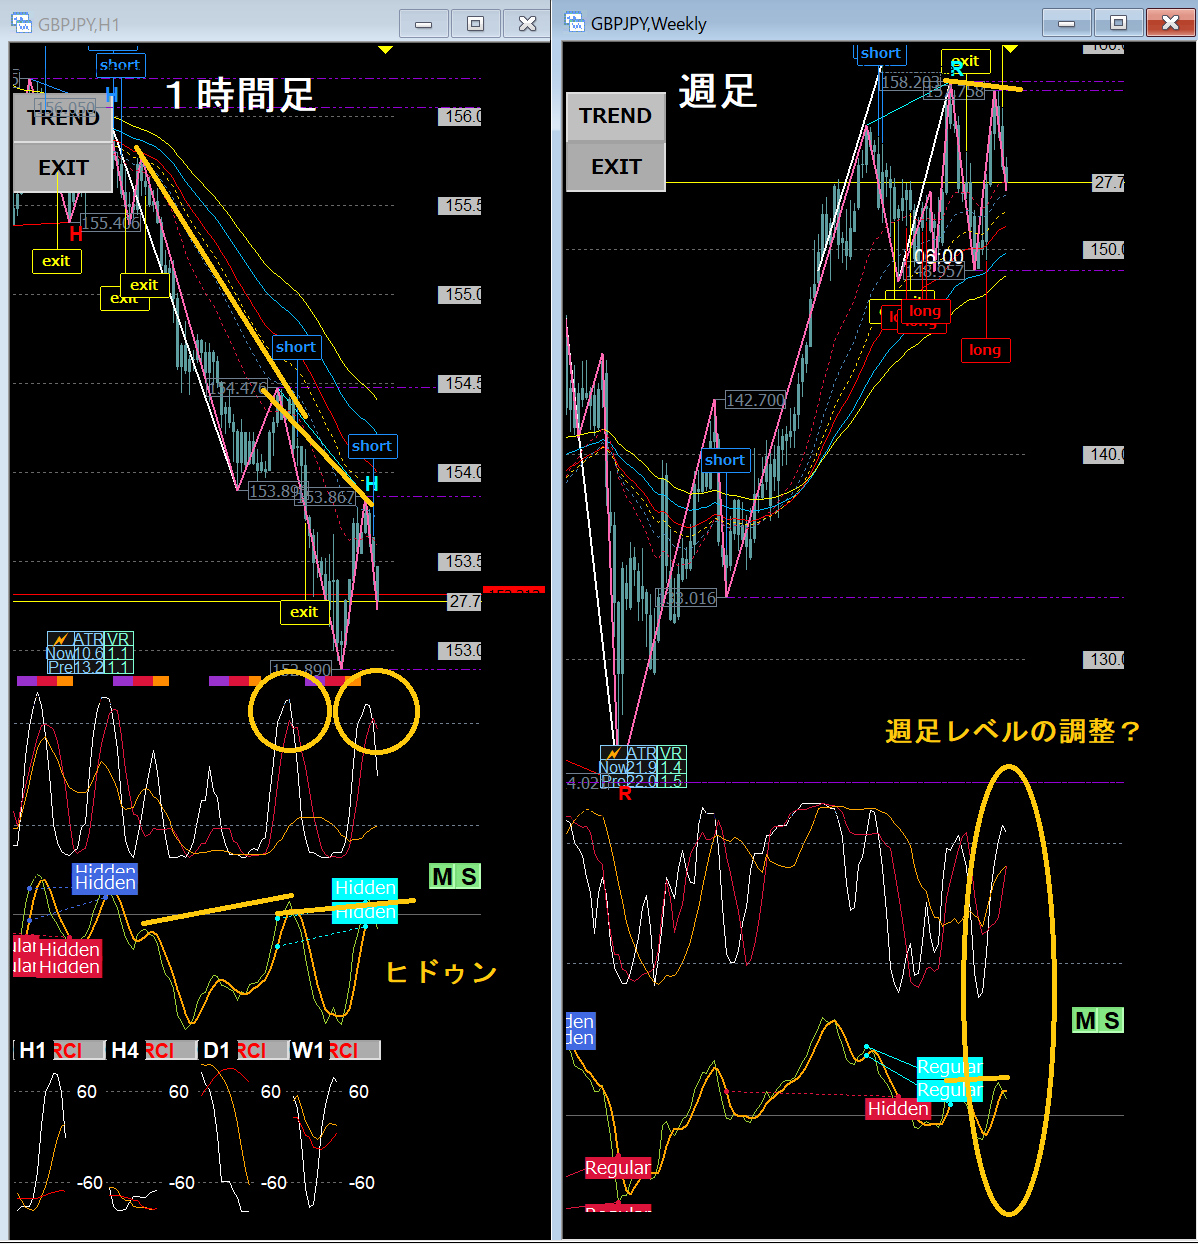
One of the contextual recognitions is that,
when the weekly chart is in an uptrend and a buying Grand Bull pattern is formed, and on the daily chart the RCI reaches the lower band, or there are other reasons to buy, it tends to rise sharply. In such cases, even if the RCI on the lower timeframes reaches the upper band, you should ignore it and let it rise a few times a year, so check the weekly and daily conditions
 and when entering on lower timeframes, align with the direction started on the weekly to daily to minimize accidents.
If the higher timeframes are rising and are in an uptrend, and there is a pullback on the 30-minute or lower chart (including buy signals), that becomes a highly favorable opportunity
Even if you do not trade, capture the charts daily, note what you notice, what fits, and when signals are easier to catch, save and review on weekends to develop the knack (≧▽≦) ※You must do this every day
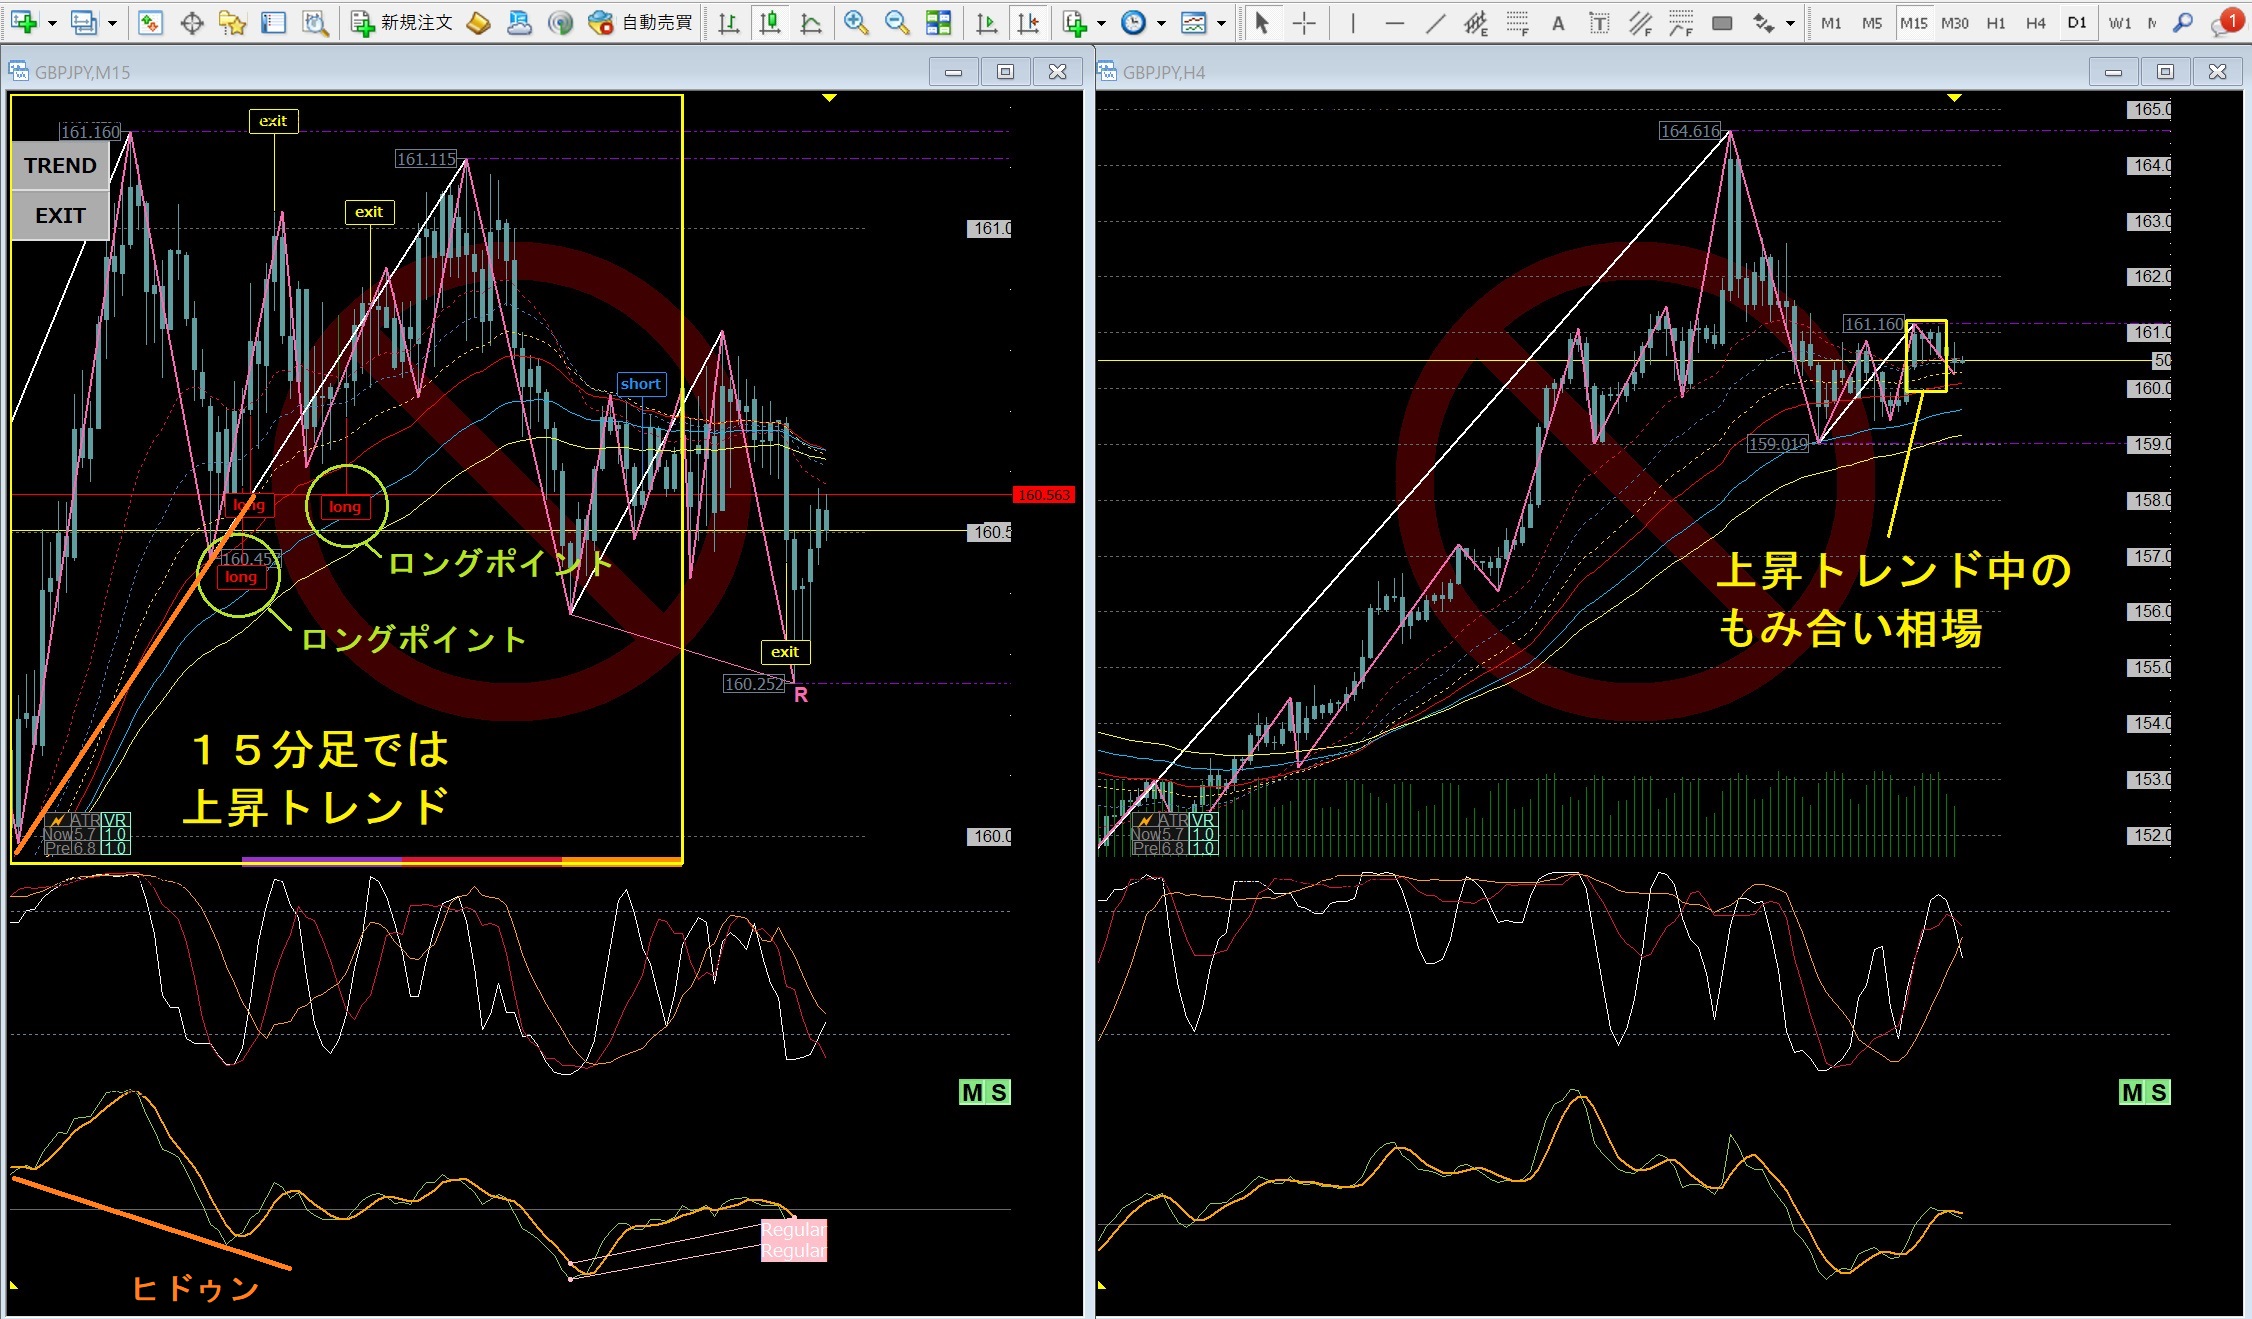
【20220401gbpjpy】15-minute and 4-hour chart ※Long (short) points marked with a circle = the candle body opening price to closing price at the signal
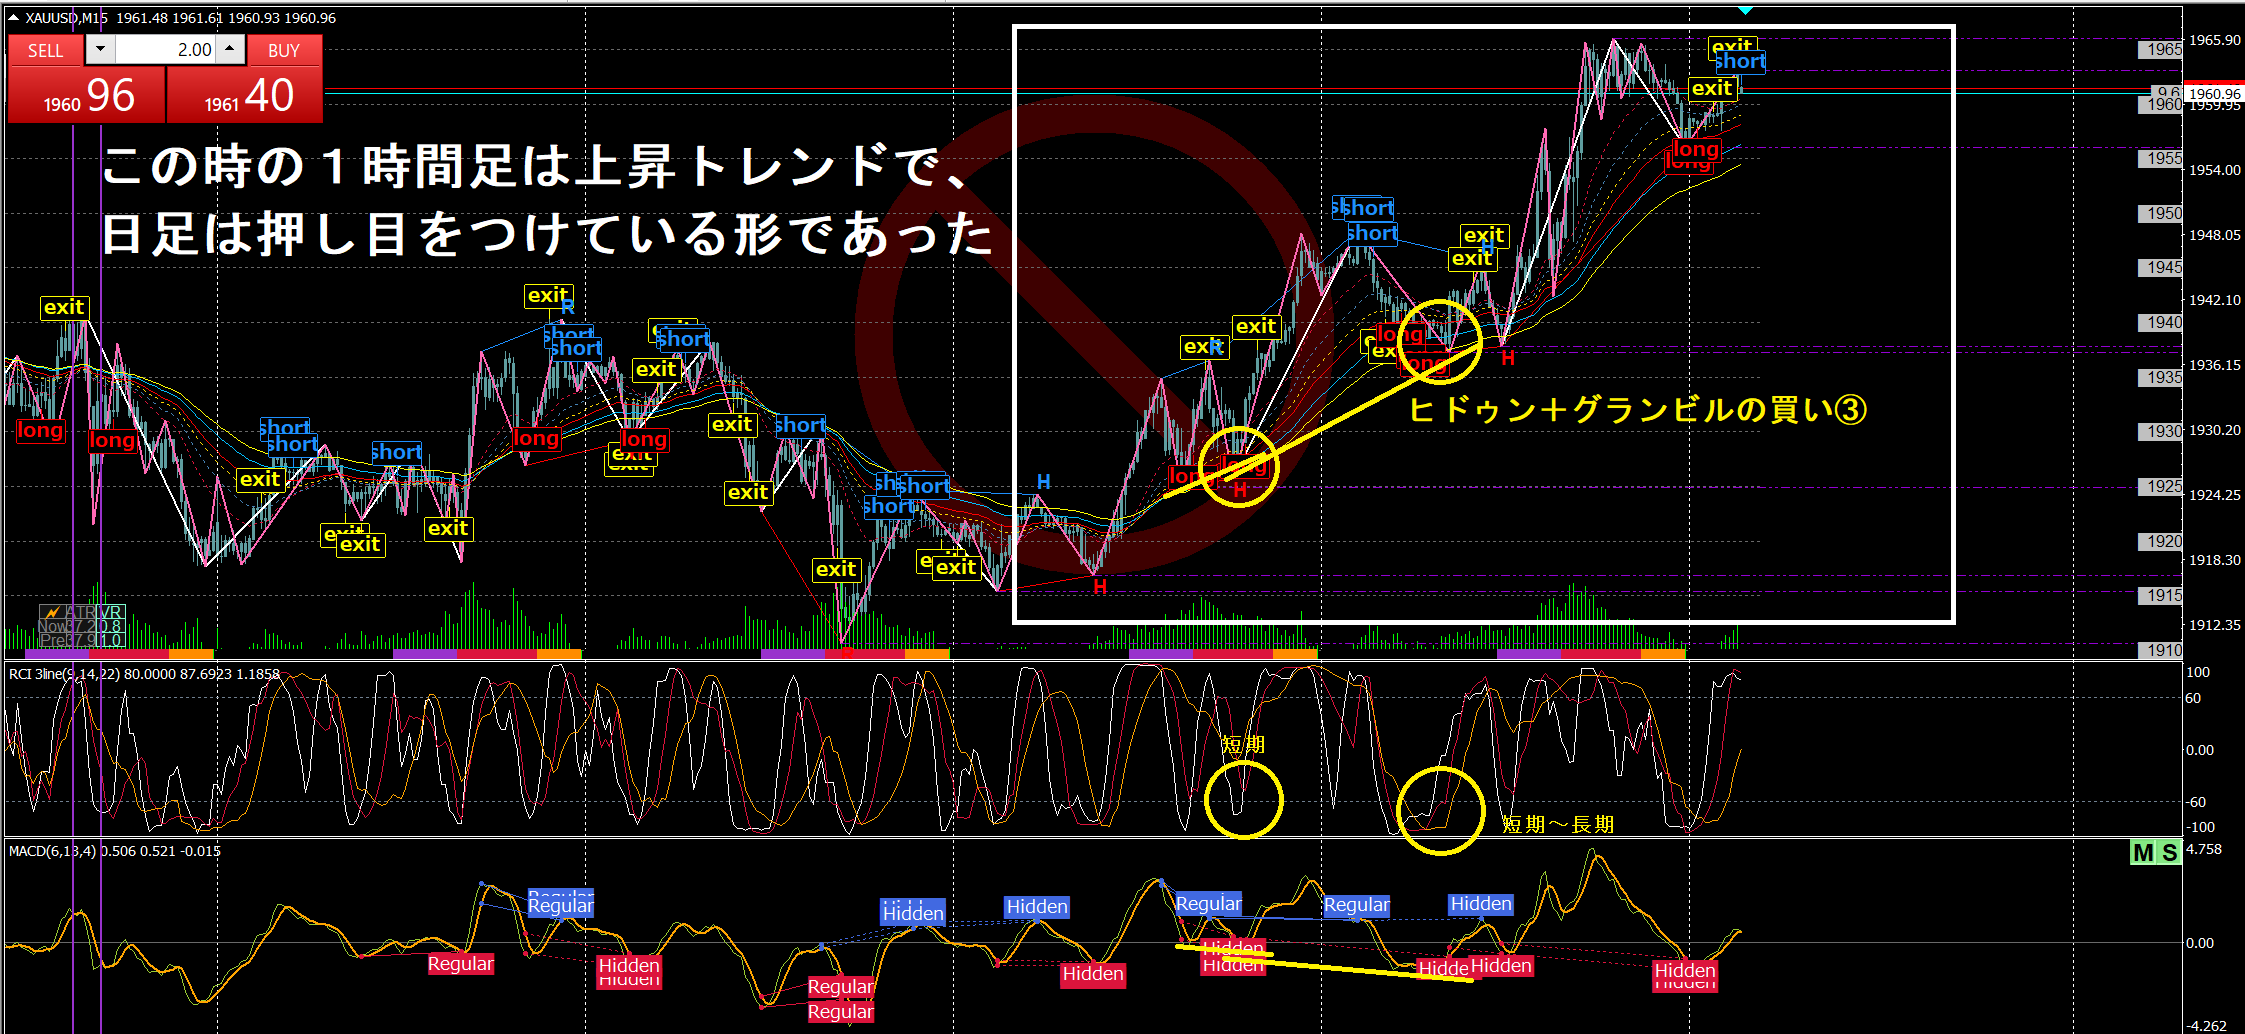
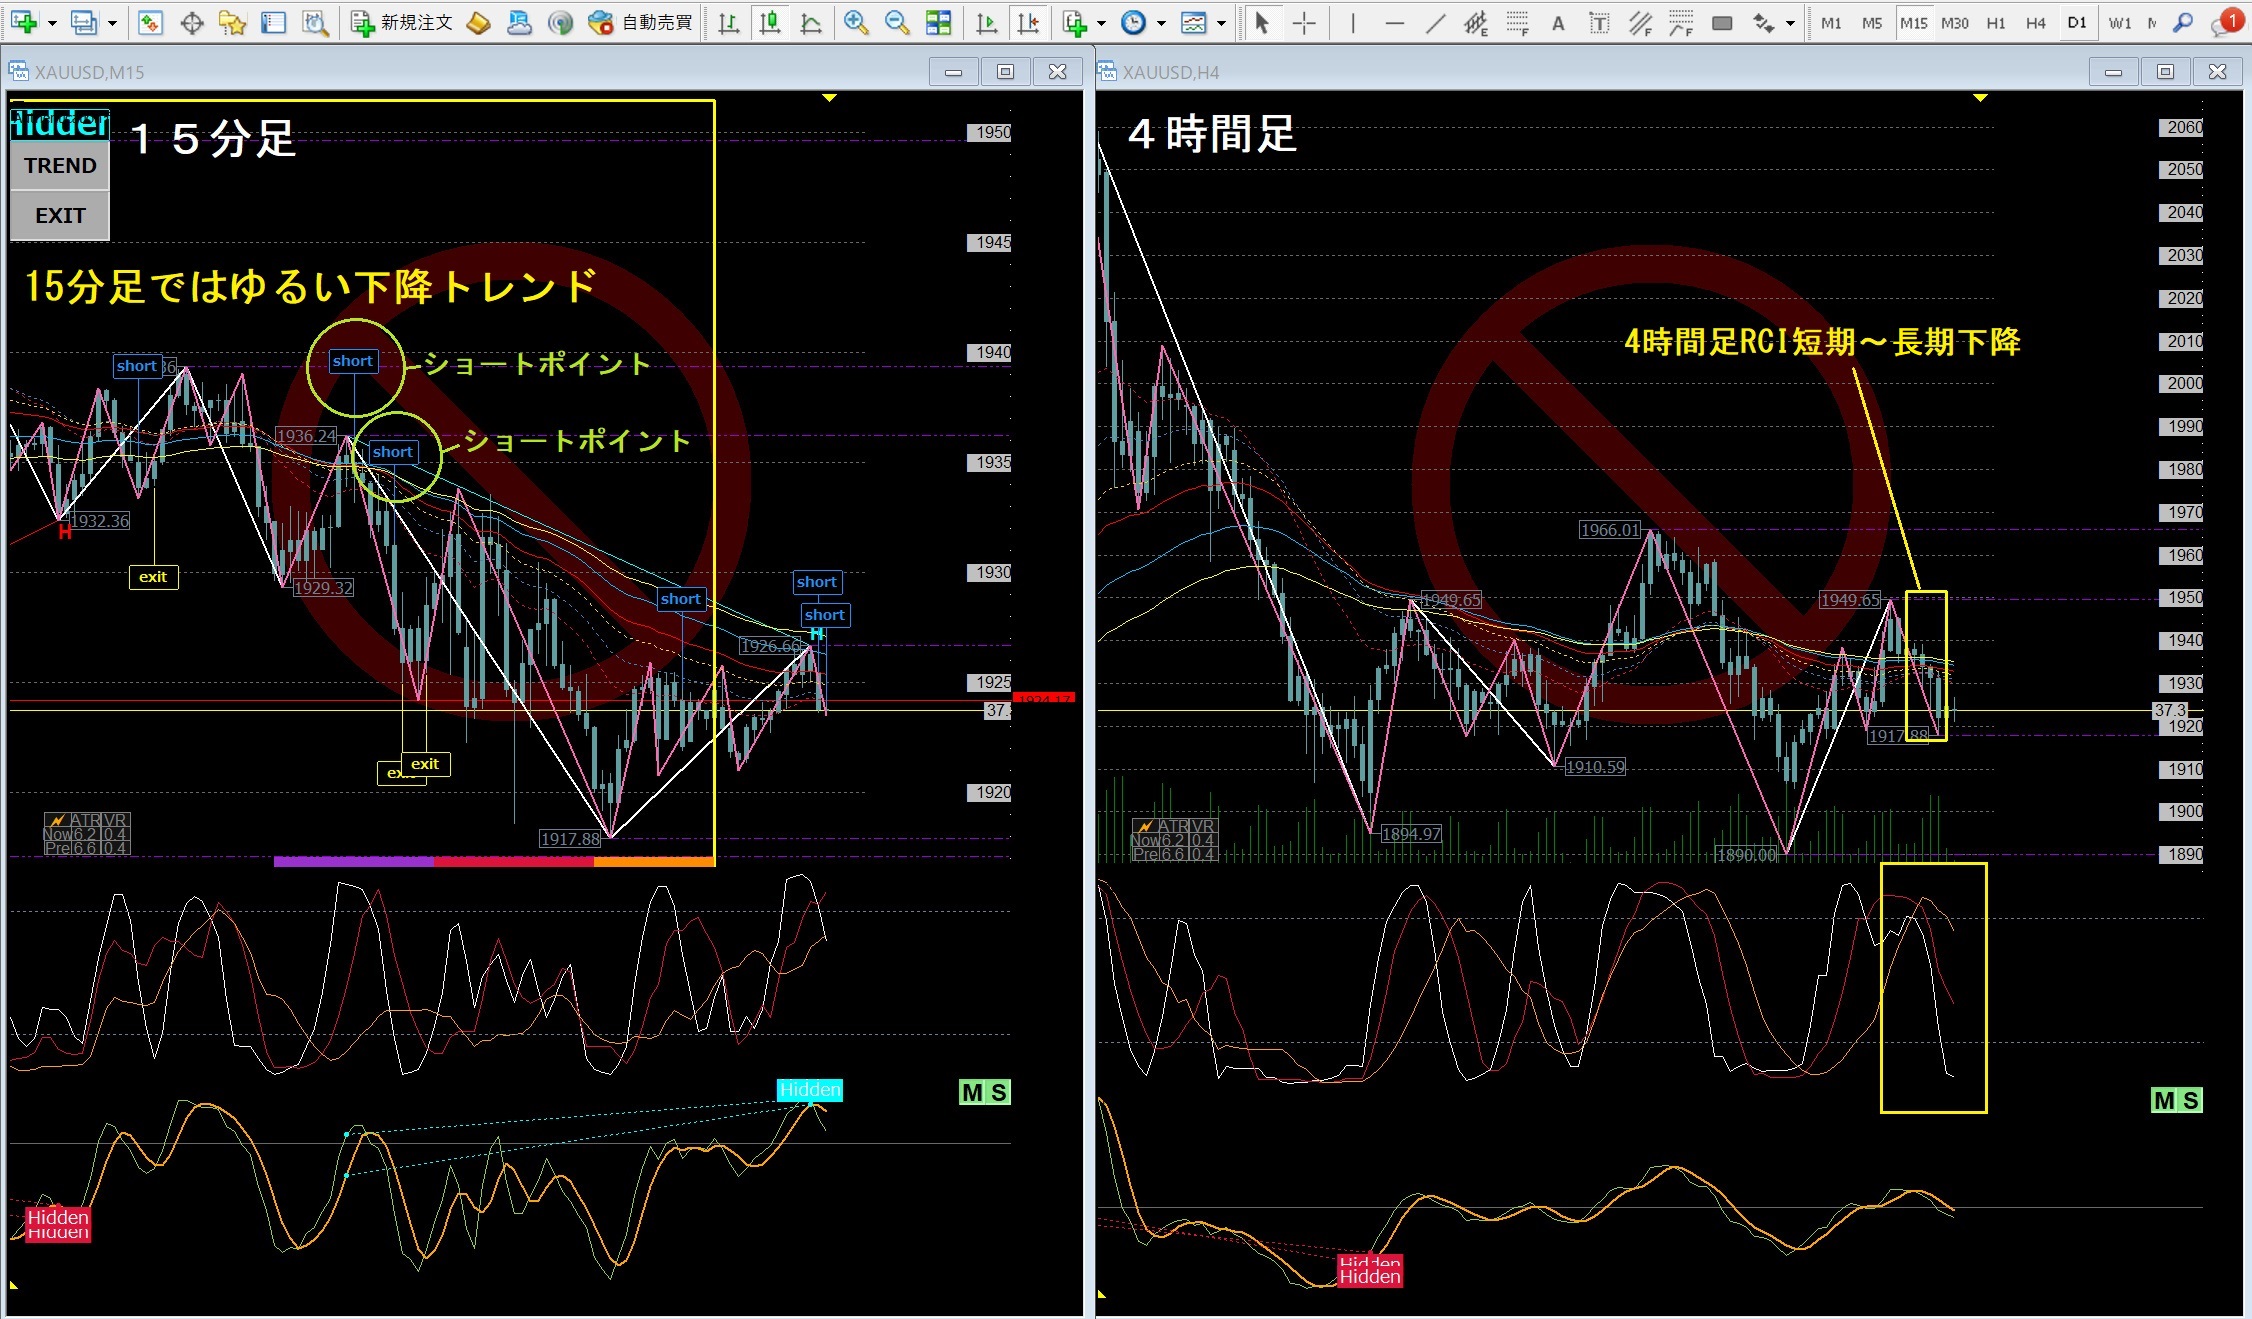
【20220401xauusd】15-minute and 4-hour chart
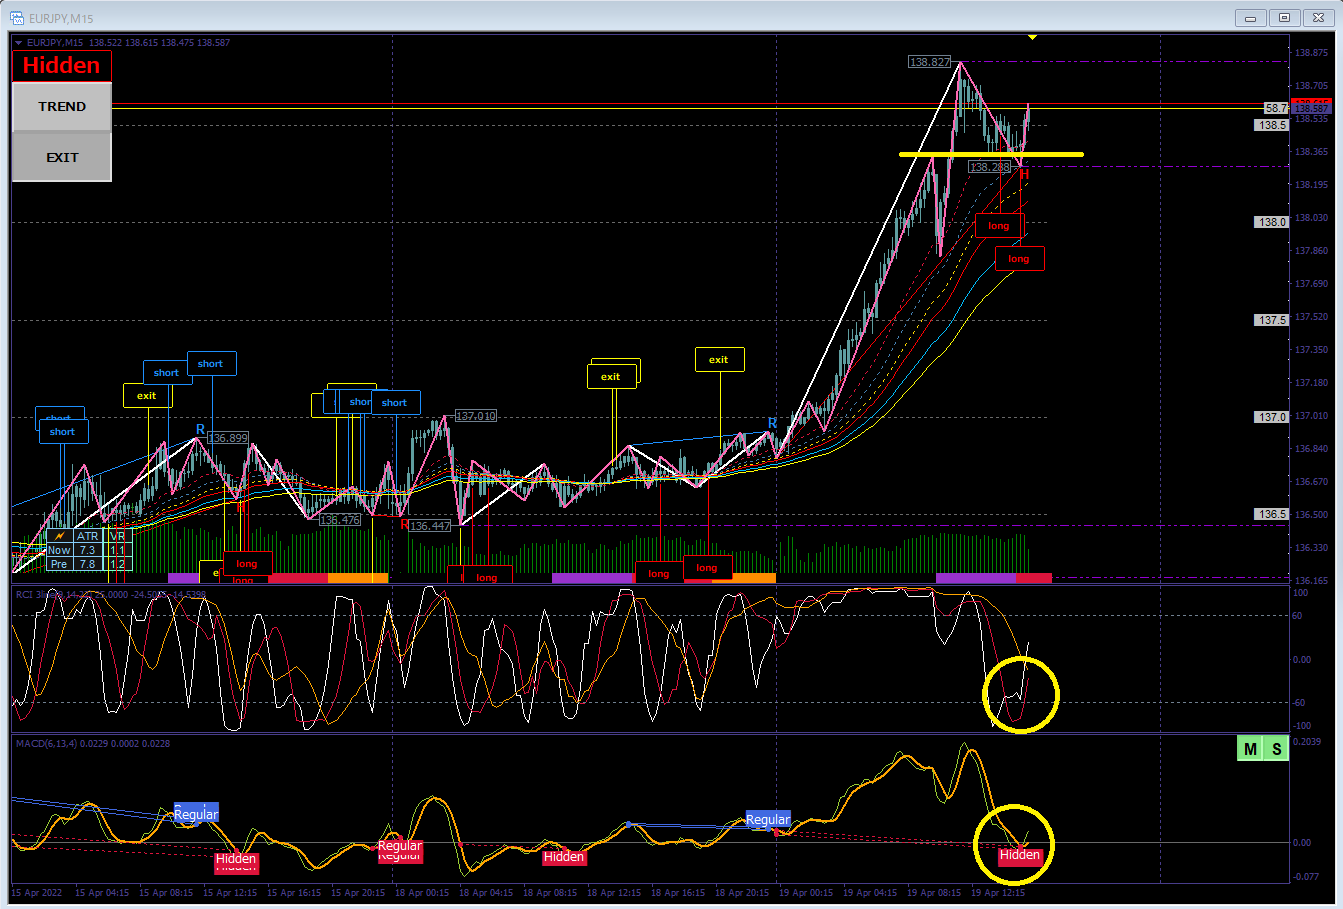
【2022/04/19_EURJPY】15-minute chart These are the targets
【時のサインで狙いやすい時と狙わないほうが良い時】 The signal tool is only a helper, so do not rely on it completely. Develop a habit of considering, with past charts, under what conditions signals are easier to capture and how the accompanying RCI and MACD look when aiming effectively
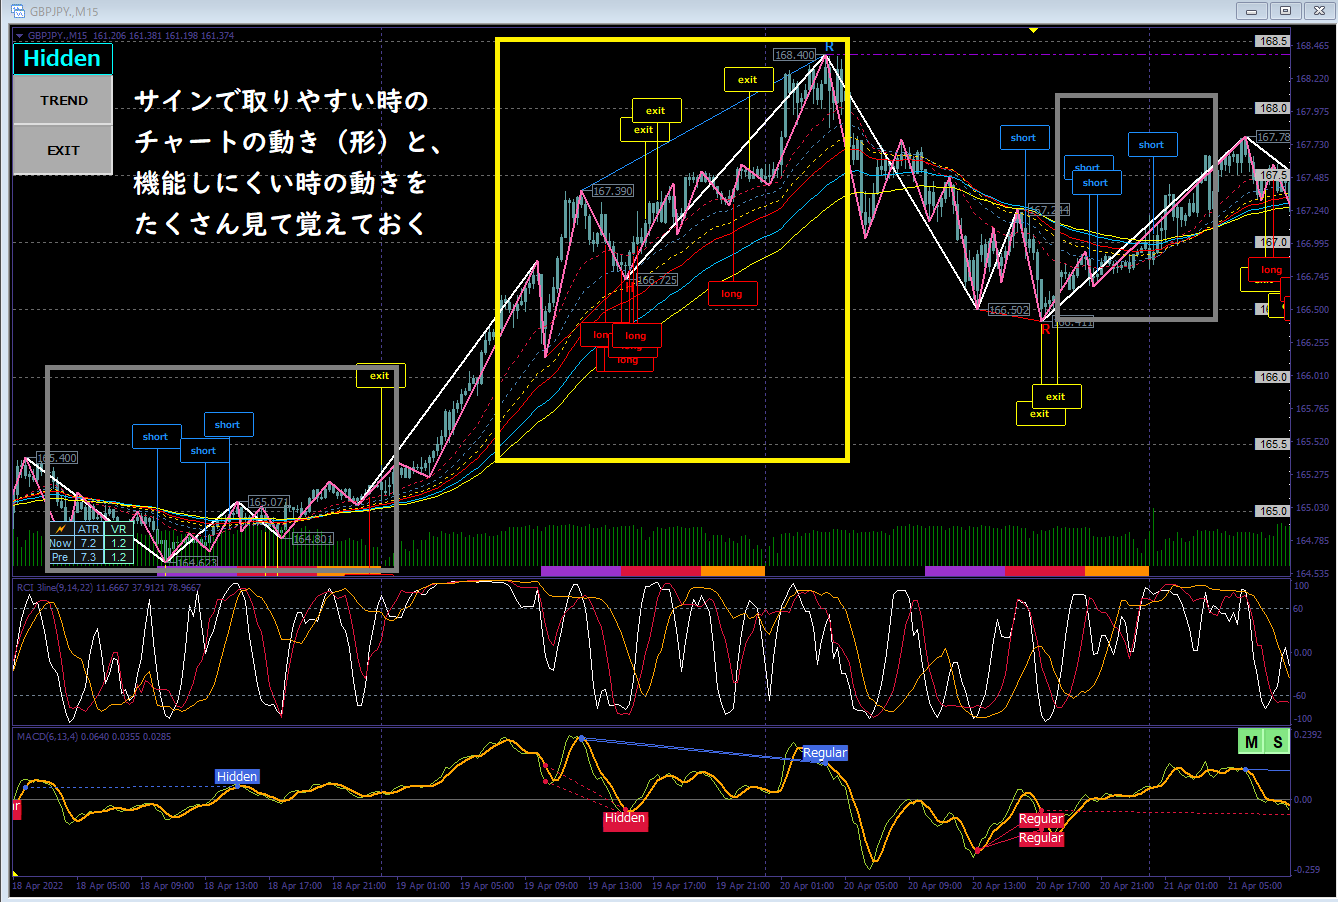
In rough terms
If you cannot use alerts effectively, try focusing on these points (example is 15-minute chart)
If this still doesn’t work, it may be because you are being greedy, cannot wait, or do not understand (please ask questions); trading randomly will be difficult with other methods as well Justified understanding is not enough to be successful; always review past charts to build confidence
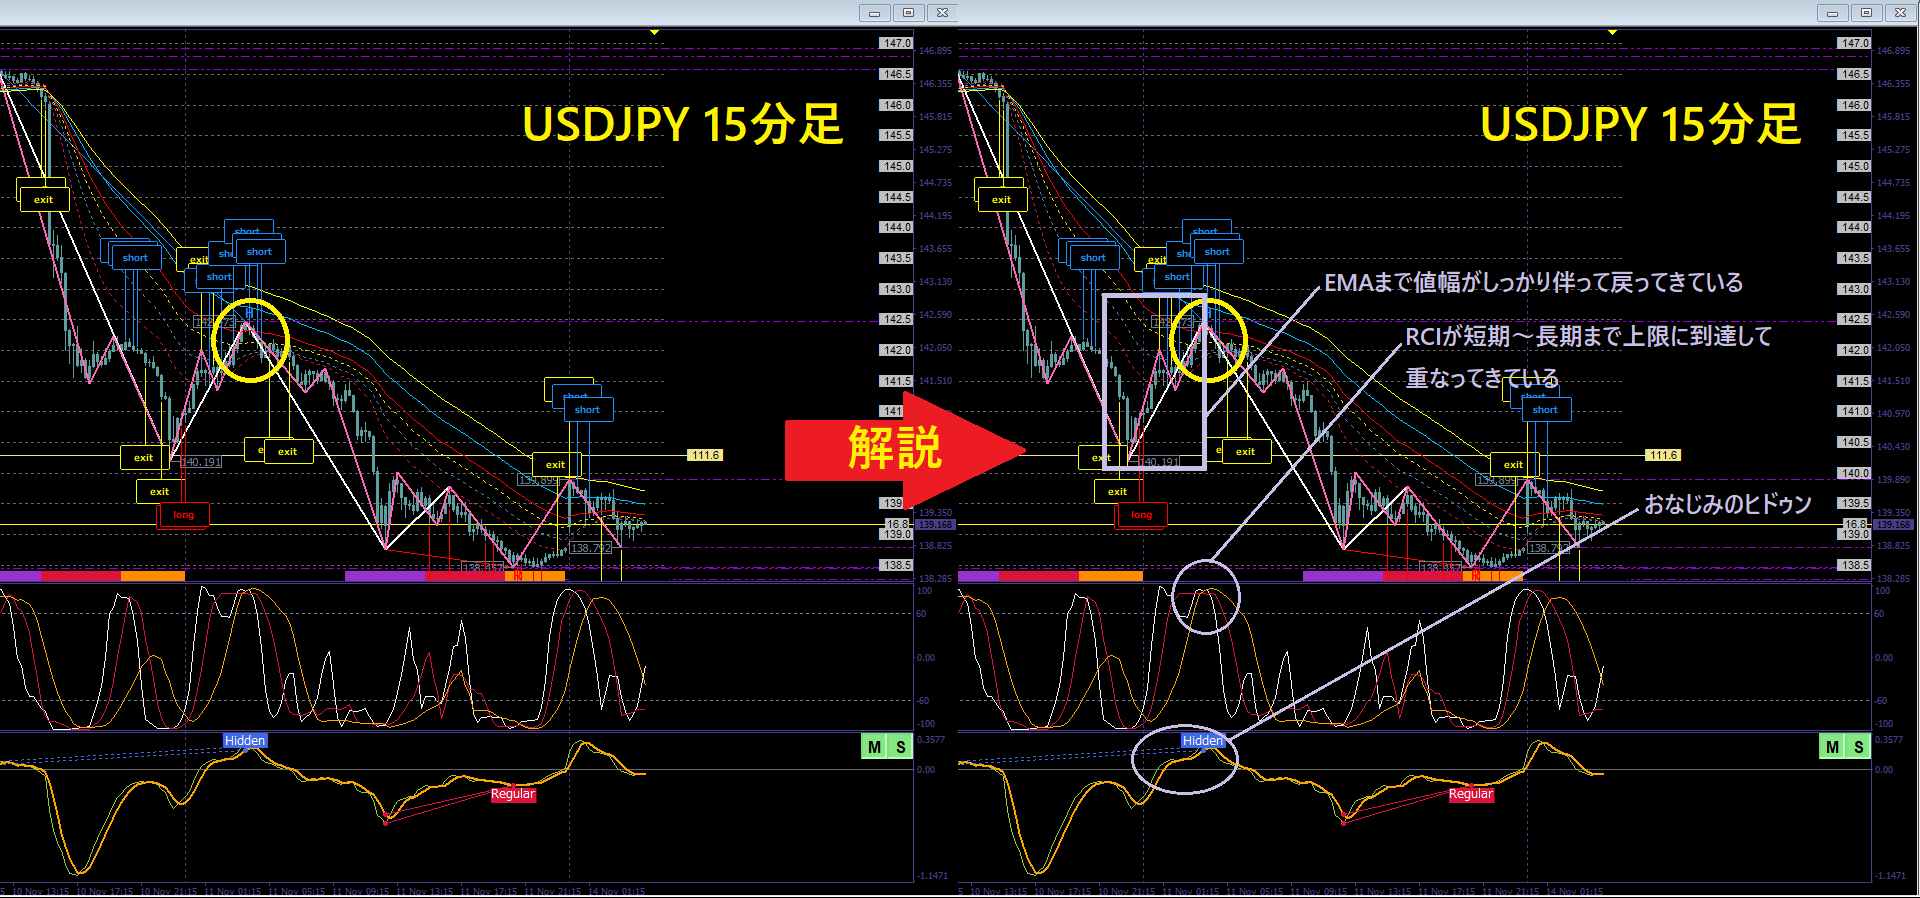
Regarding taking profits, if a higher timeframe seems like it can extend, then extend (e.g., 15-minute entry → exit when the upper side of the 1-hour RCI reaches, etc.)
Essentially, aim to exit when the short- to mid-term RCI of the entry timeframe reaches the opposite side (reference EXIT signals), or consider recent lows for pullbacks in a downtrend; make this a personal default based on what works well
There is no single correct method to exit, so practice and set your own sensible thresholds
Also, it is almost impossible to enter at a perfectly non-reversing moment, so: Manage position sizing with sufficient margin for drawdowns, and enter loosely so that you can take profits if the price moves in the expected direction
If you leverage high and place large positions to quickly grow, even if you try to follow the rules, small reversals can cause losses. This is not a flaw of the method but caused by greed and over-leveraging
I understand the urge to grow quickly and to enter perfectly to avoid reversals; you may resist, but unless you accept and improve, changing methods or tools will only yield temporary wins and then big losses
Everyone faces drawdowns anyway. With high leverage (over-leveraging), the risk of ruin increases even for skilled traders, so it is safer to trade conservatively!
▼ 'MochiPoyo Alerts'
https://www.gogojungle.co.jp/tools/indicators/31600
▼ 'MochiPoyo Pattern Collection' A complete discretionary entry pattern collection maximizing RCI
https://www.gogojungle.co.jp/tools/ebooks/34715
▼ 'MochiPoyo MACD Divergence Signals'Divergence and hidden divergence alerts. Basis for pinpointing market reversals
https://www.gogojungle.co.jp/tools/indicators/36030