

The Use of the “Visualization Indicator” (Part 191)
"Visualization Indicator" usage (part191)
1. Further evolve the "28 Currency Pair List Indicator" into an indicator
"8CPVisualization Indicator"to drawGBPNZD.
"8CPVisualization Indicator"Oceania版,London版,NewYork版,AnyCP版があります。今回は、AnyCP版を使いました。

The upper half is the 15-minute chart forGBPNZD. The lower half is from the "8CPVisualization Indicator"; the green graph corresponds toGBPNZD.
There was a buying opportunity on Thursday. Buy when the indicator graphs break upward, and exit at the top. About150pips of profit was earned. It’s enough to focus on taking positions only when the trend momentum is strong, rather than trying to take everything.
If you use TrendLine-EX, entries and exits can be automated with diagonal trendline breaks. You can simply leave it as is for easy trading. TrendLine-EX is a semi-automatic EA that can automatically sell on trendline break and automatically exit on trendline break above.
2. Best SelectTry the Indicator
The following figure is a screenshot taken on2025 year3 month18 day00:14 (JST).

[Total]Values are sorted in descending order. The top one,NZDUSD, displays blue color on all timeframes.Total value is3767.92, a positive number.NZDUSD indicates an upward trend.
Now, let's look at theNZDUSD chart.
The red arrows indicate the points where the screenshot was taken. It captures the sharp rise during the middle of an upward trend.

"28 Currency Pairs Best Select Indicator" makes it easy to identify which currency among the 28 pairs is experiencing the strongest trend. It also tells you whether you should trade now with numeric and color cues. It’s an excellent indicator to assess all currency pairs at a glance.
"28 Currency Pairs Best Select Indicator"

https://www.gogojungle.co.jp/tools/indicators/35128
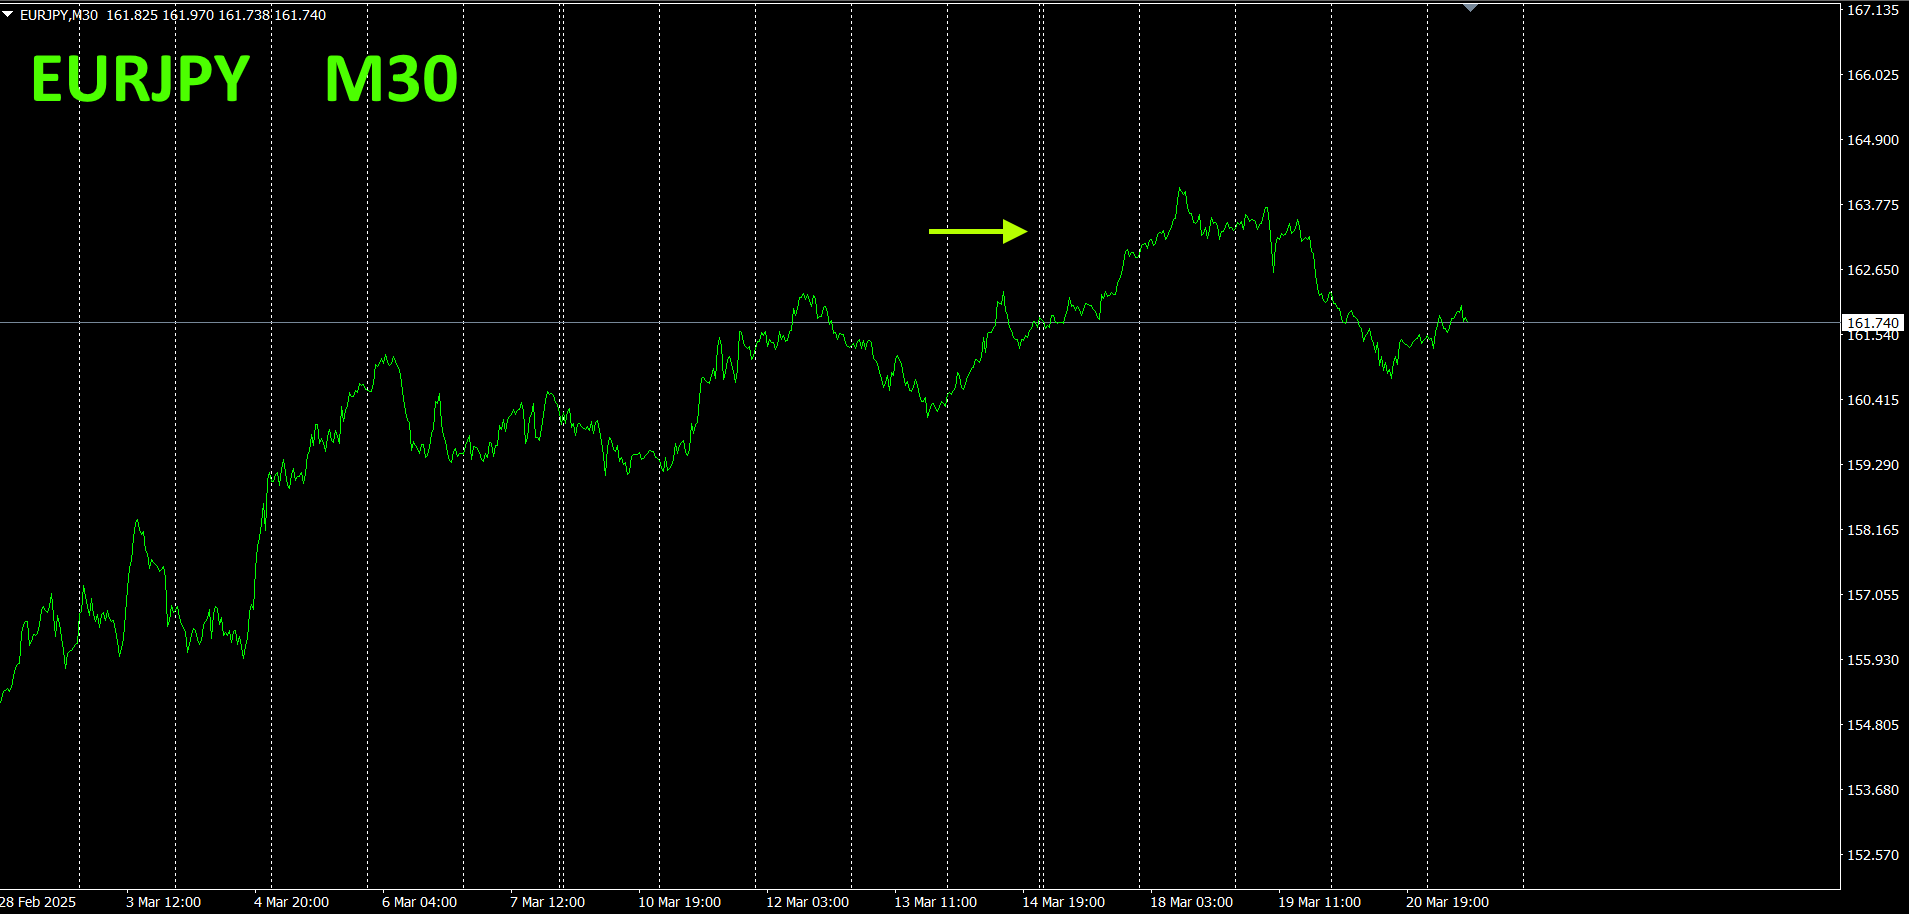
3. 2021 Year5 month onwardEURJPY movement?
2021 Year5 month onwardEURJPY movement?
To see the overall trend, a30 minute chart covering roughly the last3 weeks is drawn.
Previously, I wrote as follows.
Pink indicatesEUR, green indicatesJPY. In the currency strength chart, is also down, and the angles are almost the same. In terms of currency strength, > . So far, there is no clear directional bias.
There appears to be a wavering, with a slight up-right tendency.
30 minute currency strength chart.
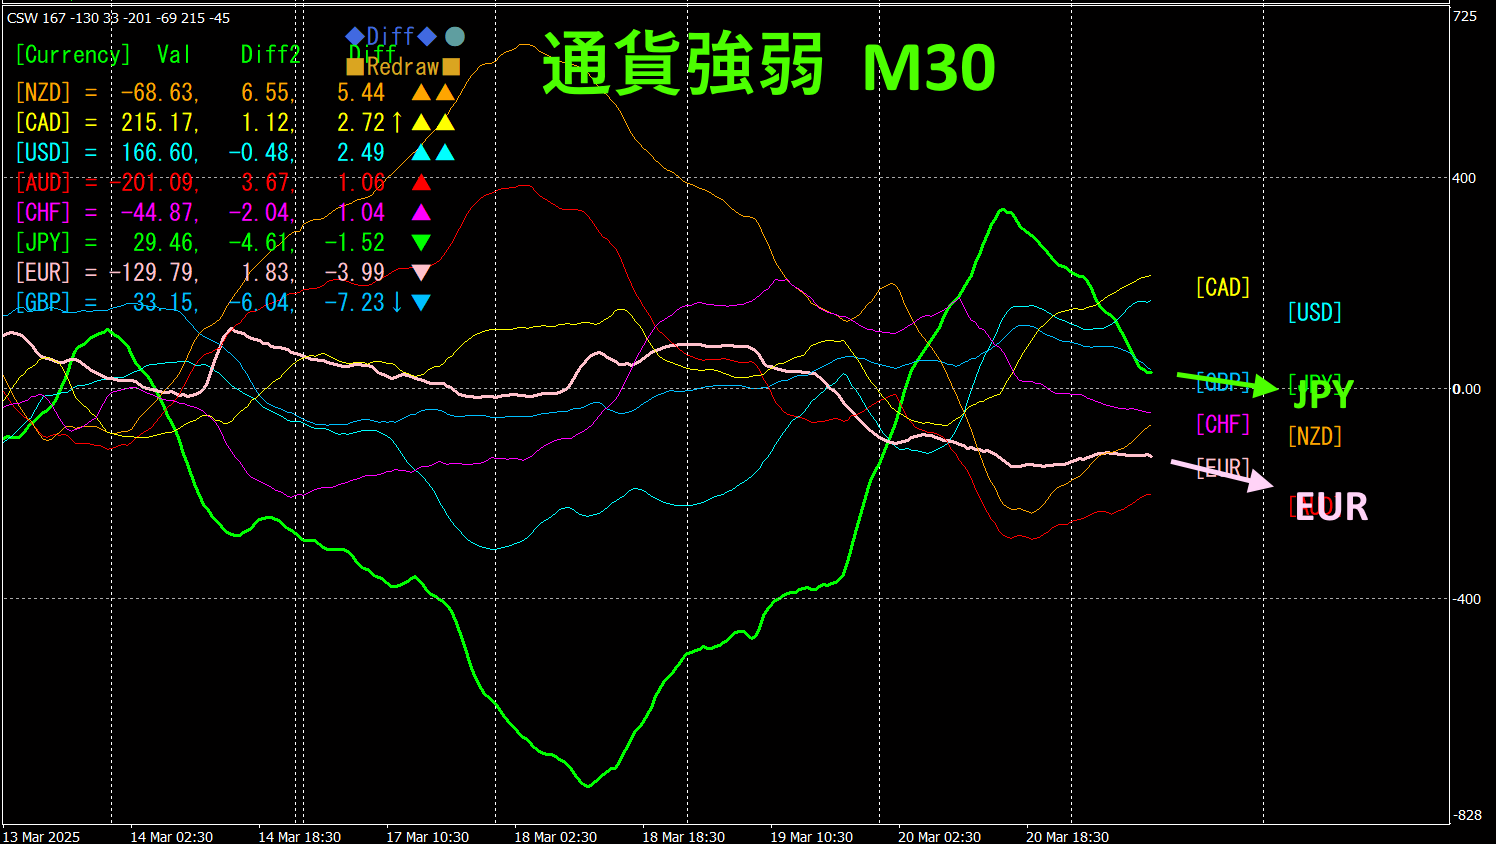
Pink indicatesEUR, green indicatesJPY. In the currency strength chart, and both trend downward with similar angles. In currency strength, is the direction. There is no solid directional bias.
4. Using the Visualization Indicator on the daily chart
The figure below shows the 8CP Visualization IndicatorOceania version displayed on the daily chart.
Compared to last time,NZDUSD is still rising, but momentum seems slightly weakening. However, it remains below the zero line and is expected to rise further, soI will keep the long position as is.
Recommended Indicators
“SwapTarget Indicator”

https://www.gogojungle.co.jp/tools/indicators/48183
“Toretore Indicator”
https://www.gogojungle.co.jp/tools/indicators/50115
“TrendLine-EX”


https://www.gogojungle.co.jp/tools/indicators/42257
“8C Currency Strength Visualization Indicator

MT4 version https://www.gogojungle.co.jp/tools/indicators/39150
【My items for sale】


