

Utilization of the "Visualization Indicator" (Part 189)
“Visualization Indicator” utilization (part189)
1. Evolve the “28 Currency Pairs List Indicator” further into an indicator
“8CPVisualization Indicator”to plotUSDJPY.
The “8CPVisualization Indicator” includesOceania version,London version,NewYork version,AnyCP version. This time, I used theLondon version.

The upper half is theUSDJPY 15-minute chart. The lower half shows the results from the “8CP Visualization Indicator”; the green bold line graph corresponds toUSDJPY.
There were two points where other graph groups penetrated below, so I entered sells at those points. Since the trend direction is downward, you just need to consider selling. If the graph of the “Visualization Indicator” reverses, I will exit. Each ended with approximately240 pips and250 pips profits, totaling about490 pips in profit.
If you use “TrendLine-EX,” entries and exits can be automated with diagonal trend line breaks. You can just leave it as is, enabling easy trading. “ is a semi-automatic EA that can automatically sell on a break below a trend line and automatically exit on a break above a trend line.
2. Best SelectIndicator to try
The figure below is a screenshot from2025 year3 month5 day18:32 (JST)

[Total]Numbers are arranged in descending order. The top one,EURUSD, shows blue colors across all timeframes.Total value is5675.12, a large positive number.EURUSD indicates the presence of an uptrend.
Now, let’s look at the chart forEURUSD.
The red arrows indicate the points where the screenshot was taken. It captures an upward move in the middle of an uptrend.

“28 Currency PairsBest Select Indicator” allows you to easily identify which currency among 28 pairs has the strongest trend. It also tells you whether you should trade now or not with numbers and colors. It provides an overview of all currency pairs at a glance.
“28 Currency PairsBest Select

https://www.gogojungle.co.jp/tools/indicators/35128
3. 2021 year5 month onward EURJPY?,
2021 year5 month onward EURJPY?
I have been tracing EURJPY movements since30 minutes chart for roughly3 weeks.
Last time I wrote as follows.
Pink isEUR, green isJPY. In the currency strength chart,JPY andEUR are both downward, butJPY has a steeper decline, so going forwardEURJPY is expected to move downward.
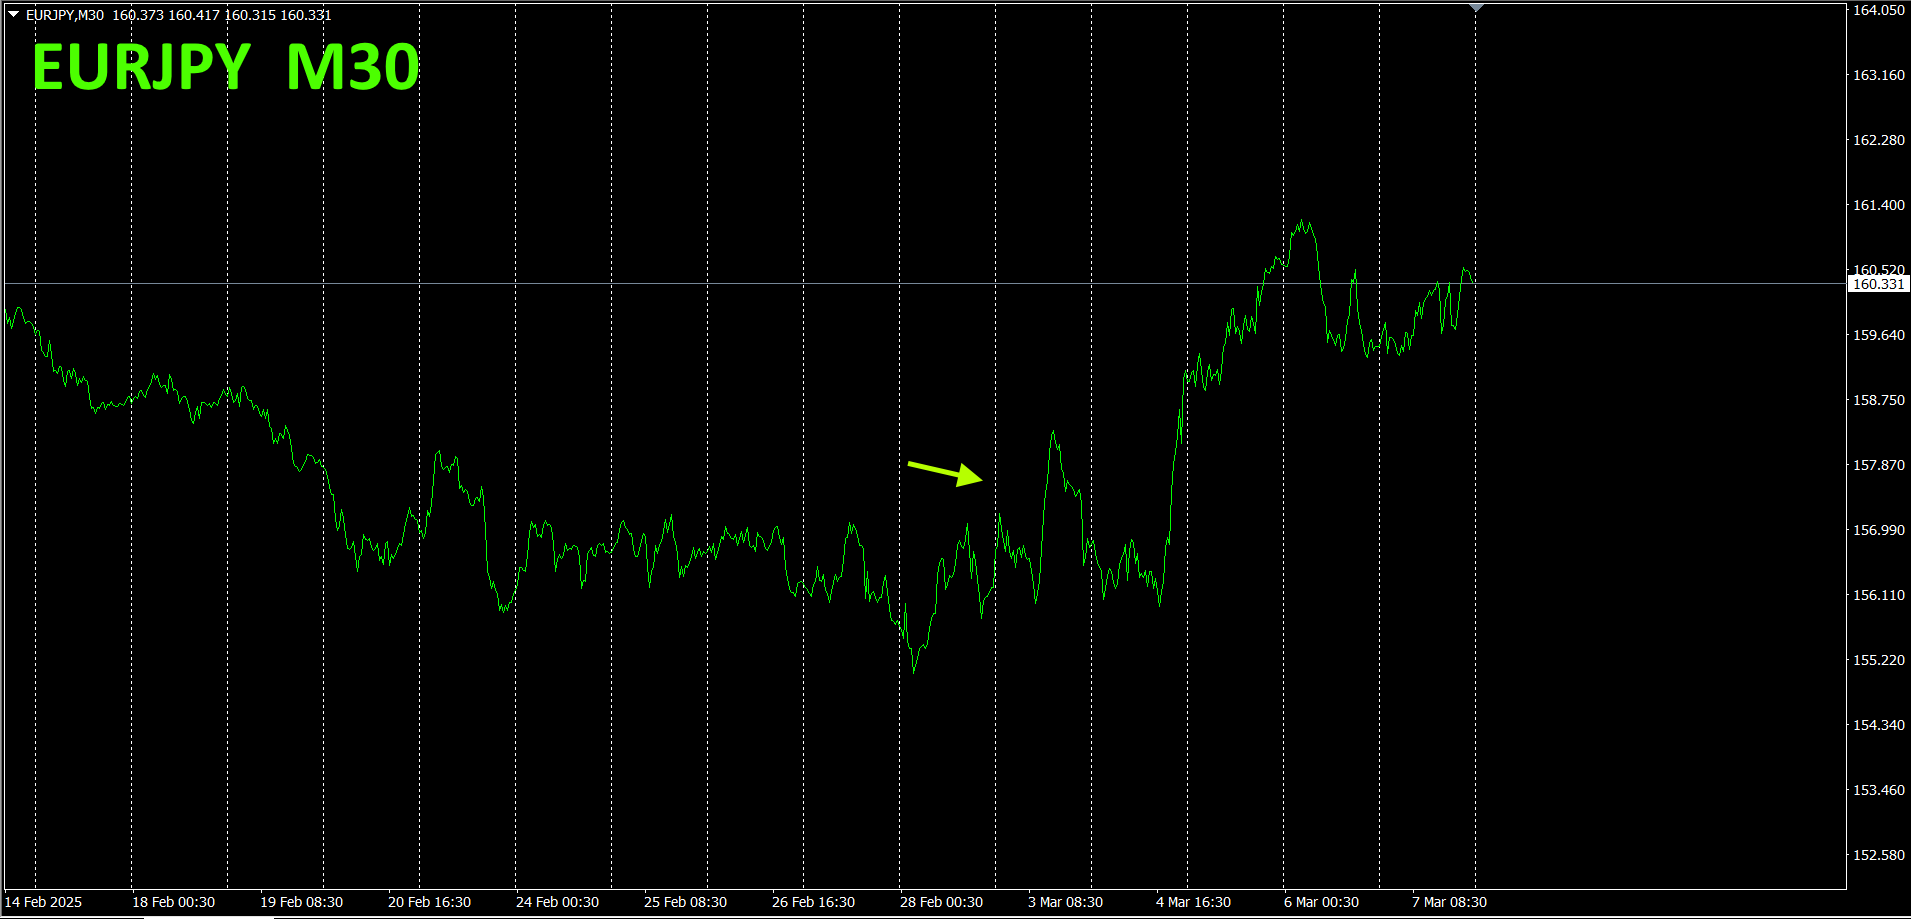
As expected, it did not fall. It rose slightly.
30 minutes currency strength chart.
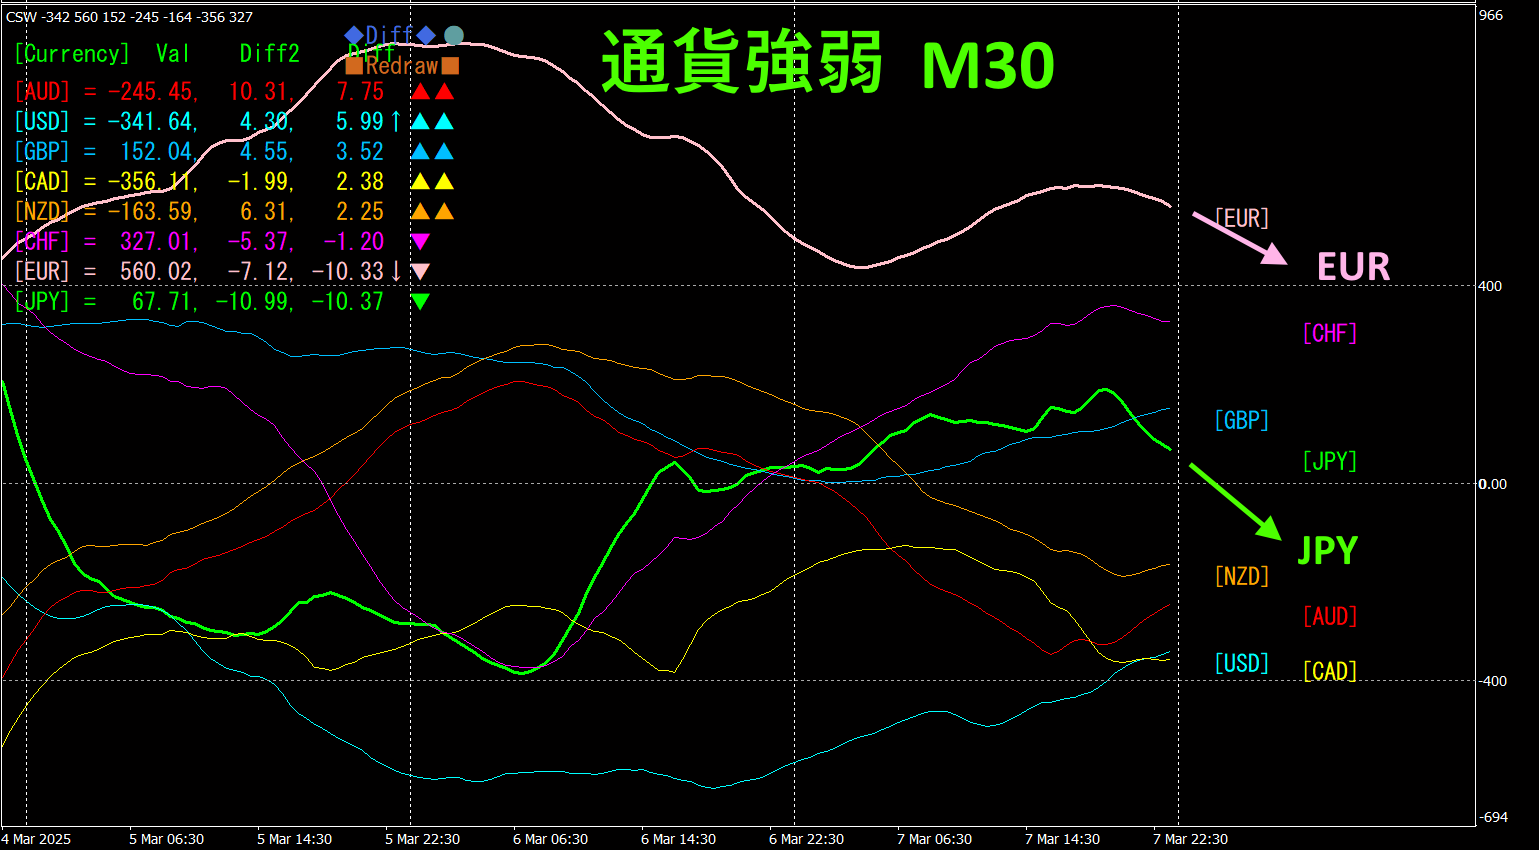
Pink isEUR, green isJPY. In the currency strength chart,JPY and > EUR both trend downward, with nearly identical slopes. In currency strength,JPY. Going forward, the direction depends on which vector each will take, but for now there is no clear directional bias.
4. Using the Visualization Indicator on the Daily Chart
The figure below shows the “8CP Visualization Indicator” Oceania
NZDUSD had bottomed and reversed, retraced a bit, but started moving up again. However, the upside momentum is not very strong. Among Oceania currency pairs,EURAUD is the strongest to the upside, so rather than chasing NZDUSD, it might be better to focus onEURAUD for the time being.

5. Recommended indicators
“Swap target indicator”
https://www.gogojungle.co.jp/tools/indicators/48183
“Toretore Indicator”
https://www.gogojungle.co.jp/tools/indicators/50115
“TrendLine-EX”


https://www.gogojungle.co.jp/tools/indicators/42257
“8C Currency Strength Visualization Indicator”

MT4 version https://www.gogojungle.co.jp/tools/indicators/39150
version https://www.gogojungle.co.jp/tools/indicators/39159
【My listed products】


